Youcef Tamene* | Lazhar Serir
© 2019 IIETA. This article is published by IIETA and is licensed under the CC BY 4.0 license (http://creativecommons.org/licenses/by/4.0/).
OPEN ACCESS
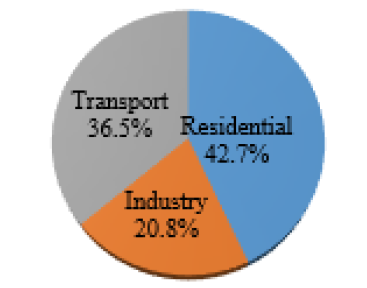
Energy consumption is a worldwide concern and improving insulation is a way to save energy in buildings. In Algeria about 42.7% of the total energy is consumed by residential sector. This study investigates the thermal behaviour of external walls used in buildings located in a chosen Algerian city under real climatic conditions. The transient heat conduction through a composite wall made of 3 or 5 parallel layers of different materials and thicknesses was numerically resolved. The equations system resolution was carried out by the finite differences method according to the Crank-Nicolson scheme. The outdoor temperature and the solar heat flux were approximated using analytic expressions, and were used as boundary conditions in the developed FORTRAN program. Simulations were performed for materials used in actual building constructions in Batna city as well as for materials proposed to improve insulation and an approach to define the costs of studied cases was developed. The results show that the actual way of construction gives poor thermal insulation. We proposed several technical solutions for new constructions as well as for the existing buildings to improve energy efficiency at lower costs.
economical study, energy efficiency, multi-layer wall, thermal insulation
Energy efficiency in buildings nowadays is a prime objective for energy policy at regional, national and international levels, because of the global warming and depletion of fossil fuels. Growth in population and the increasing demand for comfort levels assure the upward trend in energy demand in the future. Many countries have taken conscience of the importance of the energy efficiency in buildings; they try to reach the nearly zero-energy buildings [1]. Studies to achieve better thermal insulation for reducing the energy consumption are still relevant for these countries. There are many tools already established in Europe to evaluate the sustainability of a building using social and economic indicators [2].
Materials based on natural resources, have been used for thermal insulation purposes, these materials were often located on the building envelope, there were many experimental studies that focused on the use of green insulating material [3-5]. The study of F. Asdrubali et al. aims to analyze the structural, thermal, acoustical and environmental properties of wooden materials for building applications [6]. Other properties such as fire resistance and durability were also taken into account. Korjenic et al. gave results of research and development of insulation materials based on natural fibers [7]; and their application into buildings with plant facades and roofs. They also mentioned hydrothermal behaviour of the developed materials, including computational simulation of behaviour of the optimal hemp fiber based material after building into a structure with plant facade.
Tudiwer and Korjenic developed a method to compare between the green part of the façade and the not green part possible [8]. They deducted that there is a difference in the thermal resistance between greened and not greened parts of the façades in winter, depending on the greening system and its location.
However Sierra-Pérez highlighted that the use of natural insulation materials does not necessarily imply a reduction of environmental impacts [9]. This is due to manufacturing processes with low technological development.
Other researchers are interested by waste materials used as insulation [10], or by judiciously chosen design variables like orientation, window size, overhang system, glazing and walls specifications [11].
Over the past years, several solutions of building insulations were studied by many researchers taking into account the specificity of each country.
Ma et al. investigated the main factors influencing the energy consumption of public building located in the north of china by using eQUEST building energy simulation software [12]. They conclude that air conditioning system, lighting density and building envelope have the most significant impacts influencing the building energy consumption.
Ozel studied thermal performance and optimum insulation thickness of building walls with different structure materials for a south-facing wall and the climatic conditions of Elazığ, Turkey [13]. The yearly cooling and heating transmission loads are calculated by using an implicit finite difference method under steady periodic conditions.
Mahlia and Iqbal investigated the potential cost savings and emission reduction achieved after installation of different insulation materials of optimum thickness in building's walls in Maldives [14]. Bolattürk was interested in the determination of optimum insulation thickness in external walls of buildings, and he made a comparative analysis based on the annual heating and cooling loads in the warmest zone of Turkey [15]. Al-Sanea et al. used a numerical model based on finite-volume method in order to compute the yearly cooling and heating transmission loads under steady periodic conditions through a typical building wall for different insulation thicknesses in Saudi Arabia [16]. The optimum insulation thickness of the external wall, and the energy savings over a lifetime of 10 years were calculated by Ucar and Balo [17] for four different insulation materials applied externally on walls at four cities in Turkey. Daouas et al. [18] used an analytical method, based on complex finite Fourier transform to resolve transient heat transfer through multilayer walls and they developed a Matlab program to analyze the thermal performance of building walls in presence of periodic outside ambient temperature and solar radiation, specific to the city of Tunis.
Petter treated the advantages and disadvantages of thermal building insulation materials and solutions [19], he deduced that there exist no single insulation material or solution capable of fulfilling all the requirements, several insulation materials and solutions are used and will have to be used depending on the exact circumstances and specifications.
Pérez-Lombard et al. analysed available information concerning energy consumption in buildings, and particularly related to heating, ventilation and air-conditioning systems [20]. They presented comparisons between different countries especially for commercial buildings, finally they concluded that a proliferation of energy consumption and CO2 emission on the construction environment must make efficient energy strategies a priority in energy policies, and therefore develop new building regulations and certification schemes.
To improve the thermal insulation and therefore reduce the energy consumption of buildings, several solutions have been proposed depending on the specificities of each country, and the building nature, but the main problem is costs. In the building thermal behaviour approach, the reason behind the energy performance gap lies in the contradictory aims of energy efficiency and cost. Various arrangements between energy efficiency and cost can be found and both aims may be successfully obtained.
In Algeria and from the report of the energy ministry about the national energy balance of 2015 [21], the residential building sector was the largest energy consumer, followed by transportation and industrial sectors (Figure 1).
Figure 1. Energy consumption by sector (2015) [21]
From the same document we noticed that the demand in electricity and gas continues to increase (Table 1).
Table 1. Energy consumption [21]
|
|
Electricity (Gwh) |
Gas (106 m3) |
Gas and Electricity(Ktep) |
|
Sector |
All |
All |
Residential |
|
Quantity in 2013 |
43156 |
11177 |
12 269 |
|
Quantity in 2014 |
45766 |
11860 |
12595 |
|
Quantity in 2015 |
50152 |
12961 |
13925 |
|
Evolution (2014/2015) |
+4386 (+9.58%) |
+1101 (9.28%) |
+1328 (+10,54%) |
|
Evolution (2013/2015) |
+ 6996 (16.2%) |
+ 1784 (15.96%) |
+ 1656(13.49%) |
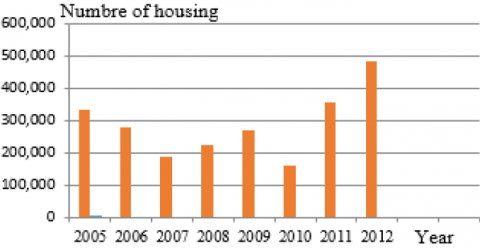
During these last years, Algeria experienced a significant increase in housing implementations [22] (Figure 2), but the Algerian urbanism authorities do not impose building insulation applications; pretext of higher prices of construction.
Figure 2. Housing construction since 2005 [22]
In this study we developed in-house program to study a transient heat transfer through an external multilayer wall for several configurations, we used real climatic conditions of an Algerian city as boundary conditions, for winter and summer periods; and then we studied the better configuration for a good thermal insulation at lower cost; for new constructions as well as for the existing buildings.
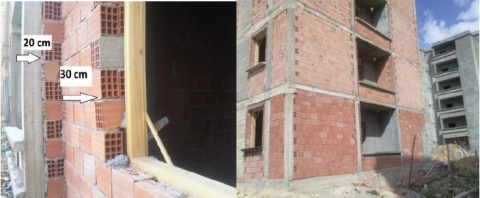
To perform this study, we chose the city of Batna (latitude 35 ,75’N, longitude 6,18’E) as a model, it is the fifth biggest city in Algeria and its climate is very hot in summer (41.5°C) and very cold in winter (-4°C).
The constructions of external walls in this city are made following three configurations (Figures 3 and 4), the wall thickness is equal to 15, 20 or 30 cm, and the material used is brick.
Figure 3. View of a collective construction
Figure 4. View of private construction
2.1 Thermal study
To study the thermal behaviour of the current building, i.e. building currently under construction, we took four types of walls (Table 2a), the first three types are used in building constructions, and the fourth is the one we propose. For existing buildings, to investigate the thermal performance with the proposed technical solutions, we studied four cases (Table 2b).
Table 2a. Configurations of the actual constructions
|
Thickness |
Configuration 1 |
Configuration 2 |
Configuration 3 |
Configuration 4 |
|
l1 |
2 cm plaster |
2 cm plaster |
2 cm plaster |
2 cm plaster |
|
l2 |
15 cm brick |
20 cm brick |
30 cm brick |
10 cm brick |
|
l3 |
2 cm mortar |
2 cm mortar |
2 cm mortar |
5 cm air |
|
l4 |
0 |
0 |
0 |
15 cm brick |
|
l5 |
0 |
0 |
0 |
2 cm mortar |
Table 2b. Configurations of the existing constructions
|
Thickness |
Configuration 5 |
Configuration 6 |
Configuration 7 |
Configuration 8 |
|
l1 |
6.5 cm glass wool |
4 cm cork |
6.5 cm glass wool |
4 cm cork |
|
l2 |
2 cm plaster |
2 cm plaster |
2 cm plaster |
2 cm plaster |
|
l3 |
15 cm brick |
15 cm brick |
30 cm brick |
30 cm brick |
|
l4 |
2 cm mortar |
2 cm mortar |
2 cm mortar |
2 cm mortar |
2.1.1 Weather data
The external wall is submitted to a variable solar heat flux and convective exchange with real outdoor temperature.
The solar heat flux on south vertical surface measured at Batna city [23] are presented for two months, January for the winter period and July for summer period. Table 3 gives the solar flux from sunrise to sunset of two typical days.
Table 3. Solar heat flux on vertical south surfaces [23]
|
January |
July |
||||
|
Hour |
Time (h) |
φ(W/m2) |
Hour |
Time (h) |
φ(W/m2) |
|
7 h |
0 |
0 |
5 h |
0 |
0 |
|
7 h 30 |
0.5 |
220 |
6 h |
1 |
40 |
|
8 h |
1 |
320 |
7 h |
2 |
80 |
|
8 h 30 |
1.5 |
380 |
8 h |
3 |
90 |
|
9 h |
2 |
450 |
8h 30 |
3.5 |
100 |
|
9 h 30 |
2.5 |
520 |
9 h |
4 |
140 |
|
10 h |
3 |
560 |
10 h |
5 |
200 |
|
11 h |
4 |
620 |
11 h |
6 |
250 |
|
12 h |
5 |
650 |
12 h |
7 |
270 |
|
13 h |
6 |
620 |
13 h |
8 |
250 |
|
14 h |
7 |
560 |
14 h |
9 |
200 |
|
14 h 30 |
7.5 |
520 |
15 h |
10 |
140 |
|
15 h |
8 |
450 |
15h30 |
10.5 |
100 |
|
15 h 30 |
8.5 |
380 |
16 h |
11 |
90 |
|
16 h |
9 |
320 |
17 h |
12 |
80 |
|
16 h 30 |
9.5 |
220 |
18 h |
13 |
40 |
|
17 h |
10 |
0 |
19 h |
14 |
0 |
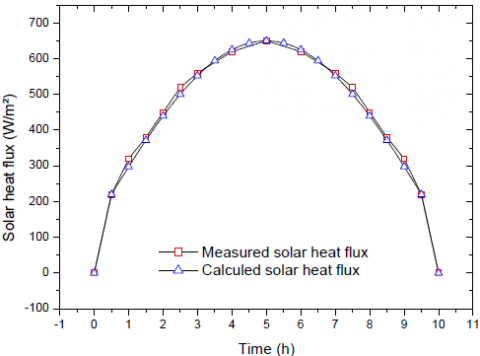
To approximate the measured solar heat flux values we developed the relationships bellow:
For July:
φ(t)=40t for 0≤t≤2h (1)
φ(t)=13.33 t+53.33 for 2≤t≤3.5h (2)
φ(t)=580.416 $\sin \left| \frac{\pi t}{{{\tau }_{1}}} \right|$ for 3.5≤t≤7h (3)
φ(t)=φ(14-t) for 7≤t≤14h (4)
φ(t)=0 for 14≤t≤24h (5)
For January:
φ(t)=440t for 0≤t≤0.5h (6)
φ(t)=509.74 $\sin \left| \frac{\pi t}{{{\tau }_{2}}} \right|$ +140.26 for 0.5≤t≤5h (7)
φ(t)=φ(10-t) for 7≤t≤10h (8)
φ(t)=0 for 10≤t≤24h (9)
where $\tau_1$=14h and $\tau_2$=10h represent the duration of the day, from sunrise to sunset respectively for July and January days and “t” is the time variation in hours.
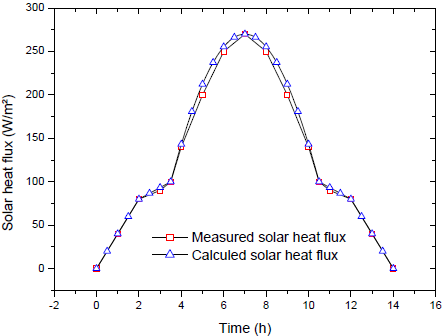
The representations of the measured values and those calculated using the relationships bellow are given in Figure 5 and Figure 6.
Using Microsoft Excel the correlation coefficient r2 was calculate, it is equal to 0.99855 , for July and 0.99793 for January; since r2 tends to 1, therefore there is a good agreement between measured and calculated values.
The external air temperature is presented on Table 4.
Figure 5. Solar heat flux on south vertical surface for July
Figure 6. Solar heat flux on south vertical surface for January
Table 4. Measured external ambient temperature [24]
|
|
January |
July |
||
|
Days |
TM (°C) |
Tm (°C ) |
TM (°C ) |
Tm (°C) |
|
1 |
12.7 |
0 |
33.3 |
13.9 |
|
2 |
11 |
-1.5 |
34.3 |
18.4 |
|
3 |
7.3 |
2 |
35 |
16.4 |
|
4 |
10.5 |
3.5 |
33 |
16 |
|
5 |
11.6 |
2 |
29.4 |
14.4 |
|
6 |
14 |
-1 |
30.4 |
12.7 |
|
7 |
16.2 |
-2 |
32.1 |
13.4 |
|
8 |
18 |
-2.4 |
33.6 |
15.5 |
|
9 |
18.6 |
-3 |
34 |
15.9 |
|
10 |
15 |
-2 |
33.6 |
15 |
|
11 |
14.6 |
-2.5 |
35.5 |
14 |
|
12 |
14 |
-1 |
37.4 |
17 |
|
13 |
13.5 |
1.7 |
38.4 |
18.1 |
|
14 |
8.8 |
2 |
34.8 |
17 |
|
15 |
8.5 |
-1.4 |
35.4 |
15.8 |
|
16 |
11 |
1.8 |
36.5 |
17 |
|
17 |
11.5 |
6 |
36 |
20 |
|
18 |
11.3 |
5 |
34.4 |
18 |
|
19 |
17 |
9.4 |
36 |
17 |
|
20 |
10.7 |
4 |
38.5 |
21 |
|
21 |
12.9 |
1.5 |
38.4 |
21 |
|
22 |
11.4 |
-0.5 |
35 |
17.2 |
|
23 |
9 |
1 |
35.3 |
19 |
|
24 |
10.2 |
0.4 |
36 |
19.8 |
|
25 |
6.7 |
0 |
37.2 |
19.8 |
|
26 |
5.4 |
-4 |
39.5 |
19.6 |
|
27 |
12.2 |
2 |
40.5 |
22 |
|
28 |
11 |
0.8 |
41.5 |
23 |
|
29 |
13 |
2.1 |
37.6 |
24 |
|
30 |
19.7 |
-2.9 |
36 |
19.1 |
|
31 |
18 |
-1 |
33 |
17.3 |
|
Average Temperature |
12.4 |
0.6 |
35.5 |
17.7 |
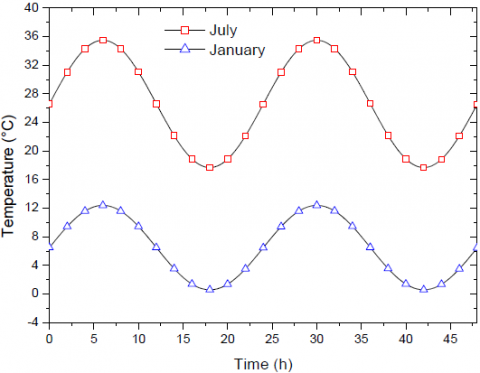
Using the values of the average maximum and minimum temperatures, and by supposing that the evolution of temperature is sinusoidal [18, 25] the relationship below was developed to approximate the measured values of external air temperature:
T=A $\sin (\frac{\pi t}{{{\tau }_{2}}} )$ for 0≤t≤24 (10)
Were $\tau_3$=12h, A and B are constant with:
A=5.9; B=6.5 for January
A=8.9; B=26.6 for July
The values obtained are presented in Figure 7.
Figure 7. Evolution of external ambient temperature
2.1.2 Mathematical model
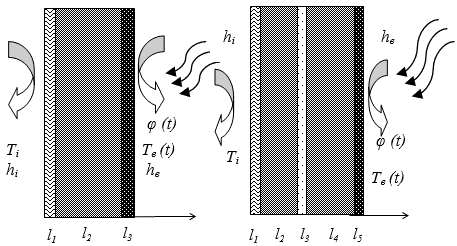
The present analysis is concerned with the transient heat conduction through a composite wall consisting of 3 or 5 parallel layers of different materials and thicknesses (Figure 8).
Figure 8. Schematic multilayer walls
For the case the following modelling assumptions are made:
- Heat transfer in the wall is one dimensional and unsteady.
- Physical properties are constants.
- There is no heat source in the wall.
- The contact between the wall layers is perfect.
The heat transfer through each layer of the composite wall is governed by the following heat conduction equation:
$α_j ∂^2 T_j/∂x^2 =∂T_j/∂t$ For $l_(j-1)<x<l_j$ $j=1,2,..n$ (11)
where $α_j=λ_j/(ρ_j c_{p_j} )$; $l_0=0$ and n=3 or 5
Boundary conditions
$-λ_1 (∂T_1)/∂x=h_i (T_i-T_1 )$ For $x=0$ (12)
$λ_j (∂T_j)/∂x=λ_(j+1) (∂T_{j+1})/∂x$ and $T_j=T_(j+1)$
For $x=l_j$ $j=1,..n-1$ (13)
$-λ_n (∂T_n)/∂x=h_e (T_n-T_e (t))-βφ(t)$ For $x=l_n$ (14)
Initial conditions:
$T=T_{am}$ For $t=0$ and $0<x<l_n$ (15)
The external face of the wall is subjected to the incident solar radiation. Moreover, the solar energy absorbed by the wall occurs very close to the surface; therefore, it is treated as a heat flux [26].
The heat transfer coefficient h in free convective heat transfer for air is between 2 and 25 W/m2•K [27], it was assumed in the study as the minimal values, so we took $h_i=5$ W/m2•K and h_e=10 W/m2•K.
Knowing that for white smooth surface the solar absorptivity coefficient β it is between 0.25 and 0.4 [28], β=0.3 was used for all studied cases.
The summer comfort temperatures are between 23 and 29 °C, and those for winter are between 20 and 23 °C [29], the design indoor temperature is taken constant and equal to 25 °C for July (with air-conditioning), and 21 °C for January (with heating).
The resolution of the system of equations was realised using the finite differences method according to the Crank-Nicolson scheme. The simulated results were performed for materials used in building constructions in Batna city, and materials proposed to improve insulation. Their physical properties are presented in Table 5 [30].
Table 5. Physical properties for used materials [30]
|
|
Brick |
Mortar |
Plaster |
Cork |
Glass wool |
|
ρ(kg/m3) |
1900 |
2050 |
825 |
40 |
62 |
|
cp(J/ Kg.K) |
920 |
950 |
1000 |
2100 |
840 |
|
λ(W/m.K) |
1.11 |
1.96 |
0.25 |
0.042 |
0.035 |
The radiative component of heat transfer between the surfaces facing the cavity is not taking into account and the dominant mode of heat transfer through the air gap is conduction, therefore air thermal properties are taken as follow:
$λ_{eff}=0.167 W/(m.K) and α=1.5 x10^{-4} m^2/s $[18]
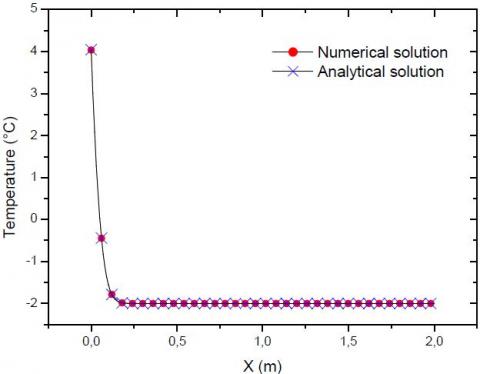
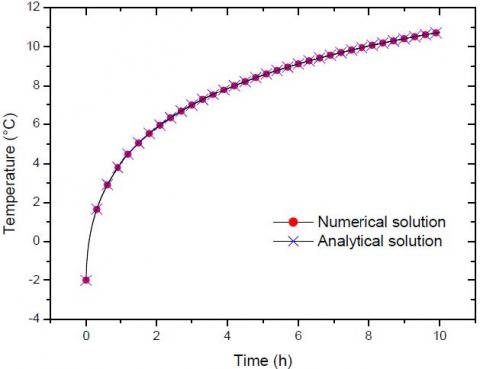
2.1.3 Validation
Software products can be validated with three methods: analytic solution, empirical validation and comparative tests [31]. To validate our FORTRAN programme, we compared the results with the analytic solution.
We consider a heat transfer through a 2m mortar slab (it can be assumed as a semi-infinite medium).
The left side is subjected to convective exchange with environment. The heat transfer coefficient, the outdoor temperature and the initial temperature are respectively:
$h=9 w/(m^2.K); T_∞=21°C; T_i=-2°C$
The analytical solution is given by:
$(T(x,t)-T_i)/(T_∞-T_i )= erfc(x/(2√(α t)))-[exp((h x)/λ+ α t h^2/λ^2)erfc(x/(2√(α t))+h/λ √(α t))]$
In our FORTRAN program, we took the same properties and boundary conditions for a multilayer wall, with dimensions from left to right equal respectively to: l1=0.3m, l2=1.4m, l3=0.3m
For the right side and from equation (14) he and β are taken equal to 0. Results obtained numerically and analytically are presented in Figure 9.
We noted a perfect agreement, so the interface and boundary problems are numerically well treated, therefore the in-house Fortran program can be used for a more complex problem.
(a)
(b)
Figure 9. (a) Temperature through the slab after 1 hour; (b) Left side temperature of the slab
3.1 Current construction case
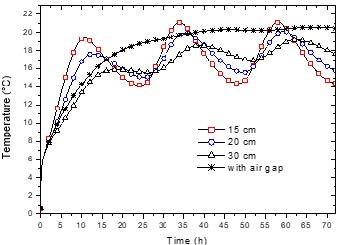
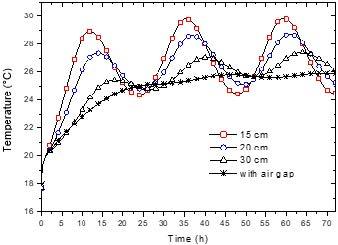
Using the program for the four configurations with the climatic conditions of July and January, approximated by relations (1-10), as boundary conditions, the internal side temperature evolution of the multilayer wall is shown during 72 hours period in Figure 10 for January, and in Figure 11 for July.
We observe that after 24 hours the thermal equilibrium is reached for the first and second configurations, and it is attained after 48 hours for the third and fourth configurations. We note also that the fluctuation is reduced for the third configuration comparatively to the first and second, this is mainly due to the increase of the thicknesses.
Figure 10. Internal side temperature in January
Figure 11. Internal side temperature in July
Table 6. Difference between the internal side and internal ambient temperatures for January (Case of current construction)
|
January |
Tm (°C) |
TM (°C) |
Ti-Tm (Night) (°C) |
Ti-TM (Day) (°C) |
|
Configuration 1 |
14.4 |
21.3 |
6.6 |
-0.3 |
|
Configuration 2 |
15.59 |
20.15 |
5.41 |
0.85 |
|
Configuration 3 |
17 |
19.2 |
4 |
1.8 |
|
Configuration 4 |
20.27 |
20.5 |
0.73 |
0.5 |
For a good insulation in winter, the internal side temperature must be as high as possible compared to the external ambient temperature, and in summer it must be as low as possible. Knowing that when the difference between the internal side temperature and the internal ambient temperatures is low, the energy consumption for heating or for air conditioning decreases, and from Tables 6 and 7, it is clear that the fourth and third configurations give good thermal insulation, and decreased the energy consumption either in winter and summer.
Table 7. Difference between the internal side and internal ambient temperatures for July (Case of current construction)
|
July |
Tm (°C) |
TM (°C) |
Tm-Ti (Night) (°C) |
TM-Ti (Day) (°C) |
|
Configuration 1 |
24.5 |
29.8 |
-0.5 |
4.8 |
|
Configuration 2 |
25.22 |
28.59 |
0.22 |
3.59 |
|
Configuration 3 |
26 |
26.82 |
1 |
1.82 |
|
Configuration 4 |
25.79 |
25.65 |
0.79 |
0.65 |
3.2 Existing building case
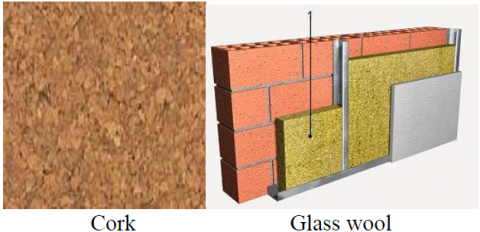
Energy-retrofitting of existing buildings is vital to achieve energy reductions, to improve thermal insulation of existing buildings. We studied the case were another inside layer of cork or glass wool is added Figure 12, four configurations were studied Table 2.b.
Figure 12. Sample of the cork and the glass wool
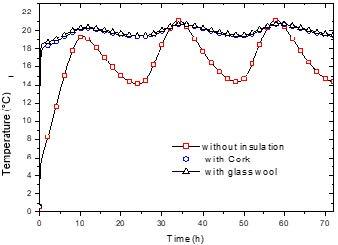
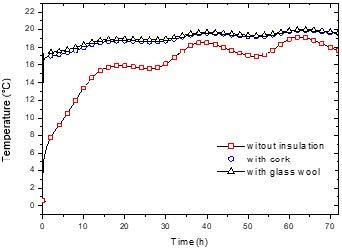
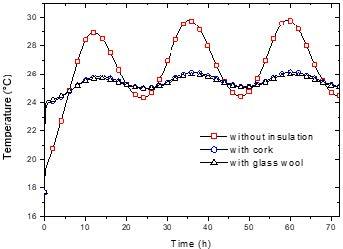
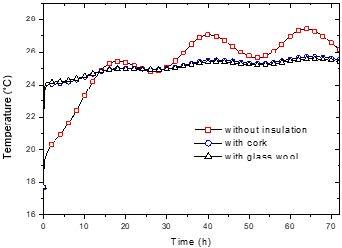
The internal side temperature evolution of the multilayer wall is shown during 72 hours period in Figure 13 and 14 for January, and in Figure 15 and 16 for July.
We note that after 48 hours the thermal equilibrium is reached for all configurations.
Following the same method, when the difference between the internal wall side temperature and the indoor temperature is low, the energy consumption decreases and from the results presented in Tables 8 and 9, it is clear that the fifth and sixth configurations significantly improve thermal insulation comparatively to the first configuration, either in winter or summer.
Figure 13. Internal side temperature in January with and without insulation (configuration 1-5-6)
Figure 14. Internal side temperature in January with and without insulation (configuration 3-7-8)
Figure 15. Internal side temperature in July with and without insulation (configuration 1-5-6)
Figure 16. Internal side temperature in July with and without insulation (configuration 3-7-8)
The same improvement in thermal insulation is observed between the seventh and eighth configurations comparatively to the third configuration. It is clear that adding the layer of cork or glass wool decreases considerably the energy consumption.
Table 8. Difference between the internal side and ambient temperatures for January (Case of the existing constructions)
|
January |
Tm (°C) |
TM (°C) |
Ti-Tm (Night) (°C) |
Ti-TM (Day) (°C) |
|
Configuration 1 |
14.4 |
21.3 |
6.6 |
-0.3 |
|
Configuration 5&6 |
19.38 |
20.73 |
1.62 |
0.27 |
|
Configuration 3 |
17 |
19.2 |
4 |
1.8 |
|
Configuration 7&8 |
19.35 |
20 |
1 |
1.65 |
Table 9. Difference between the internal side and ambient temperatures for July (Case of the existing constructions)
|
July |
Tm (°C) |
TM (°C) |
Tm-Ti (Night) (°C) |
TM-Ti (Day) (°C) |
|
Configuration 1 |
24.5 |
29.8 |
- 0.5 |
4.8 |
|
Configuration 5&6 |
25 |
27.9 |
0 |
2.9 |
|
Configuration 3 |
25.2 |
27 |
0.2 |
2 |
|
Configuration 7&8 |
25.29 |
25.5 |
0.29 |
0.5 |
From thermal analysis, presented in sections 3.1 and 3.2, the costs of the two best configurations which give a relative good thermal insulation for current constructions as well as those of the configurations used to improve the thermal insulation of existing constructions for 12 m² (4mx3m) wall surface were calculated. Knowing the price of the brick, cork and glass wool (shown in Table 10), and knowing that the number of the bricks is equal to the surface of the wall divided by the surface of one brick. Similarly, we have the number of cork plaques equal to the surface of the wall divided by the surface of one plaque, (for the glass wool, it sold by m²) then we get the following results:
Table 10. Prices of the used materials (120 DA=1 Euro)
|
Materials |
Dimensions (cm) |
Price (DA) |
|
Brick 12 |
30x20x15 |
33/unit |
|
Brick 8 |
30x20x10 |
23/unit |
|
Cork |
100 x 50x4 |
1560/m² |
|
Glass wool |
---x--- x 6.5 |
781,26/m² |
4.1 Current constructions case
$M_1=2 ×12/(0.3 × 0.2)=400$
The price is:
$P_1=400×33=13200 D.A$
For the fourth configuration the number of brick 12 required are:
$M_2= 12/(0.3 × 0.2)=200$
The number of brick 8 required is:
$M_3= 12/(0.3 × 0.2)=200$
Then the price is:
$P_2=(200×33)+(200×23)=11200 DA$
4.2 Existing building case
For the fifth configuration the number of cork plaque required is:
$M_4= 12/(1 × 0.5)=24$
The price of the wall with cork is:
$P_3=(200×33)+(24×1560)=44040 D.A$
The price of wall with glass wool (sixth configuration) is:
$P_4=(200×33)+(12×781.26)=15975.12 D.A$
For the seventh configuration the price of the wall with cork is:
$P_5=(400×33)+(24×1560)=50640 D.A$
The price of the wall with glass wool (eighth configuration) is:
$P_6=(400×33)+(12×781.26)=22575.12 D.A$
4.3 Discussion
For the current constructions and since the layers of plaster and mortar are the same for all configurations their prices will not affect the global cost, a summary of prices in Euros is presented in Table 11.
Table 11. Prices of current constructions walls
|
Wall Thickness |
30 cm |
25 cm with 5 cm Air Gap |
|
Price (D.A) |
13200 |
11200 |
|
Price (Euro) |
110 |
93.33 |
|
Price per m² (Euro) |
9.166 |
7.77 |
From heat insulation and price perspectives, we note that the fourth configuration was better than the third.
For the existing constructions, the prices summary is presented in Table 12, it is clear that the configuration with a glass wool layer is cheaper than the configuration with a cork layer. Knowing that they give the same results in terms of thermal insulation, the choice is quickly made.
Table 12. Prices of existing constructions walls with the technical solutions proposed
|
Wall thickness |
15 cm with a cork layer |
15 cm with a glass wool layer |
30 cm with a cork layer |
30 cm with a glass wool layer |
|
Price (D.A) |
44040 |
15975 |
50640 |
22575 |
|
Price (Euro) |
367 |
133.12 |
422 |
188.125 |
|
Price per m² (Euro) |
30.58 |
11.09 |
35.16 |
15.67 |
A numerical solution of transient heat transfer through multilayer walls was provided using finite difference technique and a FORTRAN program was developed, in order to analyze building walls thermal performance in presence of periodic outside ambient temperature and heat solar flux, specific to the city.
This method predicted variations of the inside surface temperature of four types of walls made of brick and compared their thermal performances and their effects on indoor temperature.
An economical study of the external walls cost was presented based on their thermal performances. It was found that the current way of construction provides poor thermal insulation and contributes to the increase of energy consumption. However, it was shown that by adding a 5 cm air gap, good thermal insulation can be obtained at lower cost, and therefore it saves heating energy in winter and air conditioning in summer. We also studied the thermal behavior of existing constructions; we found that thermal isolation can be improved by adding an internal layer of insulation made of cork or glass wool. From an economical point of view, glass wool is cheaper than cork, while they give the same result from thermal insulation point of view, so we recommend glass wool.
The authors would like to thank professor Said Abboudi from M3M laboratory UTBM France, for his help to implement the FORTRAN program.
|
cp |
Specific heat (J. Kg- 1.K- 1) |
|
h |
Heat transfer coefficient (W.m-2.K-1) |
|
l |
Layer thickness (m) |
|
M |
Number of bricks |
|
n |
Number of layers |
|
P |
Price (Algerian Dinar D.A) |
|
t |
Time (s) |
|
T |
Temperature (°C) |
|
Ta |
Air temperature (°C) |
|
Tam |
Average minimum temperature (°C) |
|
Tm |
Minimum temperature (°C) |
|
TM |
Maximum temperature (°C) |
|
Greek symbols |
|
|
λ |
Thermal conductivity (W.m-1.K-1) |
|
ρ |
Mass density (kg .m-3) |
|
α |
Thermal diffusivity (m².s-1) |
|
ϕ |
Heat flux (W) |
|
φ |
Heat flux density (W.m-2) |
|
β |
Solar absorptivity coefficient |
|
Subscripts |
|
|
i |
Internal |
|
e |
External |
|
j |
Number of the layer |
[1] Magrini A, Lazzari S, Marenco L, Guazzi G. (2017). A procedure to evaluate the most suitable integrated solutions for increasing energy performance of the building’s envelope, avoiding moisture problems. International Journal of Heat and Technology 35(4): 689-699. https://doi.org/10.18280/ijht.350401
[2] Moran P, Goggins J, Hajdukiewicz M. (2017). Super-insulate or use renewable technology? life cycle cost, energy and global warming potential analysis of nearly zero energy buildings (NZEB) in a temperate oceanic climate. Energy and Buildings 139: 590–607. https://doi.org/10.1016/j.enbuild.2017.01.029
[3] Agoudjil B, Benchabane A, Boudenne A, Ibos L, Fois M. (2011). Renewable materials to reduce building heat loss: Characterization of date palm wood. Energy and Buildings 43(2-3): 491-497. https://doi.org/10.1016/j.enbuild.2010.10.014
[4] Chikhi M, Agoudjil B, Boudenne A, Gherabli A. (2013). Experimental investigation of new biocomposite with low cost for thermal insulation. Energy and Buildings 66: 267–273. https://doi.org/10.1016/j.enbuild.2013.07.019
[5] Limam A, Zerizer A, Quenard D, Sallee H, Chenak A. (2016). Experimental thermal characterization of bio-based materials (Aleppo Pine wood, cork and their composites) for building insulation. Energy and Buildings 116: 89-95. https://doi.org/10.1016/j.enbuild.2016.01.007
[6] Asdrubali F, Ferracuti B, Lombardi L, Guattari C, Evangelisti L, Grazieschi G. (2017). A review of structural thermo-physical, acoustical and environmental properties of wooden materials for building applications. Building and Environment 114: 307-332. https://doi.org/10.1016/j.buildenv.2016.12.033
[7] Korjenic A, Jiří Zach JH. (2016). The use of insulating materials based on natural fibers in combination with plant facades in building constructions. Energy and Buildings 116: 45-58. https://doi.org/10.1016/j.enbuild.2015.12.037
[8] Tudiwer D, Korjenic A. (2017). The effect of living wall systems on the thermal resistance of the façade. Energy and Buildings 135: 10-19. https://doi.org/10.1016/j.enbuild.2016.11.023
[9] Sierra-Pérez J, Boschmonart-Rives J, Dias AC, Gabarrell X. (2016). Environmental implications of the use of agglomerated cork as thermal insulation in buildings. Journal of Cleaner Production 126: 97-107. https://doi.org/10.1016/j.jclepro.2016.02.146
[10] Aksogan O, Resatoglu R. (2018). An environment friendly new insulation material involving waste newsprint papers reinforced by cane stalks. Energy and Buildings 15: 33-40. https://doi.org/10.1016/j.jobe.2017.10.011
[11] Delgarm N, Sajadi B, Azarbad K. (2018). Sensitivity analysis of building energy performance : A simulation-based approach using OFAT and variance-based sensitivity analysis methods. Journal of Building Engineering 15: 181-193. https://doi.org/10.1016/j.jobe.2017.11.020
[12] Ma H, Du N, Yu S, Lu W, Zhang Z, Deng N, Li C. (2017). Analysis of typical public building energy consumption in northern China. Energy and Buildings 136: 139-150. https://doi.org/10.1016/j.enbuild.2016.11.037
[13] Ozel M. (2011). Thermal performance and optimum insulation thickness of building walls with different structure materials. Applied Thermal Engineering 31(17-18): 3854-3863. https://doi.org/10.1016/j.applthermaleng.2011.07.033
[14] Mahlia TMI, Taufiq BN, Ismail, Masjuki HH. (2007). Correlation between thermal conductivity and the thickness of selected insulation materials for building wall. Energy and Buildings 39(2): 182-187. https://doi.org/10.1016/j.enbuild.2006.06.002
[15] Bolattu A. (2008). Optimum insulation thicknesses for building walls with respect to cooling and heating degree-hours in the warmest zone of Turkey. Building and Environment 43(6): 1055-1064. https://doi.org/10.1016/j.buildenv.2007.02.014
[16] Al-sanea SA. (2005). APPLIED Effect of electricity tariff on the optimum insulation-thickness in building walls as determined by a dynamic heat-transfer model. Applied Energy 82(4): 285-368. https://doi.org/10.1016/j.apenergy.2004.10.014
[17] Ucar A, Balo F. (2010). Determination of the energy savings and the optimum insulation thickness in the four different insulated exterior walls. Renewable Energy 35(1): 88–94. https://doi.org/10.1016/j.renene.2009.07.009
[18] Daouas N, Hassen Z, Aissia HB. (2010). Analytical periodic solution for the study of thermal performance and optimum insulation thickness of building walls in Tunisia. Applied Thermal Engineering 30(4): 319-326. https://doi.org/10.1016/j.applthermaleng.2009.09.009
[19] Petter Jelle B. (2011). Traditional, state-of-the-art and future thermal building insulation materials and solutions – Properties, requirements and possibilities. Energy and Buildings 43(10): 2549–2563. https://doi.org/10.1016/j.enbuild.2011.05.015
[20] Pérez-Lombard L, Ortiz J, Pout C. (2008). A review on buildings energy consumption information. Energy and Buildings 40(3): 394–398. https://doi.org/10.1016/j.enbuild.2007.03.007
[21] Algerian Energy Ministry (2017). The national energy balance of 2015-2016. Available: http://www.energy.gov.dz/francais/uploads/images/2017/Bilan-energetique/BEN2015.pdf
[22] Algerian Ministry of Housing &Town Planning, Statistiques. Available: http://www.mhuv.gov.dz/Fichiers/Statistiques/37.pdf
[23] M. Capderou. Atlas Solaire de l’Algérie.(1987). Tome 1 Vol 1 et 2. Office des publications universitaire. Algerie.
[24] Meteo Web Site (2016). http://fr.tutiempo.net/climat/01-2013/ws-604680.html, accessed on Nov. 20, 2016.
[25] dos Santos GH, Mendes N. (2009). Heat, air and moisture transfer through hollow porous blocks. International Journal of Heat and Mass Transfer 52(9-10): 2390-2398. https://doi.org/10.1016/j.ijheatmasstransfer.2008.11.003
[26] Russell F. (2003). Heat transfer analysis and modeling of a parabolic trough solar receiver implemented in engineering equation solver. National Renewable Energy Laboratory 164. https://doi.org/NREL/TP-550-34169
[27] Cengel YA. (2003). Heat transfer: A practical approach. Mc Graw-Hill 785–841.
[28] The engineering toolbox. https://www.engineeringtoolbox.com/solar-radiation-absorbed-materials-d_1568.html. accessed on May 6, 2017.
[29] Stein B. (1997). Building technology: Mechanical and electrical systems. Second. J. Wiley.
[30] Tamene Y, Abboudi S, Bougriou C. (2011). Study of heat and moisture diffusion through a wall exposed to solar heat flux. Journal of Engineering Science and Technology 6(4): 429-444.
[31] Plessis G , Lindsay A, Kaemmerlen A, Renardières S, Cedex L. (2014). BuildSysPro: A Modelica library for modelling buildings and energy systems. Proceedings of the 10th International Modelica Conference March 10-12, 2014, Lund, Sweden, pp. 1161-1169. https://doi.org/10.3384/ECP140961161