© 2018 IIETA. This article is published by IIETA and is licensed under the CC BY 4.0 license (http://creativecommons.org/licenses/by/4.0/).
OPEN ACCESS
With ROI can not obtained easily under uneven illumination ,the purpose of this study was to solve the the problem of low precision and slow speed when orientation holes positioning is performed manually. A novel hybrid extraction method in frequency domain( LS- Power Density Algorithm)was adopted in this paper. The results indicated that the region of interest (ROI) can be obtained easily with help of Canny operator and Otsu algorithm in image prepossessing technology. Furthermore,in the context of PCB images with background noise and uneven illumination, LS- power density algorithm play an important role on punching recognition and the orientation holes positioning of printed board.Moreover, compared with the existing orientation positioning techniques( k-means , LMS and SVM), the improved algorithm can reach a good result. At last the performance of LS-PSD is carefully evaluated by simulation in MATLAB.And the findings of this study may serve as electronic information process of mobile industry.
orientation holes positioning, LS-Power spectrum density(LS-PSD), Image processing technology, region of interest (ROI)
With the rapid development of the electronic information industry., cameras and smart-phones, and the growing demands on “more holes, smaller pore diameter and shorter line spacing” in designated area of PCB, the products manufacturing industry of electronic information pay much more attentions on identifying the Region of Interest of the PCB printed board. Obviously, this task is of great challenge to product manufactures. To deal with the problem, orientation positioning techniques has been proposed and receives growing attention in the recent years (Shen et al., 2016; Zhang et al., 2015; Liu et al., 2015; Sanchez and Hernandez-Cabronero, 2018; Zhang et al., 2017).
However, in practice, the image groups are achieved under complex settings and scenarios, such as diverse backgrounds, poor or illumination conditions and photo point variations. The main aim of the orientation positioning techniques task is to get the interesting information, i. e., the common and special shape with fixed dimension from a group images weakly prepossessing as contained with similar features, while this work is evidently more challenging while the orientation positioning in real applications, such as k-means, LMS and SVM methods are studies in recent years (Santosh et al., 2016; Kuang et al., 2016; Joshi et al., 2016; Zandi et al., 2016; Qian et al., 2017).
With the repaid development of electronic industry, high precision and fast speed of ROI detection are demanded nowadays. For solving the problem, we make the effort to clarify a natural relationship between gray image, Otsu image processing and image equalizing. So, a novel hybrid extraction method in frequency domain (LS- Power Density Algorithm) was adopted in this paper. With the help of initial extraction, the hybrid extraction is hopeful to deal with the problem of orientation different types holes positioning of PCB.
The rest of this paper is organized as follow, the PSD filter is introduced in Section 2. And Section 3 is focus on bottom-up strategy. Simulation and analysis are studied in Section 4. The conclusions are drawn in Section 5.
A novel method,aiming at Via -holes ROI detection, is introduced hereafter. Compared most Power Spectrum Density (PSD), the convergence rate of the ROI detection should be improved. Some researchers pay much more attention on the complex features such as edge and intensity (Santosh et al., 2016; Kuang et al., 2016; Joshi et al., 2016; Zandi et al., 2016; Qian et al., 2017; Ur-Rehman and Zivic, 2017; Roth et al., 2016). However, most detection algorithms in PCB images are based on task-driven strategy, moreover the complex features are made up by linear combination of two or three indexes (Itti et al., 1998; Harel et al., 2007; Hou and Zhang, 2007; Cheng et al., 2011; Li and Itti, 2011; Cui et al., 2017; Loog and Lauze, 2010; Li et al., 2016; Tao et al., 2013; Sebe, 2001) (such as
On the other hand, some researchers also considered the characteristics in frequency domain to compute the salient map (Zhang et al., 2016; Carson et al., 2002). Furthermore, some hybrid strategy is also proposed (Carson et al., 2002; Shi et al., 2015; Zhang et al., 2014).Compared with serial strategy, the hybrid strategy can deal with more throughout of image data at set time. Therefore, to located Via -holes ROI detection in Printed Board, a hybrid ROI detection method is proposed in this paper.The proposed LS- power spectrum density ROI detection method (LS-PSD) is made up by bottom-up and top-down strategies. The schematic of the LS-PSD is shown in Figure 1.
Figure 1. Framework of LS- power spectrum density ROI detection method (LS-PSD), which can be divided into two parts:(LEFT) Initial extraction ;(RIGHT) Refine extraction
In this section, besides reviewing power spectrum density (PSD), some useful properties are introduced. AR model, MA model and ARMA model are three mixed linear model, and the ARMA model is the combination of MA model and AR model. And the difference equations of ARMA (p,q )are shown as following :
$\sum_{k=0}^{\mathrm{p}} a_{k} x(n-k)=\sum_{k=0}^{q} b_{k} w(n-k)$ (1)
Where $w=\sum_{j=1}^{k} \alpha_{j} \varphi\left(x_{j}\right)$ For simplicity, one can choose $\varphi(x)=K(\bullet, x)$.then the output classification function is
$f(x)=\sum_{j=1}^{k} \alpha_{j} K\left(x_{i}, x\right)+b$ (2)
Then the transfer function of ARMA is
$H(z)=\frac{1+b_{1} z^{-1}+b_{2} z^{-2}+\cdots+b_{q} z^{-q}}{1+a_{1} z^{-1}+a_{2} z^{-2}+\cdots+a_{p} z^{-p}}$ (3)
Where r(l) is auto-correlation coefficient, then
$r_{x}(l)=\left\{\begin{array}{c}{-\sum_{k=1}^{p} a_{k} r_{x}(l-k)+\sigma_{w}^{2} \sum_{k=l}^{q} b_{k} h(k-l) \quad 0 \leq l \leq q} \\ {-\sum_{k=1}^{p} a_{k} r_{x}(l-k) \quad l \geq q}\end{array}\right.$ (4)
Then the power spectrum density (PSD)of the unite system is
$s_{x}(w)=\sigma_{w}^{2}\left|\frac{1+\sum_{k=1}^{q} b_{k} z^{-k}}{1+\sum_{k=1}^{p} a_{k} z^{-k}}\right|=\left.\sigma_{w}^{2}\left|\frac{\prod_{k=1}^{q}\left(1-z_{k} z^{-1}\right)}{\prod_{k=1}^{p}\left(1-p_{k} z^{-1}\right)}\right|_{z=e^{m}}\right|_{z=e^{m}}$ (5)
As can be shown in equation (6), the frequency of PD and the maximum PD value can be calculated by the different window’s spectral density functions (such as Boxcar data sampling, Hamming data sampling and Black-man data sampling etc.).
$\int_{-\infty}^{+\infty}|s(t)|^{2} d t=\int_{-\infty}^{+\infty}|S(f)|^{2} d f$ (6)
In order to have a good and fast pattern recognition result on the classification between gray image, otsu image processing and image equalizing. There are two bottom-up parts in the ROI pattern recognition: data-training stage and data-testing stage. The flow chart based on initial ROI extraction algorithm is shown in Figure 2.
Figure 2. Flow chart based on initial ROI extraction algorithm
3.1. OTSU Image Processing
Suppose i is threshold of image segmentation, the whole image can be divided into two parts Background parts (BP) and Foreground parts (SP). The region area of BP and SP is $\theta_{1}, \theta_{2}$:
$\theta_{1}=\sum_{j=0}^{i} \frac{n_{j}}{n} ; \theta_{2}=\sum_{j=i+1}^{G-1} \frac{n_{j}}{n}$ (7)
where G is the gray degree of the whole image.
Furthermore, the average gray degree of the whole image, Background parts (BP)and Foreground parts (FP) is $\mu, \mu_{1}, \mu_{2}$:
$\mu=\sum_{j=0}^{G-1}\left(f_{j} \times \frac{n_{j}}{n}\right)$ (8)
$\mu_{1}=\frac{1}{\theta_{1}} \sum_{j=0}^{i}\left(f_{j} \times \frac{n_{j}}{n}\right)$ (9)
$\mu_{2}=\frac{1}{\theta_{2}} \sum_{j=i}^{G-1}\left(f_{j} \times \frac{n_{j}}{n}\right)$ (10)
Where $\mu=\mu_{1} \theta_{1}+\mu_{2} \theta_{2}$
With help of OTSU image processing, the binary image can be obtained as shown in Figure 3.
Figure 3. The binary image with OTSU image processing
3.2. Image equalizing and morphological filtering
In the method of LS-SPD, there are three parameters needed to be fixed: the scanning step S, the threshold of maximum value of Via holes X, and the threshold of the voting image Z. In order to obtain the three parameters, three different filtering are designed in different structures.
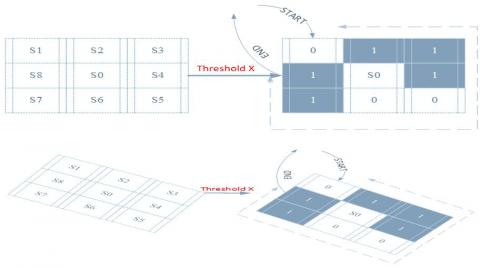
Figure 4. The Features and structure used in detection
Firstly, the threshold of the voting image Z plays an important role in image ROI extraction. The feature and the structure used in detection is shown in Figure 4
With the help of morphological filtering (that is Filter1), the centered distribution map (CDM) is generated by assigning value, which can be located the centered point and can be represented as
$C D M(i, j)=\left\{\begin{array}{c}{1, i=\overline{x_{k}}, j=\overline{y_{k}}} \\ {0, e l s e}\end{array}\right.$ (11)
The centroid distance of distribution indention (CDDI) is defined as:
$C D D I=T e_{n \times n} \otimes C D M$ (12)
Where The is the unit template.
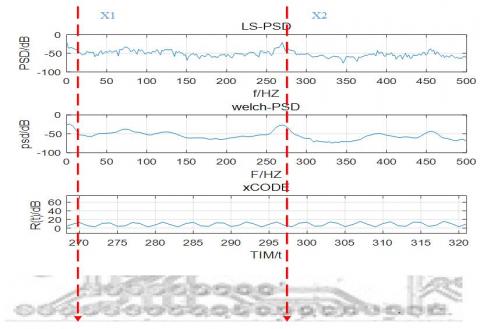
Secondly, the threshold of maximum value of Via holes X can be obtained by PSD filtering (that is Filter2), which can scan across the image at multiple and locations. The feature used PSD in detection is shown in Figure 5.
Figure 5. The Features detection used in LS-PSD
As can be seen from Fig.5, the welch number and the LS-PSD number become high when the number of Via holes of PCB becomes double in number. With the help of numerical fitting tool, the X can defined as equation (13), when the X<0.001, then the number of Via poles should be changed.
$X=k_{1} \frac{d_{L S-P S D}}{d t}+k_{2} \frac{d_{\text {weltat}-P S D}}{d t}$ (13)
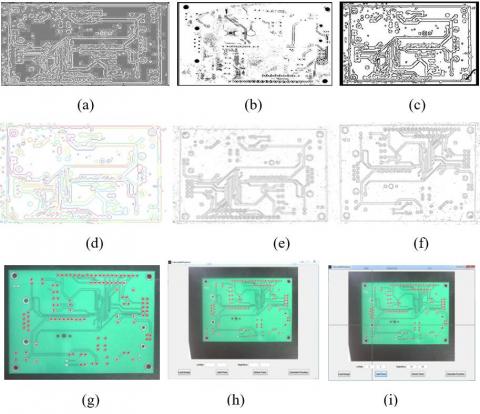
With help of MATLAB 2015a, Fig.6 shows the ROI detection results by the proposed method. Having extracted the Via -holes of PCB in general. And the results show that the proposed LS-PSD algorithm can not only suitable for punching recognition of the circuit board, but also the he orientation holes positioning of printed board as well. Comparisons of precision of K-MEANS, LS-PSD and SVM are shown in Fig.7.On the other hand, the Orientation Holes Positioning identification results and Via holes ROI detection pattern are displayed in TABLE 1. And pattern recognition results by LMS, K-means and LMS algorithm with the same computer (with CPU of 2GHz) are also shown in TABLE 2. TABLE 1 Results of pattern recognition by LS-PSD algorithm.
It can be seen the proposed LS-PSD algorithm obtained the highest P, R and F values, and the best performance of results can be achieved compared with the other two algorithms (SVM AND K-MEANS). As can be seen from TABLE 1 and TABLE 2, compared with the K-mans, LMS and SVM, LS-PSD algorithm can improve the accuracy (from 75.3%,85.2%,92.5% to 96.9%). As for the ROI detection on the orientation holes positioning of printed board. Moreover, in the context of PCB images with background noise and uneven illumination, the proposed method can achieve good results.
Figure 6. ROI detection based on different step of proposed algorithm
(a) and (b) original image; (c) and (d) CDM model; (e) and (f) PSD model (g,h,i) LS-PSD model
Figure 7. Comparisons of precision of K-MEANS, LS-PSD and SVM
Table 1. Results of pattern recognition by LS-PSD algorithm
|
POLES types |
Results of pattern recognition |
correct rate |
||
|
L |
M |
S |
||
|
Large holes |
50 |
2 |
2 |
92.6% |
|
Middle ogles |
2 |
49 |
3 |
90.7% |
|
Small holes |
3 |
2 |
49 |
90.7% |
|
Average |
96.9% |
|||
Table 2. Results of ROI detection by k-means, LMS and SVM algorithm
|
POLES-types |
Results of pattern recognition |
correct rate |
Results of pattern recognition |
correct rate |
Results of pattern recognition |
correct rate |
||||||
|
K-MEANS |
LMS |
SVM-RBF |
||||||||||
|
L |
M |
S |
|
L |
M |
S |
|
L |
M |
S |
|
|
|
Large holes |
40 |
7 |
7 |
74.1% |
45 |
5 |
4 |
83.3% |
48 |
3 |
3 |
88.9% |
|
Middle holes |
10 |
37 |
7 |
68.5% |
3 |
45 |
6 |
83.3% |
3 |
48 |
3 |
88.9% |
|
Small holes |
2 |
7 |
45 |
83.3% |
3 |
3 |
48 |
88.9% |
2 |
2 |
50 |
88.9% |
|
Average |
75.3% |
|
|
|
85.2% |
|
|
|
92.5% |
|||
In this paper, the hybrid strategy is also proposed with three filtering (CDDI, OTSU and PSD), and the proposed method with two bottom-up and top-down strategies. Different types of ROI are considered by CDDI and centred distribution map (CDM), which do good to the location of the centred point of PCB. At last the LS -PSD method can scan across the image at multiple and locations, and the maximum radius of the Via circle on PCB.And the simulation results also demonstrate the effectiveness of the improved method. On the other hand, the LS-PSD method can meet the requirements of comprehensive punching recognition of the circuit board.
This paper is supported by Natural Science Foundation of Fujian Province under grant (grant number 2016H6019, 2016J01267), in part by Scientific and Technological Projects of Fuzhou City (grant number 2016-G-53), in part by Teachers education scientific research project of Fujian province (grant number JAT 170458), in part by the Scientific Research Items of MJU [grant number MJY18003]
Carson C., Belongie S., Greenspan H., Malik J. (2002). Blobworld:Image segmentation using expectation-maximization and its applicationto image querying. IEEE Trans. Pattern Anal. Mach. Intell, Vol. 24, No. 8, pp. 1026–1038. http://doi.org/ 10.1109/TPAMI.2002.1023800
Cheng M. M., Zhang G. X., Mitra N. J., Huang X., and Hu S. M. (2011). Global contrast based salient region detection. in Proc. CVPR, Jun. pp. 409–416. http://doi.org/ 10.1109/CVPR.2011.5995344
Cui R., Li Y., Yan W. (2017). Mutual Information-Based Multi-AUV Path Planning for Scalar Field Sampling Using Multidimensional RRT*. IEEE Transactions on Systems Man & Cybernetics Systems, Vol. 46, No. 7, pp. 993-1004. http://doi.org/10.1109/TSMC.2015.2500027
Harel J., Koch C., Perona P. (2007). Graph-based visual saliency. in Proc. 19th Int. Conf. Adv. Neural Inf. Process. Syst, pp. 545–552.
Hou X., Zhang L. (2007). Saliency detection: A spectral residual approach. in Proc. CVPR, Jun. pp. 1–8. http://doi.org/10.1109/CVPR.2007.383267
Itti L., Koch C. Niebur E. (1998). A model of saliency-based visual attention for rapid scene analysis. IEEE Trans. Pattern Anal. Mach. Intell, Vol. 20, No. 11, pp. 1254–1259. http://doi.org/10.1109/34.730558
Joshi T. H., Cooper R. J., Curtis J. (2016). A Comparison of the Detection Sensitivity of the Poisson Clutter Split and Region of Interest Algorithms on the RadMAP Mobile System. IEEE Transactions on Nuclear Science, Vol. 63, No. 2, pp. 1218-1226. http://doi.org/ 10.1109/TNS.2016.2537206
Kuang H., Chen L., Gu F. (2016). Combining Region-of-Interest Extraction and Image Enhancement for Nighttime Vehicle Detection. IEEE Intelligent Systems, Vol. 31, No. 3, pp. 57-65. http://doi.org/10.1109/MIS.2016.17
Li W., Dong P., Xiao B., Zhou L. (2016). Object recognition based on theRegion of Interest and optimal Bag of Words model. Neurocomputing, Vol. 172, pp. 271–280. http://doi.org/ 10.1016/j.neucom.2015.01.083
Li Z. C., Itti L. (2011). Saliency and gist features for target detection in satellite images. IEEE Trans. Image Process, Vol. 20, No. 7, pp. 2017–2029, http://doi.org/10.1109/TIP.2010.2099128
Liu C., Chang F., Chen Z. (2015). Fast Traffic Sign Recognition via High-Contrast Region Extraction and Extended Sparse Representation. IEEE Transactions on Intelligent Transportation Systems, Vol. 17, No. 1, pp. 79-92. http://doi.org/ 10.1109/TITS.2015.2459594
Loog M., Lauze F. (2010). The improbability of Harris interest points. IEEE Trans. Pattern Anal. Mach. Intell, Vol. 32, No. 6, pp. 1141–1147. http://doi.org/10.1109/TPAMI.2010.53
Qian X., Wang H., Zhao Y. (2017). Image Location Inference by Multisaliency Enhancement. IEEE Transactions on Multimedia, Vol. 19, No. 4, pp. 813-821. http://doi.org/10.1109/tmm.2016.2638207
Roth H. R., Lu L., Liu J. (2016). Improving Computer-Aided Detection Using Convolutional Neural Networks and Random View Aggregation. IEEE Transactions on Medical Imaging, Vol. 35, No. 5, pp. 1170-1181. http://doi.org/10.1109/TMI.2015.2482920
Sanchez V., Hernandez-Cabronero M. (2018). Graph-based Rate Control in Pathology Imaging with Lossless Region of Interest Coding. IEEE Transactions on Medical Imaging, No. 99, pp. 1-1. http://doi.org/ 10.1109/TMI.2018.2824819
Santosh K. C., Wendling L., Antani S. (2016). Overlaid Arrow Detection for Labeling Regions of Interest in Biomedical Images. IEEE Intelligent Systems, Vol. 31, No. 3, pp. 66-75. http://doi.org/10.1109/MIS.2016.24
Sebe N. (2001). Salient points for content-based retrieval. in Proc.BMVC, pp. 401-410.
Shen H., Pan W. D., Wu D. (2016). Predictive Lossless Compression of Regions of Interest in Hyperspectral Images With No-Data Regions. IEEE Transactions on Geoscience & Remote Sensing, Vol. 55, No. 1, pp. 173-182. http://doi.org/10.1109/TGRS.2016.2603527
Shi Z., Hospedales T. M., Xiang T. (2015). Bayesian joint modelling for object localisation in weakly labelled images. IEEE Trans. Pattern Anal. Mach. Intell, Vol. 37, No. 10, pp. 1959–1972,Oct. 2015. http://doi.org/ 10.1109/tpami.2015.2392769
Tao C., Tan Y., Zou Z. R., Tian J. (2013). Unsupervised detection of builtup areas from multiple high-resolution remote sensing images. IEEE Geosci. Remote Sens. Lett, Vol. 10, No. 6, pp. 1300-1304. http://doi.org/10.1109/LGRS.2013.2237751
Ur-Rehman O., Zivic N. (2017). Two-phase Method for Image Authentication and Enhanced Decoding. IEEE Access, 2017, No. 99, pp. 1-1. http://doi.org/10.1109/ACCESS.2017.2719632
Zandi M., Mahmoudi-Aznaveh A., Talebpour A. (2016). Iterative Copy-Move Forgery Detection Based on a New Interest Point Detector. IEEE Transactions on Information Forensics & Security, Vol. 11, No. 11, pp. 2499-2512. http://doi.org/ 10.1109/TIFS.2016.2585118
Zhang J., Li X., Foldes S. T. (2015). Decoding Brain States Based on Magnetoencephalography From Prespecified Cortical Regions. IEEE Transactions on Biomedical Engineering, Vol. 63, No. 1, pp. 30-42. http://doi.org/10.1109/TBME.2015.2439216
Zhang L., Chen J., Qiu B. (2016). Region of interest extraction in remote sensing images by saliency analysis with the normal directional lifting wavelet transform. Neurocomputing, Vol. 179, pp. 186–201. http://doi.org/10.1016/j.neucom.2015.11.093
Zhang L., Yang K., Li H. (2014). Regions of interest detection in panchromatic remote sensing images based on multiscale feature fusion. IEEE J. Sel. Topics Appl. Earth Observ, Vol. 7, No. 12, pp. 4704–4716. http://doi.org/10.1109/JSTARS.2014.2319736
Zhang Z., Jing T., Han J. (2017). A New Rate Control Scheme For Video Coding Based On Region Of Interest. IEEE Access, No. 99, pp. 1-1. http://doi.org/ 10.1109/TMI.2018.2824819