Sugondo Hadiyoso* | Achmad Rizal
© 2021 IIETA. This article is published by IIETA and is licensed under the CC BY 4.0 license (http://creativecommons.org/licenses/by/4.0/).
OPEN ACCESS
Lung sound is one of the parameters of respiratory health. This sound has a specific character if there is a disease in the lungs. In some cases, it is difficult to distinguish one type of lung sound to another. It takes the expertise, experience and sensitivity of clinicians to avoid misdiagnosis. Therefore, many studies have proposed a feature extraction method combined with automatic classification method for the detection of lung disease through lung sound analysis. Since the complex nature of biological signals which are produced by complex processes, the multiscale method is an interesting feature extraction method to be developed. This study proposes an empirical mode decomposition (EMD) and a modified gray level difference (GLD) for a lung sound classification. The EMD was used to decompose the signal, and then GLD was measured on each decomposed signal as a feature set. There are five classes of lung sounds which were simulated in this study, including normal, wheeze, crackle, pleural rub, and stridor. Performance evaluation was carried out using a multilayer perceptron (MLP) and 3-fold cross-validation. This proposed method yielded the highest accuracy of 96.97%. This study outperformed several previous studies which were simulated on the same dataset. It is hoped that in the future, the proposed methods can be tested on larger datasets to determine the robustness of the methods.
lung sound, EMD, GLD, MLP
Lung sounds can provide information on lung health [1]. Lung sounds can be heard using a stethoscope, which is called the auscultation method [2]. If there are physiological changes in the lungs due to a disease, it can cause changes in the lung sound pattern [3]. This becomes one of the reference criteria for doctors to diagnose the patients' lung disease. However, this technique tends to be very subjective because it depends on the experience and expertise of the doctor [1]. Digital signal processing methods become an alternative to deal with that problem.
Many studies have proposed algorithms for automatic classification of lung sounds based on digital signal processing. Various feature extraction methods combined with classifier algorithms have been reported. Some of them use time-domain analysis, frequency domain analysis, time-frequency domain analysis, and signal complexity analysis. Analyzes in the time domain, for example using the Hjorth descriptor method are reported in [4-6] or empirical mode decomposition method, as reported in the study by Chen et al. [7]. Other studies that use analysis in the frequency domain such as Fast Fourier Transform (FFT) [8, 9], or using the Mel Frequency Cepstral Coefficients (MFCC) method are reported in the studies [10, 11] Lung sound classification using analysis in the time-frequency domain, as reported in the studies [12, 13]. However, time domain analysis is preferred in the case of short data segments and it is capable of measuring the power over the broad band into a single index [14]. Time domain technique is thought to be more suitable in the case of abnormal lung sounds, because it has a short period [15, 16].
Since naturally the lung sound signals have non-stationary properties, a complexity analysis in the time domain is used to characterize this signal by some researchers. The most common complexity approach is the entropy measurement. Previous studies by Rizal et al. proposed seven combinations of entropy measurements for a lung sound classification [17]. This study generated an accuracy of 94.95% for the classification of five classes of lung sounds. Another entropy-based research on the classification of wheeze and non-wheeze within lung sound signals was proposed by Aydore et al. [18]. The Renyi entropy method was used for feature extraction, and the accuracy achieved was 93.5% for the two data classes. Another study used a complexity parameter based on the Hjorth method for the feature extraction process. Hjorth parameters were measured on a single scale and multiscale scheme. The proposed methods generated an accuracy of 83.95% and 95.06%, respectively [4, 5]. From the literature review on previous studies where the complexity approach has been performed, there is still a gap to improve the accuracy.
Therefore, in this study, we proposed new protocol based on the empirical mode decomposition and a modified grey level difference (GLD) for lung sound classification. In this method, GLD parameters were measured at each level of decomposition. The calculated GLD parameters included second-moment gradient (GSM), contrast gradient (GC), mean gradient (GM), inverse difference moment (IDM), and gradient entropy (GE). These features then become the input of a multilayer perceptron for lung sounds classification. It is expected that this GLD can produce higher accuracy compared to entropy and Hjorth methods.
As a reminder, this paper is organized as follows: section 2 contains a detailed explanation of the materials and methods used in this study. In section 3, it contains an explanation of the simulation results followed by a discussion. Meanwhile, conclusions and future work are presented in section 4.
The lung sound classification protocol in this study is shown in Figure 1. The first process is pre-processing, which includes amplitude normalization and the mean normalization. The next step is signal decomposition using EMD. Next, GLD calculations are performed on each EMD result as a signal feature. The final process is evaluating performance using the classifier algorithm. A detailed description of the proposed system is explained in the following section.
Figure 1. Proposed method
2.1 Lung sound data
The lung sound data which is used in this study was collected from open sources on the internet [19-21] and CD textbooks [22]. This data was then converted to a wav file and cut into one breathing cycle. All data were then sampled in 8000 Hz dan 16-bit depth. Lung sound data consisted of five classes, namely normal, wheeze, crackle, pleural rub, and stridor. The number of data for each class is shown in Table 1. These five lung sound classes represent different lung sound characteristics. Normal represents the condition of a normal lung. Wheezing sounds produced by patients who have asthma, this has a continuous and musical nature. The crackle is associated with the condition of the lungs that have bronchitis. Stridor sounds usually occur in upper respiratory obstruction and produce loud frequencies. Meanwhile, pleural rub occurs due to friction in pleural inflammation.
Table 1. The description of lung sound data
|
Data class |
Number of data |
|
Normal |
18 |
|
Wheeze |
13 |
|
Crackle |
15 |
|
Pleural Rub |
15 |
|
Stridor |
20 |
2.2 Gray level difference matrix
Gray-Level Difference Matrix (GLDM) is a method for measuring texture, which was first proposed by Weszka et al. [23]. Weszka et al. use GLDM to distinguish aerial photographs from an area such as urban, rural, forest, railroad, lake, and wetlands [23]. This technique measures the absolute value of the difference between two pixels at a distance d. The equation for calculating GLDM in the horizontal direction is as follows.
$y(i, j)=|x(i, j)-x(i, j+D)|$
$D=$ pixel distance (1)
GLD measures the texture of an image by calculating the difference in pixels in the vertical and diagonal directions. The absolute pixel value can be calculated as:
$H(g \mid \theta)$ (2)
where, $\theta$ is the direction of adjacent pixels with the distance d. The principal value of $\theta$ can be: 0°, 45°, 90°, and 135°. Then the probability of each pixel can be formulated as:
$h(g \mid \theta)=\frac{H(g \mid \theta)}{\sum_{q} H(g \mid \theta)^{*}}$ (3)
Since the lung sounds are one-dimensional signals, GLDM can only be measured in the 0o direction. In this study, we calculated GLDM as features including, the gradient second moment (GSM), gradient contrast (GC), mean gradient (GM), inverse difference moment (IDM), and gradient entropy (GE) [23, 24]. All GLDM features are calculated in the following equation [25]:
$G S M=\sum_{g}[h(g \mid \theta)]^{2}$ (4)
$G C=\sum_{g} g^{2} h(g \mid \theta)$ (5)
$G M=\sum_{g} h(g \mid \theta) \cdot g$ (6)
$I D M=\sum_{g} \frac{h(g \mid \theta)}{\left(g^{2}+1\right)}$ (7)
$G E=-\sum_{g} h(g \mid \theta) \cdot \log h(g \mid \theta)$ (8)
2.3 Multilayer perceptron (MLP) and cross-validation for evaluation
Performance evaluation is intended to test the robustness of the proposed method. In this evaluation, we use a multilayer perceptron (MLP) as classifiers. MLP is preferred because it is an artificial neural network with the simplest architecture. MLP has the same number of inputs as the number of features, while the number of output layers is equal to the number of classes [26]. The number of hidden neurons varies to be observed, in which MLP configuration gives the best performance because this method is trial and error. Because MLP is a supervised classifier, cross-validation is needed to split the training data and test data. In this study, we used the 3-fold cross-validation.
In this study, GLD is calculated on IMF1-IMF10. GLD is measured with different distances (D). For D = 0 means the GLD feature was calculated on the EMD signal results without the GLD process. All features were tested using MLP and 3-FCV for performance validation [27]. Initially used 10 IMF, then we reduced the number of IMF to observe the effect of the number of IMF on accuracy.
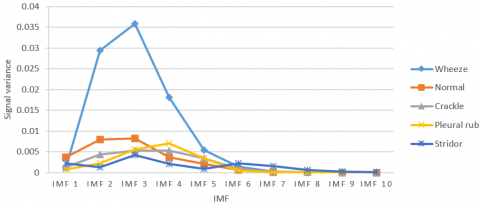
Figure 2 shows the variance in each IMF in each class of lung sound data that reflects the energy of the signal. Variations in IMF6 to IMF10 tend to be low and have a value that coincides with each other. Significant different patterns are seen in IMF1-IMF5; this causes the highest accuracy to be produced in the range of IMF1-IMF4 or IMF1-IMF5.
In this study, IMF1-IMF10 was used for the feature extraction process. For each IMF, GLD parameters were calculated using different D distances. The distance D used was divided into two types, short distances (1-5) and long distances (10, 20, 50, 100, and 200).
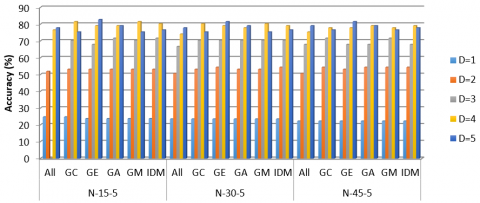
All features were tested using MLP with the number of hidden neurons 15, 30, and 45, and 3-fold cross-validation for validation [27]. The test results are shown in Figure 3.
Figure 2. Variance IMF1-IMF10 in each class of data
Figure 3. Accuracy of EMD-GLD at a small distance for various MLP configuration (max GE, D = 5, N-15-5, 82.72%)
Figure 4. Bronchial sound and IMF1-IMF4 with its GLD result for D = 1
As shown in Figure 3. It appears that for D = 1, the accuracy is very low. With D = 1, the distance between sample data is too small, so the results of the calculation of $y(n)=|x(n)-x(n+d)|$ will produce $y(n) \approx 0$ Thus, the resulting GLD parameter will also be very small. The GLD results from the original signal and IMF1-IMF4, as in Figure 4.
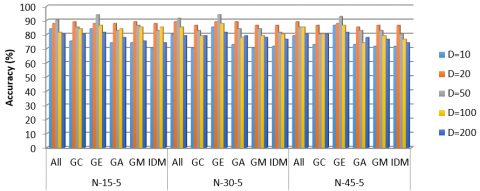
Figures 3 and 5 show that the highest accuracy is achieved by GE with D = 5. The highest accuracy achieved is 93.83% with MLP N-15-5. The number of IMF which is used is 10, so this result is achieved with the number of features = 10.
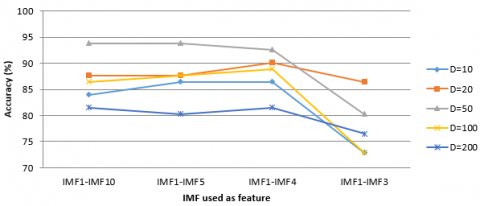
To analyze the effect of IMF numbers, which are used in GLD, accuracy testing for different IMF numbers using GE features is performed. The results obtained for MLP N-15-5 are shown in Figure 6. At D = 50, the results achieved do not change if the IMF is reduced to 5 IMF. Meanwhile, if only 4 IMF are used, the accuracy will decrease. This shows, IMF1-IMF5 sufficiently represents the characteristics of lung sounds so that the number of features used is sufficient to use GE.
Table 2 shows the results of the recognition in more detail and calculation of sensitivity (SE) and specificity (SP). Misclassification only occurs in Pleural rub data. From 15 Pleural Rub data, only ten were recognized as a pleural rub, so the SE for a pleural rub is 66.67%. This misclassification causes SP values for the other three classes, including, bronchial, crackle, and stridor to decrease. The decrease in SP due to the 5 pleural rub data was classified as either bronchial, crackle, or stridor. The best results were achieved by Asthma, with 100% SE and SP values.
Referring to Figure 2, where different patterns are occurring in IMF1-IMF5, then a feature reduction is carried out in which the IMF ranges used are IMF1-IMF4 and IMF1-IMF5 and its impact is observed on the resulting accuracy. From this test scenario, the highest accuracy for each GLD feature is shown in Table 3. The highest accuracy of 96.97% was generated by five GLD features at a distance of D = 10 with IMF1-IMF4. This means that the number of features was 20. The use of one GLD feature in this case GA, produces the highest accuracy of 95.96% using IMF1-IMF5 with D = 4. From the summary of the test results presented in Table 3, it can be seen that the highest accuracy in each condition was produced by IMF1-IMF4 or IMF1-IMF5, this condition was caused because the signal information was partly located in IMF1-IMF5.
Figure 5. Accuracy of EMD-GLD at long distance for various MLP configuration (max GE, D = 50, N-15-5, 93.83%)
Figure 6. Effect of IMF number used as the feature
Table 2. Confusion matrix and SE and SP calculations for GE, IMF1-IMF5, N-15-5
|
Data class |
Classified as |
SE (%) |
SP (%) |
||||
|
Bronchial |
Wheeze |
Crackle |
Pleural Rub |
Stridor |
|||
|
Bronchial |
18 |
0 |
0 |
0 |
0 |
100 |
98.41 |
|
Asthma |
0 |
13 |
0 |
0 |
0 |
100 |
100 |
|
Crackle |
0 |
0 |
15 |
0 |
0 |
100 |
98.48 |
|
Pleural Rub |
1 |
0 |
1 |
10 |
3 |
66.67 |
100 |
|
Stridor |
0 |
0 |
0 |
0 |
20 |
100 |
95.08 |
Table 3. The highest accuracy of each GLDM feature on the distance (D) with a range of IMF1-IMF4 and IMF1-IM5
|
Feature |
Highest accuracy (%) |
Distance (D) |
IMF |
Number of features |
|
ALL |
96.97 |
10 |
IMF1-IMF4 |
20 |
|
GC |
75.76 |
5 |
IMF1-IMF4 |
4 |
|
GA |
95.96 |
4 |
IMF1-IMF5 |
5 |
|
GE |
93.94 |
0 2 50 |
IMF1-IMF5 IMF1-IMF4 IMF1-IMF5 |
5 4 5 |
|
GM |
87.88 |
50 |
IMF1-IMF5 |
5 |
|
IDM |
92.93 |
10 |
IMF1-IMF5 |
5 |
Compared with similar studies using EMD, the proposed method is better in terms of a smaller number of features, five features for 95.96% accuracy, or 20 features with 96.97% accuracy. The process was simple because it did not have to find the IF of the signal, as in previous studies [7, 28-30]. In research [7, 28, 29], only analyzes were performed, which showed that EMD could be used to distinguish one lung sound from another. Meanwhile İçer and Ş. Gengeç simulated a classification with IFmean features that produced an accuracy of 93% with SVM as a classifier [30]. In general, the proposed method promises to be used for feature extraction in the classification of lung sounds due to simple computation, a small number of features, and higher accuracy compared to single scale accuracy.
In this study, we proposed a combination of EMD and GLDM for lung sound classification. EMD was used to decompose signals into several IMF, while GLDM was used to measure the dynamics of signal. Because GLDM was initially used in image processing, modifications were made so that it could be used for lung sound signal analysis. GLDM was chosen as a method to see the signal dynamics that occur in pulmonary sounds. The advantage of GLDM was that it was easy to see co-occurrence signal that were determined from a specified distance. Accuracy could be improved by finding the appropriate distance. Tests using various distances and the number of IMF produced the highest accuracy of 96.97% at distances D = 10 and 4 IMF. The proposed method can be tested on a larger dataset to test the consistency of its performance. The proposed method is expected to be used for feature extraction in other biomedical signals such as EEG signals, heart sounds, and others.
[1] Rizal, A., Hidayat, R., Nugroho, H.A. (2018). Comparison of multiscale entropy techniques for lung sound classification. Indonesian Journal of Electrical Engineering and Computer Science, 12(3): 984-994. https://doi.org/10.11591/ijeecs.v12.i3.pp984-994
[2] Rizal, A., Hidayat, R., Nugroho, H.A. (2017). Hjorth descriptor measurement on multidistance signal level difference for lung sound classification. Journal of Telecommunication, Electronic and Computer Engineering, 9(2): 23-27.
[3] Pasterkamp, H., Kraman, S.S., Wodicka, G.R. (1997). State of the art respiratory sounds advances beyond the stethoscope. Ameriacan Journal of Respiratory and Critical Care Medicine, 156(3): 974-987. https://doi.org/10.1164/ajrccm.156.3.9701115
[4] Rizal, A., Hidayat, R. Nugroho, H.A. (2015). Determining lung sound characterization using Hjorth descriptor. ICCEREC 2015 - International Conference on Control, Electronics, Renewable Energy and Communications, Bandung, pp. 54-57. https://doi.org/10.1109/ICCEREC.2015.7337053
[5] Rizal, A., Hidayat, R., Nugroho, H.A. (2016). Multiscale Hjorth descriptor for lung sound classification. AIP Conference Proceedings, 1755(1): 160008-1-160008-6. https://doi.org/10.1063/1.4958601
[6] Rizal, A, Hidayat, R., Nugroho, H.A. (2019). Lung sound classification using Hjorth descriptor measurement on wavelet sub-bands. Journal of Information Processing Systems, 15(5): 1068-1081. https://doi.org/10.3745/JIPS.02.0116
[7] Chen, X., Shao, J., Long, Y.J., Que, C.l., Zhang, J., Fang, J. (2014). Identification of Velcro rales based on Hilbert-Huang transform. Physica A: Statistical Mechanics and Its Applications, 401(8): 34-44. https://doi.org/10.1016/j.physa.2014.01.018
[8] Endang Dian, S., Sumber. (2017). Design build lung sound detection with fast Fourier transform (FFT) analysis in normal and smoker subjects. Journal of Information Engineering and Applications, 7(9): 28-34.
[9] Sahgal, N. (2011). Monitoring and analysis of lung sounds remotely. International Journal of COPD, 6(1): 407-412. https://doi.org/10.2147/COPD.S20067
[10] Chen, C.H., Huang, W.T., Tan, T.H., Chang, C.C., Chang, Y.J. (2015). Using K-nearest neighbor classification to diagnose abnormal lung sounds. Sensors (Switzerland), 15(6): 13132-13158. https://doi.org/10.3390/s150613132
[11] Sengupta, N., Sahidullah, M., Saha, G. (2016). Lung sound classification using cepstral-based statistical features. Computers in Biology and Medicine, 75: 118-129. https://doi.org/10.1016/j.compbiomed.2016.05.013
[12] Homs-Corbera, A., Fiz, J.A., Morera, J., Jané, R. (2004). Time-frequency detection and analysis of wheezes during forced exhalation. IEEE Transactions on Biomedical Engineering, 51(1): 182-186. https://doi.org/10.1109/TBME.2003.820359
[13] Serbes, G., Sakar, C.O., Kahya, Y.P., Aydin, N. (2013). Pulmonary crackle detection using time-frequency and time-scale analysis. Digital Signal Processing: A Review Journal, 23(3): 1012-1021. https://doi.org/10.1016/j.dsp.2012.12.009
[14] Myers, L.J., Erim, Z., Lowery, M.M. (2004). Time and frequency domain methods for quantifying common modulation of motor unit firing patterns. Journal of NeuroEngineering and Rehabilitation, 1(2): 1-12. https://doi.org/10.1186/1743-0003-1-2
[15] Andrès, E., Gass, R., Brandt, C., Hentzler, A., Author, C. (2018). Respiratory sounds analysis in the world of health 2.0 and medicine 2.0. EC Pulmonology and Respiratory Medicine, 7(8): 564-585.
[16] Pramono, R.X.A., Bowyer, S., Rodriguez-Villegas, E. (2017). Automatic adventitious respiratory sound analysis: A systematic review. PLoS ONE, 12(5): 1-43. https://doi.org/10.1371/journal.pone.0177926
[17] Rizal, A., Hidayat, R., Nugroho, H.A. (2017). Entropy measurement as features extraction in automatic lung sound classification. 2017 International Conference on Control, Electronics, Renewable Energy, and Communications, Yogyakarta, pp. 93-97. https://doi.org/10.1109/ICCEREC.2017.8226668
[18] Aydore, S., Sen, I., Kahya, Y.P., Mihcak, M.K. (2009). Classification of respiratory signals by linear analysis. Proceedings of the 31st Annual International Conference of the IEEE Engineering in Medicine and Biology Society, Minneapolis, MN, pp. 2617-2620. https://doi.org/10.1109/IEMBS.2009.5335395
[19] R.A.L.E The R.A.L.E Lung Sound. (2015). [Online]. Available: http://rale.ca, accessed on 1 May 2015.
[20] Arnall, D. (2015). Breath Sounds. [Online]. Available: http://jan.ucc.nau.edu/~daa/heartlung/breathsounds/contents.html, accessed on 1 May 2015.
[21] The Auscultation Assistant - Breath Sounds. (2015). Retrieved from http://www.med.ucla.edu/wilkes/lungintro.htm, accessed on 12 Jaunary 2020.
[22] Wilkins, R.L., Hodgkin, J.E., Lopez, B. (1996). Lung Sounds: A Practical Guide with Audio CD. 2nd ed. Mosby.
[23] Weszka, J.S., Dyer, C.R., Rosenfeld, A. (1976). A Comparative study of texture measures for terrain classification. Syst. Man Cybern. IEEE Transactions on System, Man, and Cybernetics, 6(4): 269-285. https://doi.org/10.1109/TSMC.1976.5408777
[24] Conners, R.W., Harlow, C.A. (1980). A theoretical comparison of texture algorithms. IEEE Transcations on Pattern Analysis and Machine Intelligence, 2(3): 204-222. https://doi.org/10.1109/TPAMI.1980.4767008
[25] Goshtasby, A. (2012). Image Registration, Priciples, Tools and Methods, First. Springer-Verlag London Limited.
[26] Albu, F., Mateescu, A., Dumitriu, N. (1997). Architecture selection for a multilayer feedforward network. In International Conference on Microelectronics and Computer Science, pp. 131-134.
[27] Hashemi, A., Arabalibiek, H., Agin, K. (2011). Classification of wheeze sounds using wavelets and neural networks. In International Conference on Biomedical Engineering and Technology (2011), pp. 127-131.
[28] Charleston-Villalobos, S., González-Camarena, R., Chi-Lem, G., Aljama-Corrales, T. (2007). Crackle sounds analysis by empirical mode decomposition. IEEE Engineering in Medicine and Biology Magazine, 26(1): 40-47. https://doi.org/10.1109/memb.2007.289120
[29] Lozano, M., Fiz, J.A., Jané, R. (2013). Estimation of instantaneous frequency from empirical mode decomposition on respiratory sounds analysis. 2013 35th Annual International Conference of the IEEE Engineering in Medicine and Biology Society (EMBC), Osaka, pp. 981-984. https://doi.org/10.1109/EMBC.2013.6609667
[30] İçer, S., Gengeç, Ş. (2014). Classification and analysis of non-stationary characteristics of crackle and rhonchus lung adventitious sounds. Digital Signal Processing, 28: 18-27. https://doi.org/10.1016/j.dsp.2014.02.001