Sugondo Hadiyoso* | Inung Wijayanto | Annisa Humairani
© 2021 IIETA. This article is published by IIETA and is licensed under the CC BY 4.0 license (http://creativecommons.org/licenses/by/4.0/).
OPEN ACCESS
Epilepsy is the most common form of neurological disease. Patients with epilepsy may experience seizures of a certain duration with or without provocation. Epilepsy analysis can be done with an electroencephalogram (EEG) examination. Observation of qualitative EEG signals generates high cost and often confuses due to the nature of the non-linear EEG signal and noise. In this study, we proposed an EEG signal processing system for EEG seizure detection. The signal dynamics approach to normal and seizure signals' characterization became the main focus of this study. Spectral Entropy (SpecEn) and fractal analysis are used to estimate the EEG signal dynamics and used as feature sets. The proposed method is validated using a public EEG dataset, which included preictal, ictal, and interictal stages using the Naïve Bayes classifier. The test results showed that the proposed method is able to generate an ictal detection accuracy of up to 100%. It is hoped that the proposed method can be considered in the detection of seizure signals on the long-term EEG recording. Thus it can simplify the diagnosis of epilepsy.
epilepsy, EEG, dynamics, entropy, fractal, Naïve Bayes
Epilepsy is considered one of the most common neurological conditions, and it has affected around 50 million people in the world [1]. The most susceptible patients are older people and children with a prevalence rate of 0.7-1.0% and some patients with comorbidities [2]. People with epilepsy sometimes go through discrimination, misunderstanding, and depression. Meanwhile, this disease is endangering if a risky activity performed by a person living with epilepsy, epilepsy would lead to death [3, 4]. Diagnosis of epilepsy is individualized, and so are the treatment decisions. Neurologists will diagnose that someone has epilepsy when they experience an epileptic seizure and tend to have recurrent seizures in the next 24 hours. In particular, an individual with a probability of having another seizure after having two unprovoked seizures for the next ten years can also be diagnosed as epilepsy [5].
Seizure preventions can be done to avoid brain damage in seizing an early-stage seizure detection. This action is performed by analyzing the brain signal activity. When a seizure occurs, the brain signal activity is different from the normal signal activities in terms of patterns, amplitudes, and frequency [6]. Electroencephalogram (EEG) is one of the most effective techniques to record brain signals of all methods. In the past, seizures were examined and diagnosed by neurologists analyzing the recordings manually, which were tiring, expensive, and time-consuming [7]. The most time-consuming and tiring part is the measurement of the considerable length of EEG signal recordings. Aside from it, neurologists must have high skill and talent in visual diagnosing and interpreting, which is very hard to find [8]. Therefore, the research groups are developing a potential Computer-Aided Diagnosis (CAD) system to detect seizures automatically and facilitate long-term EEG monitoring by extracting and classifying the signals' features at the end [6, 7, 9].
A plethora of signal processing studies have reported epileptic seizure detection based on the number of the dynamic EEG signals' irregularity and nonlinearity properties. One of the foremost algorithms used in extracting features is chaotic measurements, such as entropies and fractal dimensions. Entropy calculations have been used since they are better in understanding the complex EEG signals where discriminative shape forms of the signals exist [10]. Moreover, entropy can identify the dynamics of the EEG signals well [11]. Permutation entropy (PE) has been widely used to detect the dynamic changes of the complex system, even in the primary dataset of three to eight patients in several universities, such as the University of Florida Health, with more than 25 channels used [12, 13]. In the paper [14], Wavelet entropy (WEn) showed a better result in detecting the nonstationary signal than spectral analysis. Meanwhile, a review study done by Acharya et al. tackled the statement since spectral entropy (SpecEn) performed better than the other entropies [11]. In another study, Wijayanto et al. adequated Katz's fractal dimensions to detect seizure since they were very beneficial in handling the irregularity property of EEG signals [4].
This research presents a dynamics approach of EEG signals to detect seizures with no decomposition process involved but can provide competitive accuracy. EEG signals are filtered in a suitable frequency range to remove noises and other artifacts. Then, three feature extraction algorithms are calculated, namely SpecEn, Katz fractal, and Sevcik fractal. These features are put together into feature sets. The robustness of the proposed methods is examined using Naïve Bayes on the dataset consisted of three classes: preictal, interictal, and ictal.
This paper is orderly written as follows. Section 2 explains the EEG dataset used along with the proposed methods applied in this study, SpecEn, Katz fractal, Sevcik fractal, and Naïve Bayes. Section 3 presents and discusses the results achieved in this paper. Lastly, a brief conclusion is declared in Section 4.
2.1 Epileptic EEG dataset
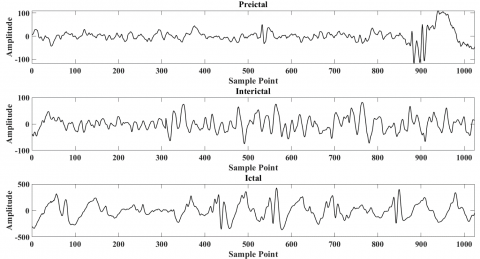
This study worked on an open EEG dataset collected in the Neurology and Sleep Centre, Hauz Khaz, New Delhi, India. Since it is an open dataset, it can be legally downloaded through Researchgate [15]. The dataset consists of various recordings from ten patients. The signals were recorded using 200 Hz sampling frequency in 16 scalp EEG electrodes and complying with the international 10-20 electrode placement rule. A filtering process was performed by applying a band-pass filter (0.5 and 70 Hz). This dataset defined three classes, i.e., preictal (X), interictal (Y), and ictal (Z), with 50 recordings each and 5.12 of length. Figure 1 shows the sample of the recorded signal for three classes. This study arranged several scenarios to validate the proposed method's performance in classifying preictal, interictal, and ictal, which is described in section 3.
2.2 Spectral entropy
Spectral entropy (SpecEn) is a measure of the irregularity of a dynamic or irregular signal. SpecEn calculates the change of entropy in the spectral power amplitude component of the EEG signal at each frequency. This method starts with segmenting the signal in a certain length and then continues to the spectral power estimation using Welch's periodogram. The measure of the estimated power spectral irregularity is calculated using entropy. SpecEn is then calculated for each epoch of 1024 data points (5.12 seconds) with a window length of approximately 0.17 seconds. These values are then averaged to obtain the mean SpecEn as the feature set.
2.3 Katz and Sevcik Fractal Dimension
According to Katz's method, the Katz Fractal Dimension (KFD) directly calculates the time-series signals [16]. The sum and average of the Euclidean distances in between successive points of the sample are measured along with the average length of the first and the other point of the sample simultaneously [17]. The KFD of the sample is written in Eq. (1) as D:
$D=\frac{\log (L/a)}{\log (d/a)}=\frac{\log (n)}{\log (n)+\log (d/L)}$ (1)
where, L is the time-series data length, a is the average distance, d is the other point of the sample, and n is L per a that states the total steps exist in KFD waveform [18].
Instead of calculating directly, Sevcik Fractal Dimension (SFD) approximates the fractal dimension from the Hausdorff dimension for the sampled time-series data [19, 20]. The measurement of SFD is defined in Eq. (2) as SevFD.
$SevFD=1+\frac{\ln (L)}{\ln [2(N-1)]}$ (2)
where, L is the curve length in the unit square, and N is the total of segments [18].
2.4 Performance validation using Naïve Bayes
Naïve Bayes (NB) is one of the simplest probabilistic classifiers adopting the Bayesian theory of assuming that the features are independent [21]. Here, the assumptions are called event models of NB. Since the assumptions are common and very simple, NB has smoothly solved many complex classification problems such as text and seizure classification [22, 23]. Moreover, the required training data is less than the other classifiers. NB uses the maximum likelihood to estimate the occurrence absence of the model [21].
Figure 1. EEG signals sample of preictal, ictal, and interictal
There are two most popular NB classifiers with different event models. First, the Bernoulli event model which was mainly used in classifying discrete signal. Second, the Gaussian event model is popularly used to classify continuous signals. This study utilized the Gaussian event model since the recorded EEG signals are continuous signals [24]. The process starts with the calculation of the prior probability of each class. Then, the features' contribution is combined with the prior probability to get the maximum likelihood that can be calculated using Eq. (3).
$\begin{align} & p\left( \overrightarrow{x}|c \right)=\prod\limits_{k=1}^{k}{N\left( {{x}_{k}}|{{\mu }_{c,k}},\sigma _{c,k}^{2} \right)} \\ & \text{ =}\prod\limits_{k=1}^{k}{\frac{1}{\sqrt{2\pi \sigma _{c,k}^{2}}}}\exp \left( -\frac{{{\left( {{x}_{k}}-{{\mu }_{c,k}} \right)}^{2}}}{2\sigma _{c,k}^{2}} \right) \\\end{align}$ (3)
Here $N\left( \overrightarrow{{{\mu }_{c}}},\sigma _{c}^{2} \right)$ is a separate Gaussian with the mean and variance vectors of the features, respectively. The $\vec{x}$ is the input EEG signals, c is class, and k is the prior probability.
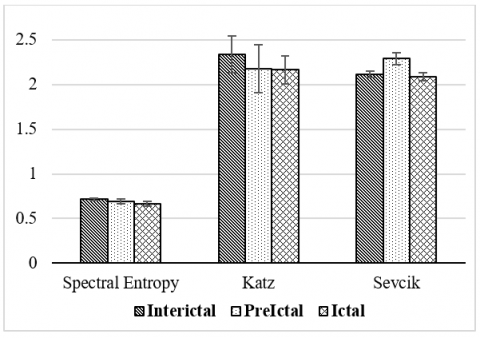
Before measuring SpecEn and fractal dimensions, the signal was filtered in the 2-30 Hz range using Butterworth FIR for baseline and muscle noise reduction. This frequency range also represents delta, theta, alpha, and beta EEG activity. After performing the filtration, the mean SpecEn, Katz fractal, and Sevcik fractal were measured. Figure 2 shows the mean of the SpecEn, Katz fractal, and Sevcik fractal.
Figure 2. The mean and deviation of SpecEn, Katz, and Sevcik of the interictal, preictal, and ictal stage
The proposed feature extraction method represents a quantitative measure of the irregularity in a dynamic signal. A larger value indicates a more complex signal. Figure 2 shows that the irregularity in the ictal stage is lower than the interictal and preictal. We found that the ictal state has the lowest irregularity measure than interictal and preictal, which is consistent for all methods. This means that there is a decrease in signal complexity. The decrease in the dynamic level of the EEG signal is indeed related to the presence of pathology. A normal EEG signal is more complex than an abnormal EEG signal [25, 26]. The proposed feature extraction method is able to characterize and differentiate interictal, preictal, and ictal signals quantitatively.
The validation of the proposed method is done by applying several scenarios, such as shown in Table 1. This validation involves Naïve Bayes with a 5-fold cross-validation method to split training data and test data. The feature extraction stage generates three values that are used as the feature vectors for all classification scenarios. No feature selection process is applied in this study.
Table 1. Test scenario
|
Scenario |
Classification Problem |
|
A |
Interictal vs. ictal |
|
B |
Preictal vs. ictal |
|
C |
Interictal vs. preictal |
|
D |
Non-ictal (pre and inter) vs. ictal |
|
E |
Interictal vs. ictal vs. preictal |
Table 2 shows the classification accuracy generated by Naïve Bayes as well as the confusion matrix for each scenario. It is shown that the system can produce 100% of detection accuracy on interictal vs. ictal classification problems. Slightly lower, the preictal vs. ictal classification problems achieved an accuracy of 96%. Since pre-ictal and inter-ictal are similar conditions that occur before ictal, we merge both conditions into the non-ictal class. This scenario achieves an accuracy of 97.3%. Meanwhile, the lowest accuracy was found in the interictal and preictal classification problems. The validation test results of the proposed feature extraction method show that this system is capable of producing high accuracy (> 95%) in ictal vs. non-ictal classification problems.
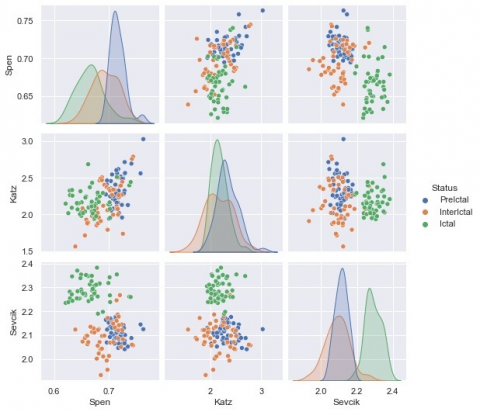
Validation was carried out by comparing the proposed method's performance with previous studies that used the same dataset resource. A summary comparison with previous studies is presented in Table 2 and Table 3. In the ictal vs. interictal scenarios, the detection accuracy reached 100%, which outperformed studies by Gupta et al. [27], Li et al. [28] and Hadiyoso et al. [29]. Figure 3 shows the distribution of features on ictal vs. interictal having a significant boundary line, which generates perfect accuracy. Moreover, the EEG dataset used has low noise and short duration, leading to a relatively simple computation.
Table 2. Confusion matrices of five scenarios used in this study
|
(a) |
||
|
A |
Inter-ictal |
Ictal |
|
Inter-ictal |
50 |
0 |
|
Ictal |
0 |
50 |
|
(b) |
||
|
B |
Pre-ictal |
Ictal |
|
Pre-ictal |
48 |
2 |
|
Ictal |
2 |
48 |
|
(c) |
||
|
C |
Inter-ictal |
Pre-ictal |
|
Inter-ictal |
46 |
4 |
|
Pre-ictal |
17 |
33 |
|
(d) |
||
|
D |
Non-ictal |
Ictal |
|
Non-ictal |
98 |
2 |
|
Ictal |
2 |
48 |
|
|
(e) |
|
|
|
E |
Inter-ictal |
Ictal |
Pre-ictal |
|
Inter-ictal |
46 |
0 |
4 |
|
Ictal |
0 |
48 |
2 |
|
Pre-ictal |
14 |
2 |
34 |
Table 3. System performances of the proposed method
|
Scenario |
Sens. (%) |
Spe. (%) |
Acc. (%) |
|
A |
100% |
100% |
100% |
|
B |
96% |
96% |
96% |
|
C |
73% |
89.2% |
79% |
|
D |
98% |
96% |
97.3% |
|
E |
85.3% |
92.7% |
85.3% |
We also highlighted the ictal vs. preictal scenario, the method's proposed performance outperforming the study by Gupta et al. [27], Hadiyoso et al. [29] and Sharma et al. [30] with an accuracy of 79.7, 95%, and 90%, respectively. Meanwhile, the interictal vs. preictal scenario also outperformed the study by Gupta et al. and Wijayanto et al. [27, 31]. However, it is not higher than the accuracy produced by the study of Li et al. [28]. Actually, ictal vs. preictal and interictal vs. preictal scenarios were not superior to studies by Li et al. [28], yet at least the resulting accuracy is similar.
Overall, these results are very encouraging because this system has the opportunity to be developed in the application of seizure prediction. Meanwhile, the interictal and preictal classification problems still produce quite a low accuracy. This refers to their nature which has similar characteristics in that these signals occur before the seizure. As shown in Figure 3, the interictal and preictal feature values are almost similar. However, in its application, prediction or ictal detection is preferred for analysis. Finally, the proposed system is expected to assist clinicians in detecting seizures based on EEG signals automatically.
Figure 3. Distribution of Ictal, preictal, and interictal features based on SpecEn, Katz, and Sevcik
Table 3. Summary of comparisons with previous studies
|
Study |
Method |
Scenario |
Acc. (%) |
|
Gupta et al. [27] |
DCT, Hurst Exponent and ARMA |
Interictal vs. ictal Preictal vs. ictal Interictal vs. preictal |
96.5 79.7 74.6 |
|
Li et al. [28] |
MRBF-MPSO-OLS, GLCM |
Interictal vs. ictal Preictal vs. ictal Interictal vs. preictal |
99.3 97.4 85.7 |
|
Hadiyoso et al. [29] |
Wavelet Sub-Band Energy and Wavelet Entropy |
Interictal vs. ictal Preictal vs. ictal Interictal vs. preictal |
96 95 80 |
|
Sharma et al. [30] |
MMSF - OWFB |
Interictal vs. ictal Preictal vs. ictal Interictal vs. preictal |
100 90 N/A |
|
Wijayanto et al. [31] |
Wavelet energy |
Interictal vs. ictal Preictal vs. ictal Interictal vs. preictal |
100 97 73 |
|
Proposed study |
SpecEn, Katz, and Sevcik FD |
Interictal vs. ictal Preictal vs. ictal Interictal vs. preictal |
100 96 78 |
This study observed the dynamic approach of the EEG signal to detect epileptic seizure conditions. The main focus was to determine the seizure condition instead of the normal condition. The dynamic approach analysis was performed by calculating the spectral entropy (SpecEn) and the EEG signal's fractal dimension using Katz's and Sevcik's methods. The feature set was then fed into Naive Bayes with 5-fold cross-validation. There were five scenarios covering the combination of preictal, interictal, and ictal conditions. A perfect classification result was achieved in the interictal vs. ictal condition. On the other hand, the lowest accuracy of 78% was achieved in the interictal vs. preictal condition. The low accuracy happened because the nature of the interictal and preictal conditions was similar. Both of them occurred right before the seizure condition arise. For future works, further observation in the EEG signal's time-frequency domain may give advantages to see the EEG signal characteristic from two different points of view.
All authors would like to thank Telkom University for funding this research. The authors are also grateful to the Laboratory of School of Applied Science Telkom University for providing research facilities.
[1] World Health Organization. (2019). Epilepsy. [Online]. Available: https://www.who.int/en/news-room/fact-sheets/detail/epilepsy, accessed on 28-Aug-2019.
[2] Kuroda, N. (2020). Epilepsy and COVID-19: Associations and important considerations. Epilepsy & Behavior, 108: 107122. https://doi.org/10.1016/j.yebeh.2020.107122
[3] Moshé, S.L., Perucca, E., Ryvlin, P., Tomson, T. (2015). Epilepsy: New advances. The Lancet, 385(9971): 884-898. https://doi.org/10.1016/S0140-6736(14)60456-6
[4] Wijayanto, I., Rizal, A., Humairani, A. (2019). Seizure detection based on EEG signals using Katz fractal and SVM classifiers. In 2019 5th International Conference on Science in Information Technology (ICSITech), Yogyakarta, Indonesia, pp. 78-82. https://doi.org/10.1109/ICSITech46713.2019.8987487
[5] Falco-Walter, J.J., Scheffer, I.E., Fisher, R.S. (2018). The new definition and classification of seizures and epilepsy. Epilepsy Research, 139: 73-79. https://doi.org/10.1016/j.eplepsyres.2017.11.015
[6] Tripathi, D., Agrawal, N. (2019). Epileptic seizure detection using empirical mode decomposition based fuzzy entropy and support vector machine. In: Hwang S., Tan S., Bien F. (eds) Proceedings of the Sixth International Conference on Green and Human Information Technology. ICGHIT 2018. Lecture Notes in Electrical Engineering, vol. 502. Springer, Singapore. https://doi.org/10.1007/978-981-13-0311-1_20
[7] Zandi, A.S., Javidan, M., Dumont, G.A., Tafreshi, R. (2010). Automated real-time epileptic seizure detection in scalp EEG recordings using an algorithm based on wavelet packet transform. IEEE Transactions on Biomedical Engineering, 57(7): 1639-1651. https://doi.org/10.1109/TBME.2010.2046417
[8] Prabhakar, S.K., Rajaguru, H. (2016). Efficient wireless system for telemedicine application with reduced PAPR using QMF based pts technique for epilepsy classification from EEG signals. In: Vlad S., Roman N. (eds) International Conference on Advancements of Medicine and Health Care through Technology, 59: 313-316. https://doi.org/10.1007/978-3-319-52875-5_65
[9] Subasi, A., Gursoy, M.I. (2010). EEG signal classification using PCA, ICA, LDA and support vector machines. Expert Systems with Applications, 37(12): 8659-8666. https://doi.org/10.1016/j.eswa.2010.06.065
[10] Capurro, A., Diambra, L., Lorenzo, D., Macadar, O., Martin, M.T., Mostaccio,C., Plastino, A., Pérez, J., Rofman, E., Torres, M.E., Velluti, J. (1999). Human brain dynamics: The analysis of EEG signals with Tsallis information measure. Physica A: Statistical Mechanics and its Applications, 265(1-2): 235-254. https://doi.org/10.1016/S0378-4371(98)00471-3
[11] Acharya, U.R., Fujita, H., Sudarshan, V.K., Bhat, S., Koh, J.E.W. (2015). Application of entropies for automated diagnosis of epilepsy using EEG signals: A review. Knowledge-Based Systems, 88: 85-96. https://doi.org/10.1016/j.knosys.2015.08.004
[12] Fadlallah, B., Chen, B., Keil, A., Príncipe, J. (2013). Weighted-permutation entropy: A complexity measure for time series incorporating amplitude information. Physical Review E, 87(2-1): 022911. https://doi.org/10.1103/PhysRevE.87.022911
[13] Cao, Y.H., Tung, W.W., Gao, J.B., Protopopescu, V., Hively, L. (2004). Detecting dynamical changes in time series using the permutation entropy. Physical Review E, 70(4): 046217. https://doi.org/10.1103/PhysRevE.70.046217
[14] Rosso, O.A., Blanco, S., Yordanova, J., Kolev, V., Figliola, A., Schürmann, M., Başar, E. (2001). Wavelet entropy: A new tool for analysis of short duration brain electrical signals. Journal of Neuroscience Methods, 105(1): 65-75. https://doi.org/10.1016/S0165-0270(00)00356-3
[15] Swami, P., Panigrahi, B., Nara, S., Bhatia, M., Gandhi, T. (2016). EEG Epilepsy Datasets. https://doi.org/10.13140/RG.2.2.14280.32006
[16] Katz, M.J. (1988). Fractals and the analysis of waveforms. Computer in Biology and Medicine, 18(3): 145-156. https://doi.org/10.1016/0010-4825(88)90041-8
[17] Güçlü, U., Güçlütürk, Y., Loo, C.K. (2011). Evaluation of fractal dimension estimation methods for feature extraction in motor imagery based brain computer interface. Procedia Computer Science, 3: 589-594. https://doi.org/10.1016/j.procs.2010.12.098
[18] Wijayanto, I., Hartanto, R., Nugroho, H.A. (2020). Comparison of empirical mode decomposition and coarse-grained procedure for detecting pre-ictal and ictal condition in electroencephalography signal. Informatics in Medicine Unlocked, 19: 100325. https://doi.org/10.1016/j.imu.2020.100325
[19] Sevcik, C. (2006). On fractal dimension of waveforms. Chaos, Solitons and Fractals, 2(2): 579-580. https://doi.org/10.1016/j.chaos.2005.07.003
[20] Nikolopoulos, D., Moustris, K., Petraki, E., Koulougliotis, D., Cantzos, D. (2019). Fractal and long-memory traces in PM10 time series in Athens, Greece. Environments, 6(3): 29. https://doi.org/10.3390/environments6030029
[21] Sharmila, A., Geethanjali, P. (2016). DWT based detection of epileptic seizure from EEG signals using Naive Bayes and k-NN classifiers. IEEE Access, 4: 7716-7727. https://doi.org/10.1109/ACCESS.2016.2585661
[22] Rennie, J.D.M., Shih, L., Teevan, J., Karger, D. (2003). Tackling the poor assumptions of Naive Bayes text classifiers. Proceedings, Twent. Int. Conf. Mach. Learn., 2: 616-623.
[23] Rajaguru, H., Prabhakar, S.K. (2018). Hessian LLE and Naïve Bayesian classifier for Epilepsy classification from EEG signals. 2018 2nd International on Electronics, Communication and Aerospace Technology, Coimbatore, India.
[24] Xu, S. (2018). Bayesian Naïve Bayes classifiers to text classification. Journal of Information Science, 44(1): 48-59. https://doi.org/10.1177/0165551516677946
[25] Yi, G.S., Wang, J., Deng, B., Wei, X.L. (2017). Complexity of resting-state EEG activity in the patients with early-stage Parkinson's disease. Cognitive Neurodynamics, 11(2): 147-160. https://doi.org/10.1007/s11571-016-9415-z
[26] Al-Nuaimi, A.H.H., Jammeh, E., Sun, L.F., Ifeachor, E. (2018). Complexity measures for quantifying changes in electroencephalogram in Alzheimer's disease. Complexity, 2018: 8915079. https://doi.org/10.1155/2018/8915079
[27] Gupta, A., Singh, P., Karlekar, M. (2018). A novel signal modeling approach for classification of seizure and seizure-free EEG signals. IEEE Transactions on Neural Systems and Rehabilitation Engineering, 26(5): 925-935. https://doi.org/10.1109/TNSRE.2018.2818123
[28] Li, Y., Cui, W.G., Huang, H., Guo, Y.Z., Li, K., Tan, T. (2019). Epileptic seizure detection in EEG signals using sparse multiscale radial basis function networks and the Fisher vector approach. Knowledge-Based Systems, 164: 96-106. https://doi.org/10.1016/j.knosys.2018.10.029
[29] Hadiyoso, S., Irawati, I.D., Rizal, A. (2021). Epileptic electroencephalogram classification using relative wavelet sub-band energy and wavelet entropy, International Journal of Engineering, Transactions A: Basics, 34(1): 75–81. https://doi.org/10.5829/IJE.2021.34.01A.09
[30] Sharma, M., Bhurane, A.A., Acharya, U.R. (2018). MMSFL-OWFB: A novel class of orthogonal wavelet filters for epileptic seizure detection. Knowledge-Based Systems, 160: 265-277. https://doi.org/10.1016/j.knosys.2018.07.019
[31] Wijayanto, I., Rizal, S., Hadiyoso, S. (2020). Epileptic electroencephalogram signal classification using wavelet energy and random forest. In 6th International Conference on Science and Technology (ICST 2020), Palu, Indonesia.