Farzaneh Shafiei | Shervan Fekri-Ershad*
© 2020 IIETA. This article is published by IIETA and is licensed under the CC BY 4.0 license (http://creativecommons.org/licenses/by/4.0/).
OPEN ACCESS
Lung cancer is a problem that has become increasingly widespread in recent years due to smoking, poor nutrition and other factors. If lung cancer cells are identified at an early stage, they will be crucial in saving lives. Machine learning-based approaches to detecting lung cancer tumors have reduced the need for manpower, reduced human error and reduced medical costs. CT scan images are one of the efficient image types to identify these tumors in the lung. However, the random location and shape of the tumors and poor quality of CT scans are biggest challenges in lung cancer tumor detection. In this paper, a multi-step method for detecting cancer tumors in CT scans is proposed. In the proposed method, the images are first clustered using the super pixel algorithm. The morphological operators are then used to cut the unconnected parts. Finally, the cancerous nodules and tumors are identified using the active contour algorithm. The performance of the proposed approach is evaluated on benchmark LIDC database in terms of Dice similarity measure which is 84.88%. Results show the higher performance of the proposed approach in comparison with state-of-the-art methods in this area.
lung cancer tumor, CT scan images, super pixel algorithm, morphological operations, active contour
Lung cancer is one of the most dangerous diseases in the world. Early detection of lung cancer can greatly increase the chance of survival. Almost 80% of patients survive up to 5 years after being diagnosed with lung cancer at best. Statistical analysis shows that deaths from lung cancer are higher than prostate, colon and breast cancer. Effective use of machine learning-based techniques, along with medical knowledge, can help to precisely identify the disease [1]. One of the most challenging issues in lung cancer tumor detection is the size of tumors [2]. In fact, nodules or tumors are spherical radiographic segments less than 1 cm in diameter which make detection hard [3]. The pulmonary nodules are divided into two groups of benign (non-cancerous) and malignant (cancerous) nodules. Carcinoid tumors and metastases are due to primary lung cancer [4]. The methods presented so far have been discussed from two perspectives. First perspective, the nodules are divided into benign and malignant clusters, which capture a wide range of research. The second perspective is detection nodules in terms of shape and structure. Much research has so far been challenged by the dimensions. This means that the methods presented are problematic. This inconsistency shows that some of the proposed methods cannot distinguish between small nodules and pulmonary arteries, and this makes the system to identify nodules with high error. Therefore, in this paper, a new method with the specificity of differentiation between pulmonary vessels and small nodules is proposed.
The main goal of this paper is as follows:
Increase the detection accuracy rate of lung cancer tumors in CT scan images, in comparison with state-of-the-art methods in this scope.
In this respect, a multi-stage method is proposed based on following contributions:
Clustering CT scan image to little parts before applying detection algorithm, improves the detection rate of lung cancer tumors.
Eliminating little unconnected parts in CT scan image may improve the performance of lung cancer tumor detection algorithm.
The proposed approach is a multi-stage method. First, super pixel algorithm is used to cluster CT scan image to partially segments. Next, morphological operations are employed to improve detection quality. Eliminating little unconnected parts and hole filling are two important advantages of this stage. Finally, to improve detection localization, active contour algorithm is used. The performance of the proposed approach is evaluated on benchmark LIDC database in terms of Dice similarity measure which is 84.88%. Results show the higher performance of the proposed approach in comparison with state-of-the-art methods in this area.
Since now, many different approaches have been proposed for lung cancer tumor detection. As a new efficient method, Diciotti et al. [5], proposed a semi-automated method for 3D dimensional of lung nodules in CT images. The main novelties of the proposed algorithm [5] are the existence of a system-to-user interaction process, using a geodetic distance in multi-threshold image processing, which allows for a gray matter-based resemblance and object shape separation. This algorithm is evaluated on CT images with enough number of small nodules (mean diameter 11-11.3 mm). Another experiment is performed by Diciotti et al. [5], on small lung nodules from the dataset (LIDC) with a system error of less than 6.6% observed. A system is proposed for early detection of lung nodules [6]. They first localized the lung using the local threshold algorithm. Then, a Gaussian filter is used to reduce possible noise. Some features such as curvelet coefficients, mean, local variance, elongation and boundary are extracted. Finally, fuzzy KNN system is used to classify CT regions. The sensitivity rate of this system is 88% on LIDC dataset.
Tan et al. [7] developed a computer-aided diagnosis system with four steps: preprocessing, cancer nodule detection, feature selection, and classification. To classify the genetic based algorithms, feed-forward neural network wand support vector machine is tested. The results showed that neural network performs better performance than other mentioned classifications. Diciotti et al. [8] proposed an automated detection approach which is applied to the primary large area of lung nodules. This method is iterative with correction process based on the local shape analysis of the initial zoning using 3D geodetic distance map representations. The correction method has the advantage of locally identifying the nodule region only in the arteries, without modifying the nodule boundary. This method is obtained by applying a simple large initialization area tested by constant image thresholding. The performance is evaluated on ITALUNG and LIDC datasets. In fully automatic mode, the pulmonary nodules classified with accuracy of 84.8% on ITALUNG and 88.5% on LIDC. In literature [9] cancerous nodules are diagnosed after noise reduction of CT images. In this respect, weighted fuzzy clustering is used for segmentation. The RBF classification performed better than linear and polynomial classifications [9]. Keshani et al. proposed a multi-step lung nodules diagnosis [10]. First, region of interest (ROI) segmentation is done using active contour and then SVM is used for classification. The results show that the proposed system could distinguish cancer nodules from non-cancers with 89% accuracy.
In some cases, texture features are used to describe tumor features. Farahani et al. [11] proposed a novel lung cancer diagnosis approach based on ensemble learning. Multilayer perceptron (MLP), support vector machine (SVM) and k-nearest neighbor (KNN) have been used to distinguish cancer nodules [11]. The accuracy of this method is 94 percent on collected dataset. In the proposed method, the pre-processing is performed on the whole CT scans and then the discrete wavelet transform algorithm extracts features of each nodule and healthy parts. Finally, it is classified by the use of ensemble learning. Nithila and Kumar [12] used fuzzy c-means clustering and active contour to identify nodes. They, first reconstructed lung texture using Gaussian filters. Next, nodules are segmented using active contour model. Finally, lung cancer nodules are classified using fuzzy c-means. The proposed approach [12], is able to identify 3 to 30 mm nodules with good accuracy. Sung et al. [13] used a toboggan algorithm-based method to localize lung cancer nodules. In this method, the central nodule region gradient is first identified using a multidimensional gradient, and then it is expanded to the nodule boundaries. This method is evaluated on two-dimensional and three-dimensional data.
Wang et al. [14] proposed a data based model, called the central focused convolutional neural network (CF-CNN), to localize lung nodules from heterogeneous in CT images. The approach of this study follows this contribution that, the proposed model captures a diverse set of nodule-sensitive features from both 3-D and 2-D CT images simultaneously. This aim is accessed by providing a central integration layer and a multi-scale patch learning strategy. In addition, a weighted sampling is designed to facilitate model training. The proposed method is investigated on the LIDC dataset consisting of 893 nodules and an independent dataset with 74 nodules from Guangdong General Hospital (GDGH). The sensitivity is 82.15 percent and 80.02 percent, respectively.
Shakir et al. [15] developed a semi-automatic system with ability to locate 3D parts in small and large nodules with good accuracy. The region of interest (ROI) around the target nodule is selected on a threshold cut. Also, a comparative method is developed based on histograms of image to estimate the average brightness of nodules [15]. The proposed system is compared with Chan-Vese algorithm and basic active contour algorithm in terms of detection rate. Jiang et al. [16] introduced two formulations of Multiple Resolution Connected Network (MRRN) called incremental MRRN and dense MRRN. The proposed networks simultaneously combine features with multiple image resolution and feature levels through residual connections to diagnose lung tumors. The proposed method performance is evaluated on NSCLC dataset with totally 1,210 non-small pulmonary tumors and LIDC dataset. Jiang et al. [16] developed a multi-scale CNN method for volumetric cross-section pulmonary tumors that enables accurate, automated detection and measurement of tumor volume in the lung. 85 percent sensitivity has been reported for tumor localization [16]. In some cases, deep feature [17] or texture features are used to define cancer properties locally or globally [18, 19].
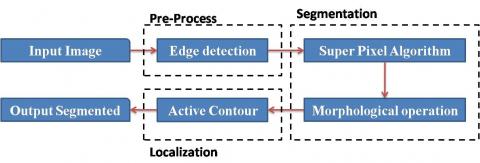
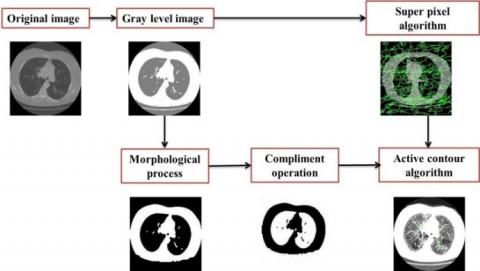
As mentioned above the proposed lung cancer tumors detection approach is a multistage method that consists of three stages. The block diagram of our proposed approach is shown in the Figure 1. It is included preprocessing, segmentation, and localization.
Figure 1. The main block diagram of the proposed approach
3.1 Pre-process stage
Current imaging systems most times produce poor quality images with blurred edges due to different reasons such as imaging quality, illumination condition, noise, etc. The uncertainty of the edges in the CT scan images, strongly affects the performance of the tumor detection systems. Therefore, identifying the edges of the image is one of the essential strategies for achieving good results in this research. In this stage, the modified Sobel filter is used for edge detection. Modified Sobel filter is proposed by Gupta and Mazumdar [20] to achieve better results than popular sobel filter on local corners. This filter uses two vertical and horizontal masks to identify vertical lines, horizontal lines and corner edges. Figure 2 shows the two vertical and horizontal filters used in this research [20].
Figure 2. Improved sobel filter mask in preprocess stage
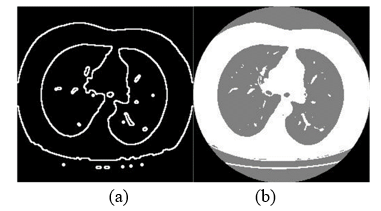
An example of using the above mentioned improved sobel filter is shown in the Figure 3.
Figure 3. An example of edge detection using modified sobel filter (a) The original image, (b) Filtered image
3.2 Super pixel algorithm
The purpose of using super-pixel algorithm is to cluster the image into the original meaningful segments. After clustering, the number of samples required for processing should be significantly reduced. In this study, the super pixel algorithm is used to implement SLIC, which is based on K-means clustering.
The SLIC (simple linear iterative clustering) algorithm is a superpixel-based segmentation algorithm, superior to pixel-level algorithm in terms of feature extraction and quantitative analysis, etc. SLIC chooses cluster centers Ci from the sampled space A to generate efficient superpixels. S can be described as follows:
$A=\sqrt{N_{1} \times N_{2} / P}$ (1)
where, N1×N2 shows the size of input image. Also, P means the number of the superpixels. SLIC just searches for similar pixels from each cluster center to pixels for clustering within a 2A×2A. In this respect, color similarity and spatial distance are measured in a joint distance D. In this paper, image is converted to color space Lab. Next, color similarity (Sc) is measured as follows:
$S_{c}(i, j)=\sqrt{\left(l_{i}-l_{j}\right)^{2}+\left(a_{i}-a_{j}\right)^{2}+\left(b_{i}-b_{j}\right)^{2}}$ (2)
where, [li,ai,bi] and [lj,aj,bj] are the color representation of pixels i & j. Spatial distance is computed using the Eq. (3).
$d_{s}(i, j)=\sqrt{\left(x_{i}-x_{j}\right)^{2}+\left(y_{i}-y_{j}\right)^{2}}$ (3)
Also, [xi,yi] and [xj,yj] are the position of pixels i and j. Finally, SLIC combines the spatial distances with the color similarity in a distance measure D (Eq. (4)).
$D=\sqrt{\left(\frac{S_{c}}{N_{1} \times N_{2}}\right)^{2}+\left(\frac{d_{s}}{N_{1} \times N_{2}}\right)^{2}}$ (4)
There are two determining parameters in this algorithm, which are:
a. Compression rate of super pixel
b. Number of super pixels
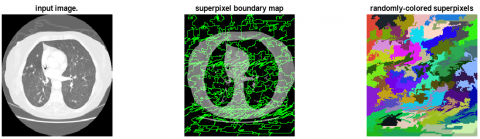
The amount of super-pixel compression is set by the user and depends on the type of image. In our experiments, m=0.2 provides best results. The number of super-pixels is also determined by the user. It is estimated 500 super-pixels in this paper. In the Figure 4, an output example of super-pixel process is shown in lung images. The super-pixel compression amount is usually selected numerically in the [0 1] range. The closer the compression amount to one, the smoother the boundaries between the regions and the less accurate the zoning. However, if the compression rate is close to zero, the accuracy of the boundaries is increased and zoning is best done.
Figure 4. Output example of using super-pixel algorithm in lung image, where M=0.2 and number of super pixels=500
3.3 Morphological process
Morphological operators are used in some steps to increase the accuracy of identifying the area associated with the tumor. These are used here to remove irrelevant parts that are smaller than the tumor in lung image. The following steps have been taken in the process of morphological operators to finally get the best result.
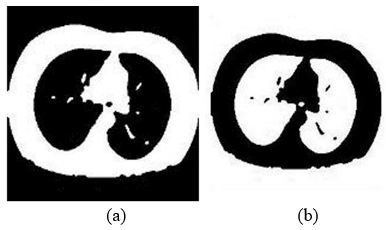
3.3.1 Convert lung image to the binary sample
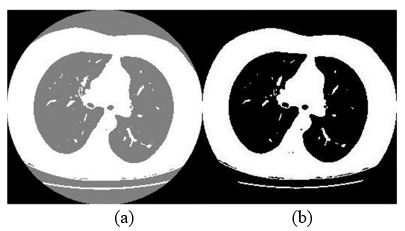
Morphological operators should be applied on binary images. The Otsu algorithm is used here to convert the colored lung image to a binary image. This algorithm operates in two classes and the desired threshold is obtained by clustering and calculating the total weight of variance of each cluster, for each image based on the image information, a threshold value is obtained. An example of using Otsu algorithm is shown in the Figure 5.
Figure 5. An example of applying Otsu algorithm on lung image (a) Original image, (b) Otsu output sample
3.3.2 Opening operation
The opening operator is one of the popular morphological operations that eliminates narrower connections and creates an image with smoother edges. This process is performed based on Eq. (5).
$I_{2}=I_{1} \circ B=(A \ominus B) \oplus B$ (5)
where, I1 shows the binary lung image after applying Otsu algorithm. B is the structure element. Symbols $\oplus$ and $\ominus$ show dilation and erosion morphological operations. Symbol "◦" shows the opening operator. I2 is the output image after using opening morphological process as shown in Figure 6.
Figure 6. An example of applying opening operator on binary lung image (a) Original image, (b) After using opening operator
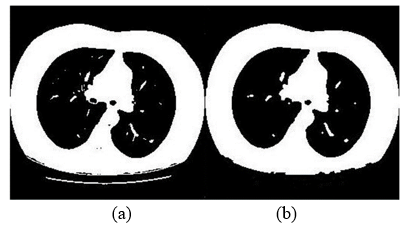
3.3.3 Closing operation
The closing morphological operator softens the existing contours. In the opposite process of opening process, it generally connects the small gaps between the related parts and enlarges the interconnected areas. This process is shown in the Eq. (6).
$\mathrm{I}_{3}=\mathrm{I}_{2} \bullet \mathrm{B}=\left(I_{2} \oplus B\right) \ominus B$ (6)
where, I2 shows the input binary lung image after applying opening operator. Symbol " $\bullet$" shows the morphological closing operator. B is the structure element. Symbols $\oplus$ and $\ominus$ show dilation and erosion morphological operations. An example is shown in Figure 7.
Figure 7. An example of applying closing operator on binary lung image (a) Input image after applying opening, (b) After using closing operator
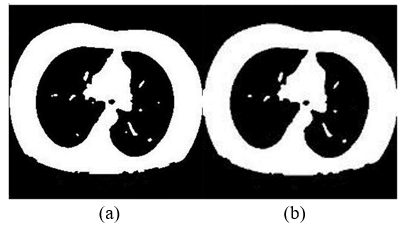
3.3.4 Compliment operation
In order to highlight tumor parts in the lung image. Morphological compliment operator is used here which provide a binary output. In the output template, black sections in the lung parts are very near to cancer (Figure 8).
Figure 8. An example of applying compliment operator on binary lung image (a) Input image after applying closing, (b) After using compliment operator
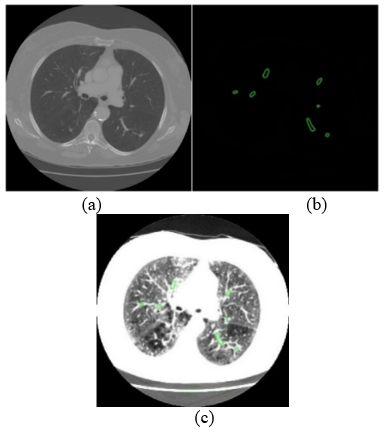
3.4 Active contour algorithm
The active contour algorithm is a convenient tool for specifying a specific area of the image. The active contour model, directs the contour towards of the boundaries based on edge energy. Since in the proposed method, tumor borders play important role, then the desired contour is formed around the tumor and the desired borders, which include the edges of the tumor, are shown with high accuracy. An example of using active contour in lung tumor, after applying morphological process, is shown in the Figure 9.
Figure 9. An example of using active contour algorithm to detect tumor in lung image (a) Input image after morphological process (b) Boundary detected (c) Tumor segmented output after using active contour
A visual example of the proposed lung cancer tumor detection approach is shown in Figure 10. As can be seen, first, super pixel algorithm is performed on gray level image to segment image. The position of super-pixel regions is saved. Next, the original image is filtered by morphological operations to cut very little isolated islands. Filtered image is used as input sample of active contour algorithm. Performing active contour algorithm on the original image is consumed most time and makes complexity. So, active contour is performed in each super pixel region separately, that reduces total runtime and improve better localization.
Figure 10. A visual example of the proposed approach stages
4.1 Performance evaluation metrics
Nodule detection in CT images has always faced several challenges. The random shape and position of tumors and nodules, the low contrast of CT images have led to several methods to identify this important issue. In this paper, a novel multi step tumor detection approach is proposed with acronym LTD-SAC. In the continuation of this section, by designing different experiments, performance will be evaluated qualitatively and quantitatively. In the quantitatively evaluations, two criteria as sensitivity and Dice similarity is used.
Sensitivity $=\frac{T P}{T P+F N}$ (7)
Dice $=\frac{2 \times T P}{(2 \times T P)+F N+F P}$ (8)
where, TP means the number of real tumor pixels where detected as tumor. FN shows the number of real non-tumor pixels where detected as tumor. Also, FP is the number of really tumor pixels that detected as non-tumor using proposed approach.
4.2 Dataset
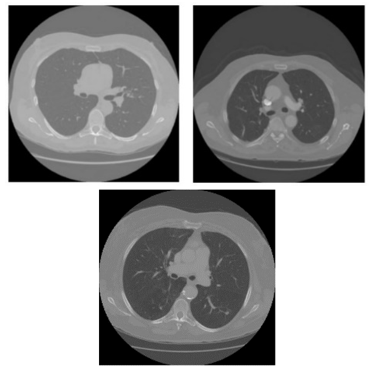
The images used in this study to evaluate performance are from the LIDC database [21]. The database contains 1,018 CT images of 1,010 patients. In order to compare the performance of our proposed approach 400 lung images are selected randomly in DICOM format, which has been tagged by a number of specialist physicians. This database is a benchmark in the identification of nodules and tumors, which was produced by the NIC. Some examples of LIDC dataset are shown in Figure 11.
Figure 11. Some example of lung tumor in the LIDC dataset
4.3 Performance evaluation
The main aim of this paper is to propose an approach for lung cancer tumor detection. In this respect, the proposed approach is applied on all dataset images. Different structure elements are employed here to provide maximum accuracy. In all dataset samples, ground truth is used to evaluate the quality of output detected image in pixel scale. The results are shown in the Table 1.
Table 1. Performance evaluation of the proposed approach different structure elements in terms of sensitivity and Dice (%)
|
Structure element type |
Dice |
Sensitivity |
|
Diamond |
82.26 |
90.17 |
|
Rectangular |
77.76 |
70.61 |
|
line |
78.23 |
71.52 |
|
Circle |
84.88 |
94.20 |
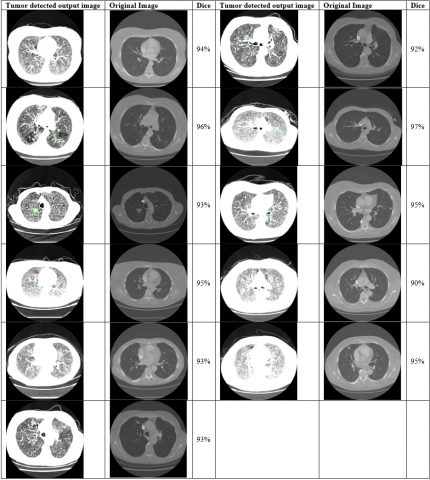
Some examples of lung nodules detected samples using our proposed approach on LIDC dataset images, are shown in the Figure 12.
4.4 Comparison with state-of-the-art methods
The performance of our proposed approach is compared with some related works such as [13, 14, 16]. The results are shown in the Table 2, in terms of average sensitivity and average Dice similarity.
Table 2. Comparison results of our proposed approach and some state-of-the-art methods in terms of sensitivity and Dice (%)
|
Method |
Dice |
Sensitivity |
|
Toboggan [13] |
81.57 |
96/35 |
|
RF+fCRF [16] |
49 |
66 |
|
Unet [16] |
58 |
80 |
|
Segnet [16] |
57 |
70 |
|
FRRN [16] |
60 |
76 |
|
In ere [16] |
68 |
85 |
|
Dense [16] |
67 |
82 |
|
Level Set [14] |
60/63 |
64/38 |
|
Graph Cut [14] |
68/69 |
65/09 |
|
U-Net [14] |
79/50 |
78/18 |
|
3-D-Patch Branch [14] |
79/20 |
72/91 |
|
2-D-Patch Branch [14] |
80/47 |
74/64 |
|
CF-CNN-MP [14] |
80/39 |
74/52 |
|
Proposed method |
84/88 |
94/20 |
Figure 12. Some visual example of the proposed tumor detection output
The main aim of this paper is to propose an efficient method for lung cancer tumor detection. In this respect a three-stage approach is proposed which consist of preprocess, segmentation, and localization. Preprocess step, make the input image more ready for super pixel algorithm. Super pixel algorithm segments the lung image to cancerous and not-cancerous parts. Finally, active contour algorithm improves localization. The experimental results show that proposed approach provide higher detection rate in comparison state-of-the-art methods in this area. The proposed method provides a general block diagram for visual object detection that can be used in many other real computer vision applications. Gray scale invariant is another advantage of the proposed approach because of optimization capability of super pixel algorithm.
[1] Torre, L.A., Siegel, R.L., Jemal, A. (2016). Lung cancer statistics. In Lung Cancer and Personalized Medicine. Springer, Cham, pp. 1-19. http://dx.doi.org/10.1007/978-3-319-24223-1
[2] Hatt, M., Cheze-le Rest, C., Van Baardwijk, A., Lambin, P., Pradier, O., Visvikis, D. (2011). Impact of tumor size and tracer uptake heterogeneity in 18F-FDG PET and CT non–small cell lung cancer tumor delineation. Journal of Nuclear Medicine, 52(11): 1690-1697. http://dx.doi.org/10.2967/jnumed.111.092767
[3] Farag, A.A. (2013). Variational approach for small-size lung nodule segmentation. IEEE 10th International Symposium on Biomedical Imaging, pp. 81-84. http://dx.doi.org/10.1109/ISBI.2013.6556417
[4] Harrison, A.P., Xu, Z., George, K., Lu, L., Summers, R. M., Mollura, D.J. (2017). Progressive and multi-path holistically nested neural networks for pathological lung segmentation from CT images. In International Conference on Medical Image Computing and Computer-Assisted Intervention, Springer, pp. 621-629. https://doi.org/10.1007/978-3-319-66179-7_71
[5] Diciotti, S., Picozzi, G., Falchini, M., Mascalchi, M., Villari, N., Valli, G. (2008). 3-D segmentation algorithm of small lung nodules in spiral CT images. IEEE transactions on Information Technology in Biomedicine, 12(1): 7-19. http://dx.doi.org/10.1109/TITB.2007.899504
[6] Namin, S.T., Moghaddam, H.A., Jafari, R., Esmaeil-Zadeh, M., Gity, M. (2010). Automated detection and classification of pulmonary nodules in 3D thoracic CT images. In Proc. IEEE International Conference on Systems Man and Cybernetics, pp. 3774-3779. http://dx.doi.org/10.1109/ICSMC.2010.5641820
[7] Tan, M., Deklerck, R., Jansen, B., Bister, M., Cornelis, J. (2011). A novel computer aided lung nodule detection system for CT images. Medical Physics, 38(10): 5630-5645. http://dx.doi.org/10.1118/1.3633941
[8] Diciotti, S., Lombardo, S., Falchini, M., Picozzi, G., Mascalchi, M. (2011) Automated segmentation refinement of small lung nodules in CT scans by local shape analysis. IEEE Transactions on Biomedical Engineering, 58(12): 3418-3428. http://dx.doi.org/10.1109/TBME.2011.2167621
[9] Sivakumar S., Chandrasekar, C. (2013). Lung nodule detection using fuzzy clustering and support vector machines. International Journal of Engineering and Technology, 5(1): 179-185.
[10] Keshani, M., Azimifar, Z., Tajeripour, F., Boostani, R. (2013). Lung nodule segmentation and recognition using SVM classifier and active contour modeling: A complete intelligent system. Computers in Biology and Medicine, 43(4): 287-300. http://dx.doi.org/10.1016/j.compbiomed.2012.12.004
[11] Farahani, F.V., Ahmadi, A., Zarandi, M.F. (2015). Lung nodule diagnosis from CT images based on ensemble learning. In IEEE Conference on Computational Intelligence in Bioinformatics and Computational Biology, pp. 1-7. http://dx.doi.org/10.1109/CIBCB.2015.7300281
[12] Nithila, E.E., Kumar, S. (2016). Segmentation of lung nodule in CT data using active contour model and Fuzzy C-mean clustering. Alexandria Engineering Journal, 55(3): 2583-2588. http://dx.doi.org/10.1016/j.aej.2016.06.002
[13] Song J., Yang, C., Fan, L., Wang, K., Yang, F., Liu, S., Tian, J. (2015). Lung lesion extraction using a toboggan based growing automatic segmentation approach. IEEE Transactions on Medical Imaging, 35(1): 337-35. http://dx.doi.org/10.1109/TMI.2015.2474119
[14] Wang S., Zhou, M., Liu, Z., Zhenyu, L., Dongsheng, G., Zang, Y., Dong, D., Gevaert, O., Tian, J. (2017). Central focused convolutional neural networks: Developing a data-driven model for lung nodule segmentation. Medical Image Analysis, 40: 172-183. http://dx.doi.org/10.1016/j.media.2017.06.014
[15] Shakir, H., Khan, T.M., Rasheed, H. (2018). 3-D segmentation of lung nodules using hybrid level sets. Computers in Biology and Medicine, 96: 214-226. http://dx.doi.org/10.1016/j.compbiomed.2018.03.015
[16] Jiang J., Hu, Y., Liu, C., Halpenny, D., Hellmann, M.D., Deasy, J.O., Mageras, G., Veeraraghavan, H. (2018). Multiple resolution residually connected feature streams for automatic lung tumor segmentation from CT images. IEEE Transactions on Medical Imaging, 38(1): 134-144. http://dx.doi.org/10.1109/TMI.2018.2857800
[17] Gupta S., Mazumdar, S.G. (2013). Sobel Edge Detection Algorithm. International Journal of Computer Science and Management Research, 2(2): 1578-1583.
[18] Armato S.G. (2011). The lung image database consortium (LIDC) and image database resource initiative (IDRI): A completed reference database of lung nodules on CT scans. Medical Physics, 38(2): 915-931. http://dx.doi.org/10.1118/1.3528204
[19] Fekri-Ershad, S. (2019). Pap smear classification using combination of global significant value, texture statistical features and time series features. Multimedia Tools and Applications, 78(22): 31121-31136. http://dx.doi.org/10.1007/s11042-019-07937-y
[20] Shakeel, P.M., Burhanuddin, M.A., Desa, M.I. (2019). Lung cancer detection from CT image using improved profuse clustering and deep learning instantaneously trained neural networks. Measurement, 145: 702-712. http://dx.doi.org/10.1016/j.measurement.2019.05.027
[21] Armi, L., Fekri-Ershad, S. (2019). Texture image analysis and texture classification methods-a review. arXiv preprint arXiv:1904.06554.