Qiang Guo
© 2020 IIETA. This article is published by IIETA and is licensed under the CC BY 4.0 license (http://creativecommons.org/licenses/by/4.0/).
OPEN ACCESS
The proliferation of smart mobile terminals has weakened the attention and reduced the learning efficiency of students, making them more likely to lower their heads. To quantify the classroom participation, it is helpful to detect the head raising rate (HRR) of students in classroom. To this end, this paper puts forward a novel method to recognize the HRR of students in classroom. Based on the map of predicted facial features, an extraction method was developed for the salient facial features of students, and used to realize model matching between facial contour and facial organ. Next, the face orientation of each student was determined by soft label coding. After that, a multi-task convolutional neural network (CNN) was constructed to detect the HRR of students. The authors also explained the regularization of the loss function, and the steps of target detection. The proposed method was proved effective through experiments. The research results provide a reference for the application of head posture recognition in other fields.
head posture recognition, head raising rate (HRR), convolutional neural network (CNN), human organ model
During traditional classroom teaching and online teaching, the learning efficiency of the students is easily affected by the use of smart mobile terminals, which weakens student attention and makes them more likely to lower their heads [1-3]. Compared with other teaching analyses tools, the quantification of classroom participation helps to promote the autonomous and in-depth learning among students [4, 5]. In the learning process, the line of sight, head posture, and facial expressions of a student can reflect his/her cognitive and emotional participations in the classroom. These non-verbal data can be obtained by corresponding algorithms [6-9].
With the rapid development of artificial intelligence (AI), intelligent video analysis and deep learning have become increasing popular [10-13]. To ensure the effect of classroom teaching and learning efficiency, it is of great practical significance to detect the head raising rate (HRR) of students based on AI technologies capable of recognizing head postures. The existing studies on face detection and recognition mainly tackles two issues: extraction of facial features, and statistics and comparison of facial images. Many features are taken as the bases for judgement, including facial contour, skin color, and texture [14-17].
On the extraction of facial features, Bhiwapurkar et al. [18] processed the facial contour, skin color, and texture through image sharpening and smoothing, and improved the accuracy of finding the matching images in the massive image library for the target face. Smulders et al. [19] combined facial contour, skin color, with texture, enhanced the hybrid feature with a self-designed gray-level co-occurrence matrix, and effectively mitigated the disturbance of the complex image background or poor image quality to facial detection and recognition. Lee et al. [20] conducted template matching between skin color and texture of human faces, identified the skin area in target images by the Gaussian mixture model, and pinpointed the faces in the images based on the facial contour.
On the statistics and comparison of facial images, Howie et al. [21] filtered the redundant information in facial images, using a machine learning algorithm and principal component analysis (PCA), and classified facial faces through k-means clustering (KMC). To improve the accurate and speed of facial recognition by Haar facial feature classifier, Douglas and Gallagher [22] adopted the adaptive boosting (AdaBoost) algorithm to cascade multiple Haar facial feature classifiers into a strong classifier, which is suitable for facial detection from multiple angles. Velasco et al. [23] constructed an AdaBoost classifier cluster to detect faces in four postures, and integrated the detection and recognition result of each classifier into the final classes.
The prerequisite for judging the student participation in class is to accurately position the head posture of each student. Gilchrist et al. [24] designed a deep convolutional neural network (CNN) to locate the three-dimensional (3D) distribution of salient facial features, match the locations of these features with the key points in the template, and evaluate the head postures by the 3D deflection angle of the face. Using the Kinect somatosensory device, Weidling and Jaschinski [25] collected the skeleton data of multiple students in the classroom, and monitored, recognized, and classified the learning states of the students based on the head and neck skeleton data. Mencarelli et al. [26] tracked and recognized the head movement trajectory of a single student in the classroom surveillance video, and classified the classroom participation by support vector machine (SVM).
The existing algorithms or models for head posture recognition rely too much on the tracking and measurement of head movement trajectory, failing to achieve a high accuracy in complex scenes. If the student bodies are overlapped or severely occluded in the classroom, it is difficult to pinpoint the salient facial features, as the body reflection angle increases. Moreover, the deep CNN is too slow in computing, despite its strong analysis power. To accurately detect the head raising states of students in classroom, this paper puts forward a novel detection method for the head raising rate (HRR) based on head posture recognition.
The remainder of this paper is organized as follows: Section 2 introduces the extraction of salient facial features of students, and completes the model matching between facial contours and facial organs, with the aid of the map of predicted facial features (PFFM); Section 3 determines the face orientation of each student based on soft label coding, and optimizes the probabilistic distribution of facial postures; Section 4 constructs a multi-task CNN for detecting the HRR of students, explains the regularization of the loss function, and specifies the steps of target detection; Section 5 verifies the effectiveness of the proposed method; Section 6 puts forward the conclusions.
Figure 1. The process of extracting salient facial features
As shown in Figure 1, this paper extracts the salient facial features of students in classroom in three steps.
Step 1. Predict the salient facial features of front facial images, and the obtain coordinates of the feature points to be detected and their surrounding sampling points.
A total of 12,500 images on students in classroom learning were selected. In each image, 60 facial feature points to be detected had already been labeled. Let (ai, bi) be the coordinates of each feature points. Then, the set of coordinates of all feature points can be expressed as:
$FP=({{a}_{1}},{{b}_{1}},{{a}_{2}},{{b}_{2}},...,{{a}_{N}},{{b}_{N}})$ (1)
Through the PCA, the value of FP can be solved using the structure parameter SP of facial contour model:
$FP=F{P}'+PCA\times SP$ (2)
where, FP' is the mean eigenvector of FP; PCA is the PCA matrix; FP' is the mean operation of the coordinates of all feature points in FP:
$F{P}'=\frac{1}{{{N}_{all}}}\sum\limits_{i=1}^{{{N}_{all}}}{F{{P}^{i}}}$ (3)
The PCA matrix PCA can be defined as the difference between an eigenvector and the mean eigenvector:
$X=\left[ \begin{align} & b_{1}^{1}\text{ }a_{2}^{1}\text{ }b_{2}^{1}\text{ }...\text{ }a_{N}^{1}\text{ }b_{N}^{1} \\ & b_{1}^{2}\text{ }a_{2}^{2}\text{ }b_{2}^{2}\text{ }...\text{ }a_{N}^{2}\text{ }b_{N}^{2} \\ & \text{ }...\text{ }... \\ & b_{1}^{{{N}_{all}}}\text{ }a_{2}^{{{N}_{all}}}\text{ }b_{2}^{{{N}_{all}}}\text{ }...\text{ }a_{N}^{{{N}_{all}}}\text{ }b_{N}^{{{N}_{all}}} \\ \end{align} \right] $ (4)
The eigenvalue λj of each matrix element could be obtained through calculation. The first M eigenvectors constitute the column vector of the structure change matrix SCM of facial contours. Then, the SP can be solved by:
$SP=SC{{M}^{T}}(FP-F{P}')$ (5)
Formula (5) shows that the SP, consisting of weight vectors reflecting the changes in facial contours, helps to determine the salient feature points. After the training of facial contour model, all the feature points in the initial images to be detected were sampled in the minimum difference neighborhood, followed by the construction of the set of sample coordinates.
Step 2. Generate the PFFM EF(a, b), and judge whether a point in the set of sample coordinate is the best matching point against the existing facial organ models.
The judgement was realized by a layer in a self-designed neural network, which is responsible for the nonlinear mapping between sampling pixels and outputs. The network training was completed, using the set of facial organ templates.
Once the best matching points to the feature point were determined in the minimum difference neighborhood, the similarity between each point and the feature point was evaluated, and the most similar point in the minimum difference neighborhood was selected to produce the PFFM.
Step 3. Based on EF(a, b) and facial organ models, construct the objective function O(X) under the facial contour change constraint and matching judgement constraint:
$O(x)=C(x)+\sum\limits_{i=1}^{N}{{{L}_{i}}({{a}_{i}};\Gamma )}$ (6)
where, C(x) is the matching accuracy facial contour model. The greater the C(x) value, the better the matching with the facial contour. The matching judgement constraint represents the matching accuracy of the facial organ model. The larger the constraint, the better the matching with facial organ. If the target feature point is judged as the best matching point, the objective function (6) is equivalent to the similarity estimation between probabilistic model parameters in maximum probability, i.e. the maximum likelihood estimation (MLE):
$L(x)=\prod\limits_{i=1}^{N}{l({{r}_{i}}=1|{{a}_{i}},\Gamma )}$ (7)
where, l={Z, R, T} is the results of linear transforms like scaling Z, rotation R, and translation of the model; ri is a binary function that characterizes the best matching point; if yes, ri =1; otherwise, ri =-1. The natural logarithm of formula (7) can be expressed as:
$\begin{align} & EF(x)=-\ln \{L(x)\} \\ & {{L}_{i}}({{r}_{i}};L)=-\ln \{l({{r}_{i}}=1|{{a}_{i}},\Gamma )\} \\ \end{align}$ (8)
In formula (8), the maximum probability is estimated approximately after the conversion of the probability space, producing the coordinates of the ideal feature point.
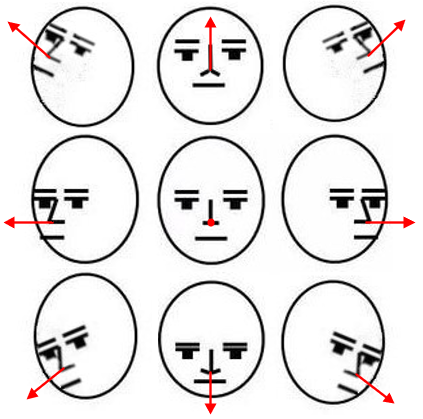
After positioning and extracting the feature points of student faces, this paper further determines the orientation of each student face. Let OVQ = [A, B, C] be the face orientation vector representing the head posture. The vectors of possible face orientations are shown in Figure 2. If a student is inattentive in class, he/she does not face forward. In this case, the orientation vector is inconsistent with the C-axis direction, that is, OVQ is not equal to the C-axis unit vector c = [0, 0, 1].
Figure 2. The vectors of face orientations
Before judging the HRR, it is critical to measure the deviation of the face orientation from the front. Here, the angle between the vector OVQAoC of OVQ projected to the AoC plane in the field of view (FOV) and the C-axis is defined as the yaw angle, and the angle between the vector OVQBoC of OVQ projected to the BoC plane in the FOV and the C-axis is defined as the itch angle. The projections can be described by:
$\left\{ \begin{align} & {{\theta }_{Y}}=\arccos \frac{c\cdot OV{{Q}_{\grave{\ }AoC}}}{\left\| c \right\|*\left\| OV{{Q}_{\grave{\ }AoC}} \right\|} \\ & {{\theta }_{P}}=\arccos \frac{c\cdot OV{{Q}_{\grave{\ }BoC}}}{\left\| c \right\|*\left\| OV{{Q}_{\grave{\ }BoC}} \right\|} \\ & {{\theta }_{R}}=\arccos \frac{b\cdot OV{{Q}_{\grave{\ }AoB}}}{\left\| b \right\|*\left\| OV{{Q}_{\grave{\ }BoC}} \right\|} \\ \end{align} \right.$ (9)
Since the feature matching of face orientation carries the characteristics of ordinal regression tasks, the probability of face orientation belonging to a class can be expressed as a soft label based on inter-class distance:
${{P}_{i}}=\frac{{{e}^{_{-h\left( {{\delta }_{true}},{{\delta }_{i}} \right)}}}}{\sum\limits_{j=1}^{H}{{{e}^{-h\left( {{\delta }_{i}},{{\delta }_{j}} \right)}}}},\left\{ \begin{align} & -h\left( {{\delta }_{true}},{{\delta }_{i}} \right)={{\left\| {{\delta }_{true}}-{{\delta }_{i}} \right\|}^{2}}\text{ } \\ & -h\left( {{\delta }_{true}},{{\delta }_{i}} \right)={{\left\| \log {{\delta }_{true}}-\log {{\delta }_{i}} \right\|}^{2}}\text{ } \\ \end{align} \right.$ (10)
where, δtrue is the true class of sample images δi ascribed to class P; h(δtrue, δti) is the metric function between δtrue and δti. As shown in formula (10), the class similarity is measured by Euclidean distance and logarithmic difference.
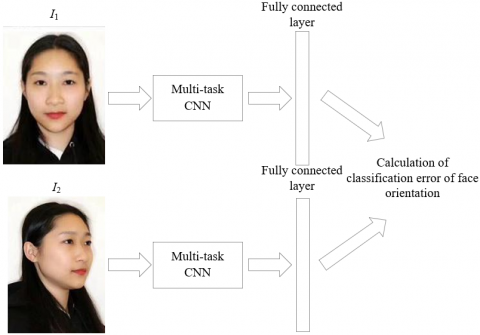
However, the head deflection of students does not lead to great changes in the coordinate value. To enhance model generalization and recognize head posture accurately, this paper preliminarily judges the classification range of head postures, and computes the head posture coordinates through direct regression, provided that the judgement is correct. Figure 3 explains the calculation of the classification error of face orientation.
Figure 3. The calculation of the classification error of face orientation
The classification error of image samples was calculated in the fully connected layer of the self-designed neural network. Compared with the cross-entropy function in one-hot encoding, the soft label-based classification of face orientations is suitable to adopt Kullback–Leibler (KL) divergence as the loss function. The probabilistic distribution of the classes of the face orientation vector [A, B, C] can be computed by:
$K{{L}_{\upsilon }}=\sum\limits_{k=1}^{K}{\upsilon _{s}^{c}\log \left( \frac{\upsilon _{s}^{c}}{\eta _{\upsilon }^{c}} \right)},\upsilon \in \left[ A,B,C \right]$ (11)
where, υks is the coordinate value of the soft label for image sample [A, B, C] corresponding to the k-th class; ηkτ is the coordinate value of the softmax layer output for image sample [A, B, C] corresponding to the k-th class.
In the proposed neural network, the softmax layer outputs the probability of the face orientation in each sample belonging to each class. Due to the small posture difference between adjacent classes, the output probability is low if the classification is wrong, and high if the classification is correct. Taking the expected output probability as the loss of the actual coordinate value of [A, B, C], the mean squared error (MSE) can be computed by:
$MS{{E}_{\upsilon }}=\frac{1}{Q}{{\sum\limits_{i=1}^{Q}{\left( EXP\left( \eta _{i}^{\upsilon } \right)-{{{{\upsilon }'}}_{i}} \right)}}^{2}},\upsilon \in \left[ A,B,C \right]$ (12)
where, Q is the number of image samples involved in neural network training, EXP(ηυi) is the expected output probability of the softmax layer for image sample [A, B, C]; υ'i is the true coordinate value of the face orientation vector in the i-th image sample.
The loss function of the system model, encompassing classification loss function (11) and regression loss function (12), can be established as:
$Los{{s}_{\upsilon }}=\beta K{{L}_{\upsilon }}+MS{{E}_{\upsilon }},\upsilon \in \left[ A,B,C \right]$ (13)
Drawing on label smoothing and regularization, this paper further optimizes the soft label representing head postures into a probabilistic distribution of postures. First, the yaw angle and the pitch angle were combined into an angle pair θYP, where Y and P are the number of soft labels for the yaw angle and the pitch angle, respectively. The head posture distribution of the image samples can be calculated by:
$\begin{align} & \theta =\frac{F\left( {{\theta }_{YP}} \right)}{\sum\limits_{Y}{\sum\limits_{P}{F\left( {{\theta }_{YP}} \right)}}} \\ & =\frac{\frac{1}{2\pi \sqrt{\left| \Lambda \right|}}\exp \left( -\frac{1}{2}{{\left( {{\theta }_{YP}}-\varepsilon \right)}^{T}}{{\Lambda }^{\text{-}1}}\left( {{\theta }_{YP}}-\varepsilon \right) \right)}{\sum\limits_{Y}{\sum\limits_{P}{\frac{1}{2\pi \sqrt{\left| \Lambda \right|}}\exp \left( -\frac{1}{2}{{\left( {{\theta }_{YP}}-\varepsilon \right)}^{T}}{{\Lambda }^{\text{-}1}}\left( {{\theta }_{YP}}-\varepsilon \right) \right)}}} \\ \end{align}$ (14)
where, Λ is the covariance matrix:
$\Lambda =\left( \begin{matrix} {{\left( \phi \cdot \sigma \right)}^{2}} & 0 \\ 0 & {{\left[ \tau \cdot \left( \phi \cdot \sigma \right) \right]}^{2}} \\\end{matrix} \right)$ (15)
Since the head postures vary between orientations, there exists an inequality [τ×(φ×σ)]2<(φ×σ)2, and the value of element τ falls in [0.5, 1]. The workflow of face direction determination is illustrated in Figure 4.
Due to differences in head posture in different directions, there is an inequality [τ×(φ×σ)]2<(φ×σ)2, and the value range of the element τ is [0.5, 1]. Figure 4 shows the process of determining the student's face orientation.
4.1 Regularization of loss function
Before setting up the HRR detection neural network, the first step is to regularize the MLE loss function. Let IS be the set of input image samples; Label be the set of soft labels, i.e. the probabilistic distributions of head postures.
Figure 4. The workflow of face direction determination
Then, the parameter γ that meets the maximum condition of the posterior probability PP(γ|IS, SL) needs to be searched for continuously:
${{\gamma }^{*}}=argmaxPP\left( IS,SL\left| \gamma \right. \right)$ (16)
Under Bayes’ Theorem, formula (16) can be optimized into:
${{\gamma }^{*}}=\arg \max \left[ PP\left( IS,SL\left| \gamma \right. \right)\cdot PP\left( \gamma \right) \right]$ (17)
Treating the PP(IS, SL), which is independent of (IS, SL) as a constant:
${{\gamma }^{*}}=\arg \max \left( PP\left( IS,SL\left| \gamma \right. \right)\cdot PP\left( \gamma \right) \right)$ (18)
Formula (18) can be written in logarithmic form:
${{\gamma }^{*}}=\arg \max \left( \log PP\left( IS,SL\left| \gamma \right. \right)+\log PP\left( \gamma \right) \right)$ (19)
The neural network aims to further fit the soft labels (probabilistic distributions). Thus, the KL divergence was adopted again to measure the distance between the output of the likelihood density function PP(IS, SL|γ) and the preset value of label O*s:
$PP\left( IS,SL\left| \gamma \right. \right)=\sum\limits_{s}{O_{s}^{{}}\ln \frac{O_{s}^{{}}}{O_{s}^{*}}}$ (20)
Suppose the noises conform to the Gaussian distribution, the prior term PP(γ) can be expressed as:
$PP\left( \gamma \right)=\frac{1}{\sqrt{2\pi }{{\sigma }^{2}}}{{e}^{-\frac{{{\gamma }^{2}}}{2{{\sigma }^{2}}}}}$ (21)
Formula (19) can be optimized into:
${{\gamma }^{*}}=\arg \min \left( \sum\limits_{s}{O_{s}^{{}}\ln \frac{O_{s}^{{}}}{O_{s}^{*}}}+\mu \left\| \gamma \right\|_{2}^{2} \right)$ (22)
The loss function of the probabilistic distribution model for head postures can be redefined as:
$Los{{s}^{*}}=\sum\limits_{s}{O_{s}^{{}}\ln \frac{O_{s}^{{}}}{O_{s}^{*}}}+\mu \left\| \gamma \right\|_{2}^{2}$ (23)
where, μ is the regularization coefficient of L2. To prevent overfitting, the μ value is generally set to 1×10⁻⁴.
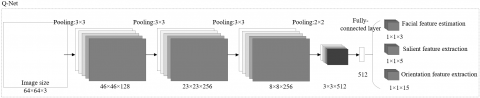
4.2 Structure and workflow of multi-task CNN
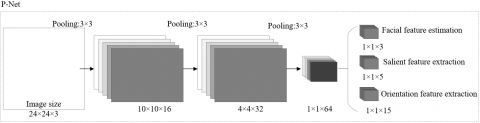
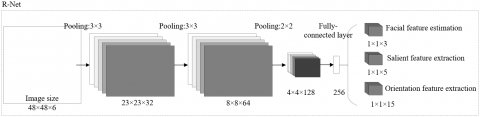
Our neural network is a multi-task CNN composed of a rapid proposal network P-Net, an optimization network R-Net, and an output network O-Net. The structures of P-Net, R-Net, and O-Net are displayed in Figures 5-7, respectively.
Based on the fully CNN structure, the P-Net firstly detects the salient facial features from low resolution to high resolution according to the image pyramid, performs feature matching of face orientation through direct regression, calculates the coordinates of head postures, and completes the continuous search under the constraint of parameter γ by non-maximum suppression.
Based on soft label coding, the R-Net further clarifies the classification range of head postures, computes the classification error of image samples with an additional fully-connected layer, and further optimizes the soft labels into the probabilistic distributions of head postures.
The O-Net adds a pooling layer to the R-Net. This additional layer further refines the salient facial features and orientation features. Unlike the P-Net and R-Net, the O-Net has many supervision links, and outputs 60 salient facial features and 30 kinds of orientation features.
Figure 5. The structure of P-Net
Figure 6. The structure of R-Net
Figure 7. The structure of O-Net
Based on the three networks in the multi-task CNN, the HRR detection can be broken down into three tasks: facial feature estimation, salient feature extraction, and orientation feature extraction (Figure 8).
(1) Facial feature estimation
The learning objective was defined as a binary classification problem between the facial area and the non-facial area. The loss function can be expressed as:
$Loss_{i}^{face}=-O_{i}^{face}\log ({{p}_{face-i}})-(1-O_{i}^{face})[1-\log ({{p}_{face-i}})]$ (24)
where, pface-I is the probability that the predicted result of the neural network is a facial area; Oiface is the classification result with correct class label for the facial area.
(2) Salient feature extraction
Similar to feature matching of face orientations, the matching of facial organs is a direct regression problem. The loss function can be described as the minimum Euclidean loss function:
Loss $_{i}^{\text {significant}}=\left\|O_{i}^{\prime \text {significant }}-O_{i}^{\text {significant}}\right\|_{2}^{2}$ (25)
where, O'isignificant is the coordinate value of a salient facial feature predicted by the neural network; Oisignificant is the coordinate value of a salient feature with correct class label.
(3) Orientation feature extraction
Since the feature matching of facial orientations carries the characteristics of ordinal regression tasks, the training of the network aims to minimize the deviation of the network output from the true value. The loss function can be described as a Euclidean loss function:
Loss $_{i}^{\text {orientation }}=\left\|O_{i}^{\prime \text {orientation }}-O_{i}^{\text {orientation}}\right\|_{2}^{2}$ (26)
where, O'iorientatio is the probabilistic distribution of the classes of facial orientation vectors predicted by the neural network; O'iorientatio is the classification result with correct class label outputted by the neural network.
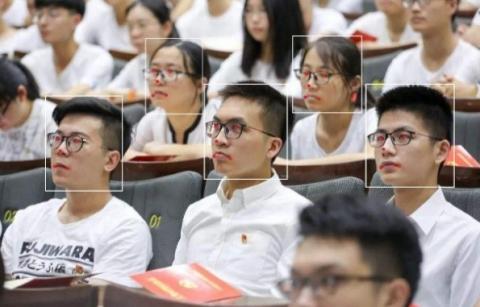
To verify the effectiveness of our neural network in HRR detection, the multi-task CNN was constructed according to Figures 5 and 6, and trained and tested on 12,500 collected images on students in classroom learning. The specific tasks were allocated to the P-Net, R-Net, and O-Net in the multi-task CNN reasonably, and the application effects on facial feature estimation, salient feature extraction, and orientation feature extraction were discussed in details. Figure 9 presents the results of our network in facial feature estimation.
Figure 8. The workflow of the multi-task CNN
Figure 9. The results of our network in facial feature estimation
The positioning rates and accuracies of multiple facial feature estimation methods were compared to demonstrate the effectiveness of our network in facial feature estimation. As shown in Table 1, the constrained local model, which makes use of local textures, outperformed the active appearance model, which is built on global texture statistics. The proposed method for facial feature estimation had a clear edge over the other methods in mean positioning time and positioning accuracy. This verifies the rationality and effectiveness of our method.
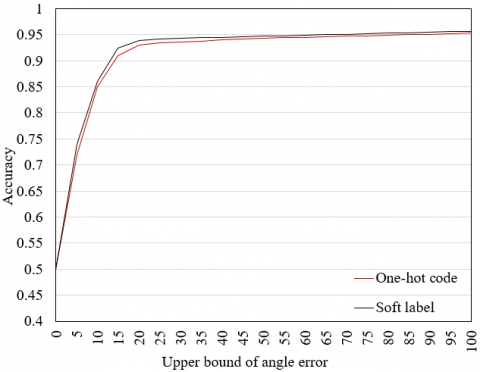
Next, a contrastive experiment was carried out to verify the effectiveness of the proposed method for facial orientation judgement. The cumulative index of angle error can characterize the image samples under the upper bound of the angle error as a proportion of all image samples. Therefore, the generalizability of our method was measured by the cumulative index of the labels corresponding to the head postures (Figure 10). It can be clearly inferred that our method achieved a mean accuracy up to 95% in the recognition of facial orientations under the upper bounds 1-100 of the angle error.
Table 1. The performance comparison between multiple facial feature estimation methods
|
Model |
Mean positioning time |
Accuracy |
|
Active shape model |
1.921s |
92.57% |
|
Active appearance model |
0.698s |
97.43% |
|
Constrained local model |
0.713s |
96.71% |
|
Our network |
0.541s |
99.23% |
Figure 10. The curve of the cumulative index of the labels corresponding to the head postures
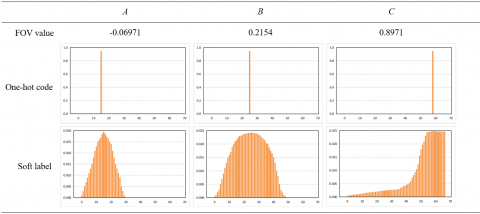
Then, the coordinate values of [A, B, C] in the FOV were divided into 30 kinds, each of which covers 6°. Taking the right deflection as the positive direction of A-axis, upper deflection as the positive direction of B-axis, and forward orientation as the positive direction of C-axis, the probabilistic distributions of FOV values, one-hot codes, and soft labels for head postures were obtained (Figure 11). It can be seen that, unlike one-hot codes, the soft labels had values and approximated normal distribution on all 30 kinds, and characterized sufficient information. The results also show that soft labels carry the characteristics of ordinal regression tasks, and guarantee stable training and fast convergence of the network.
Figure 11. The probabilistic distributions of FOV values, one-hot codes, and soft labels for head postures
To verify the effect of our method in head posture detection, the face orientations detected by different algorithms were compared through experiment. The performance of each algorithm was measured by yaw angle, pitch angle, and comprehensive angle deviation (CAD). The smaller the mean absolute error (MAE), the less significant the detection error, and the more effective the corresponding algorithm. As shown in Table 2, our method outperformed 3D Pose of unconstrained faces (PFA), DLib object detection algorithm, Face alignment depth network (FAN) objection detection algorithm, and Hopenet face matching algorithm, an evidence to its good effect in head posture detection.
Table 2. The performance comparison between face orientation detection methods
|
Method |
Detection error (°) |
MAE (°) |
||||
|
Yaw |
Pitch |
CAD |
Yaw |
Pitch |
CAD |
|
|
3D PFA |
24.17 |
18.17 |
19.17 |
23.88 |
16.25 |
18.49 |
|
DLib |
13.57 |
12.39 |
12.77 |
12.77 |
13.76 |
12.54 |
|
FAN |
12.76 |
13.54 |
12.90 |
11.54 |
15.64 |
13.79 |
|
Hopenet |
10.13 |
13.25 |
12.09 |
12.21 |
13.77 |
12.85 |
|
Our method |
8.21 |
11.09 |
9.17 |
9.45 |
12.10 |
9.61 |
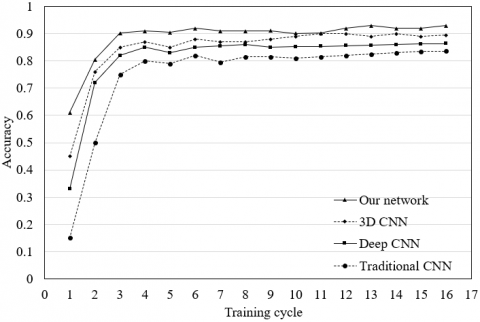
To verify its accuracy in face orientation classification, our neural network was compared with four popular CNNs, namely, traditional CNN, 3D CNN, deep CNN, and deep residual network (DRN), through the training on the set of collected images on students in classroom learning. Figure 12 compares the classification accuracies of different networks on face orientations. Obviously, our network achieved the highest classification accuracy, which was stabilized after six training cycles.
Figure 12. The classification accuracies of different networks on face orientations
Table 3 further compares the classification performances of different neural networks on face orientations. The data in the table manifest the effectiveness and accuracy of our network.
Table 3. The classification performances of different networks on face orientations
|
Network |
Precision |
Recall |
F-score |
MSE |
|
Traditional CNN |
0.809 |
0.794 |
0.811 |
0.0143 |
|
3D CNN |
0.847 |
0.831 |
0.849 |
0.0102 |
|
Deep CNN |
0.841 |
0.857 |
0.865 |
0.0079 |
|
DRN |
0.858 |
0.865 |
0.859 |
0.0065 |
|
Our network |
0.927 |
0.918 |
0.921 |
0.0023 |
This paper mainly designs a novel method to detect the HRR of students in classroom, based on head posture recognition. Firstly, the salient facial features were extracted. By plotting the FFPM, the model matching was realized between facial contours and facial organs. Then, the face orientations were determined based on soft label coding, and the probabilistic distribution of head postures was optimized step by step. Finally, a multi-task CNN was constructed for the HRR detection, the loss function was regularized, and the three tasks were implemented in turn, namely, facial feature estimation, salient feature extraction, and orientation feature extraction. Experimental results show that our method has a clear edge over the other methods in facial feature estimation, and a much higher accuracy in the classification of face orientations.
[1] Freire, P.G., Ferrari, R.J. (2016). Automatic iterative segmentation of multiple sclerosis lesions using Student's t mixture models and probabilistic anatomical atlases in FLAIR images. Computers in Biology and Medicine, 73: 10-23. https://doi.org/10.1016/j.compbiomed.2016.03.025
[2] Tadesse, G.A., Bent, O., Marcenaro, L., Weldemariam, K., Cavallaro, A. (2020). Privacy-aware human activity recognition from a wearable camera: Highlights from the IEEE video and image processing cup 2019 student competition [SP Competitions]. IEEE Signal Processing Magazine, 37(3): 168-172. https://doi.org/10.1109/MSP.2020.2976158
[3] Bae, J.H., Yeo, D., Yim, J., Kim, N.S., Pyo, C.S., Kim, J. (2020). Densely distilled flow-based knowledge transfer in teacher-student framework for image classification. IEEE Transactions on Image Processing, 29: 5698-5710. https://doi.org/10.1109/TIP.2020.2984362
[4] Mohammadi, A., Afshar, P., Asif, A., Farahani, K., Kirby, J., Oikonomou, A., Plataniotis, K.N. (2018). Lung cancer radiomics: Highlights from the IEEE video and image processing cup 2018 student competition [SP competitions]. IEEE Signal Processing Magazine, 36(1): 164-173. https://doi.org/10.1109/MSP.2018.2877123
[5] Banerjee, A., Maji, P. (2018). Spatially constrained Student’s t-distribution based mixture model for robust image segmentation. Journal of Mathematical Imaging and Vision, 60(3): 355-381. https://doi.org/10.1007/s10851-017-0759-8
[6] Zhu, H., Xie, Q. (2018). Content-based image retrieval using student’s t-mixture model and constrained multiview nonnegative matrix factorization. Multimedia Tools and Applications, 77(11): 14207-14239. https://doi.org/10.1007/s11042-017-5026-x
[7] Temel, D., AlRegib, G. (2018). Traffic signs in the wild: Highlights from the IEEE video and image processing cup 2017 student competition [SP Competitions]. IEEE Signal Processing Magazine, 35(2): 154-161. https://doi.org/10.1109/MSP.2017.2783449
[8] Kong, L., Zhang, H., Zheng, Y., Chen, Y., Zhu, J., Wu, Q.M.J. (2017). Image segmentation using a hierarchical student's-t mixture model. IET Image Processing, 11(11): 1094-1102. https://doi.org/10.1049/iet-ipr.2017.0407
[9] Farhan, M., Aslam, M., Jabbar, S., Khalid, S., Kim, M. (2017). Real-time imaging-based assessment model for improving teaching performance and student experience in e-learning. Journal of Real-Time Image Processing, 13(3): 491-504. https://doi.org/10.1007/s11554-016-0662-3
[10] Lahmiri, S. (2015). Image denoising in bidimensional empirical mode decomposition domain: the role of Student's probability distribution function. Healthcare Technology Letters, 3(1): 67-71. https://doi.org/10.1049/htl.2015.0007
[11] Salzmann-Erikson, M., Eriksson, H. (2018). PhD students' presenting, staging and announcing their educational status-An analysis of shared images in social media. Computers & Education, 116: 237-243. https://doi.org/10.1016/j.compedu.2017.09.012
[12] Petr, J., Maier, V., Horáková, J., Ševcík, J., Stránský, Z. (2006). Capillary isotachophoresis from the student point of view–images and the reality. Journal of Separation Science, 29(18): 2705-2715. https://doi.org/10.1002/jssc.200600249
[13] Ginsberg, J.H. (2012). On the use of the method of wave images to introduce students to acoustics. The Journal of the Acoustical Society of America, 131(3): 2543-2550. https://doi.org/10.1121/1.3676721
[14] Jung, M.S., Shin, D.W., Lim, D.W. (2020). Development of a forward head posture warning system for pc users by using artificial intelligence algorithms. Journal of Institute of Control, 26(5): 355-362. https://doi.org/10.5302/J.ICROS.2020.19.0230
[15] Rizzuto, M.A., Sonne, M.W., Vignais, N., Keir, P.J. (2019). Evaluation of a virtual reality head mounted display as a tool for posture assessment in digital human modelling software. Applied Ergonomics, 79: 1-8. https://doi.org/10.1016/j.apergo.2019.04.001
[16] Khosravi, F., Peolsson, A., Karimi, N., Rahnama, L. (2019). Scapular upward rotator morphologic characteristics in individuals with and without forward head posture: A case-control study. Journal of Ultrasound in Medicine, 38(2): 337-345. https://doi.org/10.1002/jum.14693
[17] Mao, L., Liu, T., Caracappa, P.F., Lin, H., Gao, Y., Dauer, L.T., Xu, X.G. (2019). Influences of operator head posture and protective eyewear on eye lens doses in interventional radiology: A monte Carlo study. Medical Physics, 46(6): 2744-2751. https://doi.org/10.1002/mp.13528
[18] Bhiwapurkar, M.K., Saran, V.H., Harsha, S.P. (2019). Effects of posture and vibration magnitude on seat to head transmissibility during exposure to fore-and-aft vibration. Journal of Low Frequency Noise, Vibration and Active Control, 38(2): 826-838. https://doi.org/10.1177/1461348418756019
[19] Smulders, M., Naddeo, A., Cappetti, N., van Grondelle, E.D., Schultheis, U., Vink, P. (2019). Neck posture and muscle activity in a reclined business class aircraft seat watching IFE with and without head support. Applied Ergonomics, 79: 25-37. https://doi.org/10.1016/j.apergo.2018.12.014
[20] Lee, J., Kim, D., Yu, K., Cho, Y., You, J.H. (2018). Comparison of isometric cervical flexor and isometric cervical extensor system exercises on patients with neuromuscular imbalance and cervical crossed syndrome associated forward head posture. Bio-Medical Materials and Engineering, 29(3): 289-298. https://doi.org/10.3233/BME-181728
[21] Howie, E.K., Coenen, P., Campbell, A.C., Ranelli, S., Straker, L.M. (2017). Head, trunk and arm posture amplitude and variation, muscle activity, sedentariness and physical activity of 3 to 5 year-old children during tablet computer use compared to television watching and toy play. Applied Ergonomics, 65: 41-50. https://doi.org/10.1016/j.apergo.2017.05.011
[22] Douglas, E.C., Gallagher, K.M. (2017). The influence of a semi-reclined seated posture on head and neck kinematics and muscle activity while reading a tablet computer. Applied Ergonomics, 60: 342-347. https://doi.org/10.1016/j.apergo.2016.12.013
[23] Velasco, M.A., Raya, R., Muzzioli, L., Morelli, D., Otero, A., Iosa, M., Cincotti, F., Rocon, E. (2017). Evaluation of cervical posture improvement of children with cerebral palsy after physical therapy based on head movements and serious games. BioMedical Engineering OnLine, 16(1): 1-13. https://doi.org/10.1186/s12938-017-0364-5
[24] Gilchrist, I., Moglo, K., Storr, M., Pelland, L. (2016). Effects of head flexion posture on the multidirectional static force capacity of the neck. Clinical Biomechanics, 37: 44-52. https://doi.org/10.1016/j.clinbiomech.2016.05.016
[25] Weidling, P., Jaschinski, W. (2015). The vertical monitor position for presbyopic computer users with progressive lenses: how to reach clear vision and comfortable head posture. Ergonomics, 58(11): 1813-1829. https://doi.org/10.1080/00140139.2015.1035764
[26] Mencarelli, A., Van Beek, S., Zijp, L.J., Rasch, C., Van Herk, M., Sonke, J.J. (2014). Automatic detection system for multiple region of interest registration to account for posture changes in head and neck radiotherapy. Physics in Medicine & Biology, 59(8): 2005. https://doi.org/10.1088/0031-9155/59/8/2005