Xiaohong Xiao | Jiangang Xie | Jiping Niu* | Wei Cao
© 2020 IIETA. This article is published by IIETA and is licensed under the CC BY 4.0 license (http://creativecommons.org/licenses/by/4.0/).
OPEN ACCESS
This paper attempts to design an image fusion method that facilitates the extraction of water bodies from remote sensing images, namely, the images taken by Enhanced Thematic Mapper Plus (ETM+) of Landsat 7 and those taken by Phased Array type L-band Synthetic Aperture Radar (PALSAR) of Advanced Land Observation Satellite (ALOS). Firstly, the water body information was extracted from ETM+ data and PALSAR data, and combined into a benchmark image. Next, several traditional image fusion methods were separately adopted to merge the ETM+453 image and the PALSAR HH image, and the water bodies extracted from the fused images were compared in details. The selected methods include principal component analysis (PCA), Brovey transform (BT), intensity-hue-saturation (IHS) transform, discrete wavelet transform (DWT), and high-pass filter (HPF). After that, a new image fusion method was designed based on optimal band combination (OBC), and the water bodies extracted by the method were compared with the benchmark image and those extracted by the traditional methods. The results show that the ALOS HH image alone achieved higher accuracy in water body extraction than the ETM+ image alone; the traditional image fusion methods, namely, PCA, BT, IHS, HPF and DWT, were more accurate than the ETM+ image alone in water body extraction, and less accurate than the ALOS HH image alone. The OBC-based image fusion method greatly outperformed all the traditional methods. The research results provide a good reference for image fusion and extraction tasks in similar cases.
water body extraction, Enhanced Thematic Mapper Plus (ETM+), Phased Array type L-band Synthetic Aperture Radar (PALSAR), optimal band combination (OBC)
Water, as a primary resource, is of great importance to sustainable development. For the benefits of environment and mankind, the status of water resource must be evaluated accurately. However, it is very difficult, time-consuming, and even impossible to make the evaluation for a large region through traditional ground survey [1].
Remote sensing has long been used in water body extraction, thanks to its convenience, safety, fastness, and cost-effectiveness [2-12]. In most cases, the water bodies are extracted by single-source remote sensing data [13-19]. But the single-source data face many limitations in water body extraction. The same water body may have different imaging features on different remote sensing platforms, which vary in geographical location and imaging mechanism. As a result, single-source data cannot reflect the information of the water bodies in an accurate and complete manner.
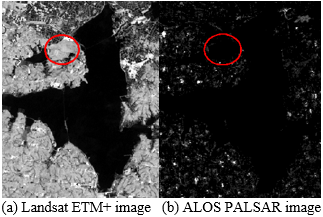
Take Baoan Lake in central China’s Hubei Province for example. Figure 1 provides two remote sensing images on the lake. The left subgraph was taken by Enhanced Thematic Mapper Plus (ETM+) of Landsat 7 on August 19th, 2008, and the right subgraph was shot by Phased Array type L-band Synthetic Aperture Radar (PALSAR) of Advanced Land Observation Satellite (ALOS) on July 3rd, 2008. No water was observed in the red circle of Figure 1(a), while water was clearly observable in the same part of Figure 1(b).
Figure 1. Remote sensing images of Baoan Lake
Comparing the ETM+ image and PALSAR image of the same season, it was found that the ETM+ cannot sense the water area beneath plants and clouds, while PALSAR can penetrate through plants and clouds. But the PALSAR image has lots of holes resulted from speckle noise. Visually speaking, neither images provide an accurate illustration of the water bodies. The lack of accuracy is common in many object remote sensing tasks.
Image fusion is now a hotspot in the field of image processing. As its name suggests, image fusion effectively combines the salient information of the target from different images, providing complete information about the target. In this way, the target could be recognized accurately and reliably [20, 21]. Over the years, image fusion has been extended to various fields, ranging from computer vision, crop growth analysis, to land cover classification.
The existing studies on image fusion mainly focus on the sources, levels, algorithms, effect evaluation, and application fields [22-24]. These studies provide theoretical and technical supports to image fusion applications. The complementarity of different remote sensing images has been proved useful in many specific applications, such as seismic damage assessment [25], runway and horizon detection [26], built-up area identification [27, 28], dryness and evapotranspiration estimation [29], as well as urban classification [30].
On the application of image fusion, the previous research mostly tackles the following issues: land use and land cover classification [31-37], forest mapping [38-40], crop and vegetation identification [41-45], to name but a few. However, there is little report on the use of image fusion in water body extraction. Besides, most studies on the application of image fusion stopped at experimental verification, and integrated data from different sources by fusion algorithms like intensity-hue-saturation (IHS) transform and discrete wavelet transform (DWT). Rarely has any fusion algorithm been designed for specific goals of application. The fusion methods that are theoretically viable might not be suitable for practical applications. This calls for an efficient fusion method that gives full play to the complementarity of multi-source images in specific applications.
Therefore, this paper attempts to achieve three purposes concerning water body extraction: (1) verify whether image fusion is beneficial or detrimental to the accuracy of water body extraction; (2) examine the efficiency of existing image fusion methods in water body extraction; (3) design an image fusion method that combines the merits of water body images from multiple sources, and accurately extracts the water bodies.
For the above purposes, datasets with potentially complementary information were selected for water body extraction. Next, the water body information was extracted from each dataset, forming a benchmark for subsequent comparison. After that, several image fusion methods were separately adopted to merge the selected datasets, and the water bodies were extracted from the fused images. Finally, a new image fusion method was designed based on optimal band combination (OBC), and used to combined two types of datasets. The accuracy of our method in water body extraction was proved through comparative analysis.
The remainder of this paper is organized as follows: Section 2 introduces the study area, data, and method of this research; Section 3 extracts water body information from Landsat 7 ETM+ data and ALOS PALSAR data, respectively, and builds a benchmark based on the extracted results; Section 4 compares the water body extraction results of several image fusion methods; Section 5 develops the OBC-based image fusion method for Landsat ETM+ data and ALOS PALSAR data; Section 6 compares our method with the other methods in water body extraction; Section 7 puts forward the conclusions.
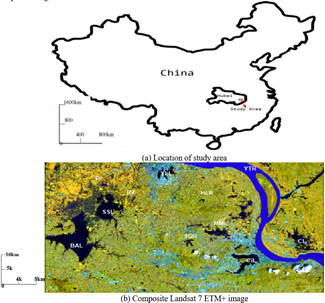
2.1 Study area
The 157,380-hectare study area lies in the southeast of central China’s Hubei Province. With a monsoon-influenced humid subtropical climate, the study area has an annual maximum rainfall of 1,600mm. Each year can be clearly divided into a dry season (October to next February) and a wet season (March to September). This area was selected partially due to the abundance of water resource in Hubei Province.
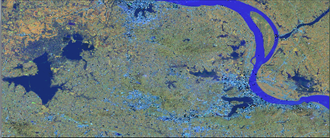
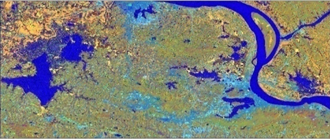
Figure 2 presents a composite image of bands 4, 5, and 3 of Landsat 7 ETM+ images taken on August 19, 2008. The image contains various surface objects, including but not limited to buildings, farmlands, mountains, and water bodies. The lakes and the Yangtze River are quite legible on the composite image. However, small water bodies (e.g. ponds and small rivers) cannot be distinguished easily from the surroundings. Since the images were taken in summer, a large area of water bodies are covered by lotus and other plants, and thus not observable on the composite image.
Figure 2. The study area
Note: BAL- Baoan Lake; CL- Chaohu Lake; HML- Huama Lake; YLL-Yanlan Lake; SSL-Sanshan Lake; HLR- Huanglong Reservoir; SQR- Shiqiao Reservoir; CiL-Cihu Lake; YTR- Yangtze River; R1-River 1; R2-River 2.
2.2 Data
2.2.1 Data selection
The source data have a great impact on the result of water body extraction. Many factors should be considered in data selection: imaging mechanism, data availability, previous work, regional features, etc. This paper selects the source images based on two factors: previous work and imaging features.
(1) Previous work
In previous work on remote sensing, most image fusion tools target images captured by multispectral imager (MSI), a passive imaging system, and synthetic aperture radar (SAR), an active imaging system. The empirical results show that the fusion of the two types of images indeed has advantages in applications like resource monitoring, environmental protection, and disaster investigation [46-55]. The features not observed in the MSI image can be found in the SAR image, and the inverse is also true [56-58]. Some scholars have proved that the fusion between MSI and SAR images can improve the classification accuracy in water body extraction [59, 60].
(2) Imaging features
The MSI operates similarly to the human eyes. The imaging mechanism of the MSI is easy to understand and apply to specific problems. There are multiple bands of the MSI. For the same object, its appearance and color on the MSI image vary with the band combinations. Thus, the MSI images provide multiple viewing angles and high recognizability, facilitating the classification of features. In addition, the MSI is prone to noise disturbance, which ensures the image integrity.
However, every silver lining has a cloud. The MSI performance depends heavily on the weather, especially on the presence or absence of clouds. In MSI images, the same object many have different spectra, and the same spectrum may correspond to different objects. In other words, different objects with similar spectral features are often indistinguishable, such as water bodies, mountain shadows, and cloud shadows. Furthermore, the water area covered by plants cannot be captured by the MSI.
By contrast, the SAR is an active imaging system with its own energy source. Thus, the SAR images are not affected by weather. Compared with the MSI images, the SAR images boast a high resolution, as the SAR is sensitive to moisture, even if it is covered by plants. The main drawback of the SAR is the inability to remove speckle noise [61], which inevitably affects the integrity of the extraction result.
2.2.2 Selected data
Based on the previous work and imaging features, this paper chooses Landsat 7 ETM+ images and ALOS PALSAR images as the source data, for these two types of images provide complementary information in water body extraction.
(1) Landsat 7 ETM+ data
The ETM+ is a multispectral scanner that passively senses the surface reflection of solar radiation and heat radiation of the earth. There are eight band sensors in the ETM+, covering the wavelengths from infrared to visible light. The ETM+ has a better resolution in the infrared band than the thematic mappers (TMs) on Landsat 4 and Landsat 5. Therefore, Landsat 7 outperforms Landsat 4 and Landsat 5 in the accuracy of feature identification.
As shown in Table 1, the image (Path 122, Row 39) taken on August 18, 2008 was collected and processed for this research. The image is 170km (106 miles) in the north-south direction and 183km (114 miles) in the east-west direction.
Table 1. The Landsat 7 ETM+ image (path/row: 122/39)
|
Date |
Sensor |
Cloud coverage (%) |
|
20080819 |
ETM+(SLC-off) |
5.35 |
Table 2. The bands of Landsat 7 ETM+
|
No. |
Band/Frequency (μm) |
Ground resolution (m) |
|
1 |
B: 0.45~0.52 |
30m |
|
2 |
G: 0.52~0.60 |
30m |
|
3 |
R: 0.63~0.69 |
30m |
|
4 |
NIR: 0.76~0.90 |
30m |
|
5 |
SWIR: 1.55~1.75 |
30m |
|
6 |
TIR: 10.4~12.5 |
60m |
|
7 |
SWIR: 2.08~2.35 |
30m |
|
8 |
PAN: 0.52~0.90 |
15m |
As shown in Table 2, different bands of the ETM+ record different reflection information. In the light of the actual situation, band 4 (NIR), band 5 (SWIR), and band 3 (R) were selected to be fused with ALOS PALSAR image. The three bands were collectively referred to as EMT+453.
(2) ALOS PALSAR data
PALSAR is the L-band synthetic aperture radar on the ALOS satellite. The radar supports all-weather observation. The PALSAR image collected by the HH channel contains more layers and information than the HV channel, for the former channel is more penetrable than the latter. Therefore, the PALSAR HH image taken on July 3, 2018 was selected for further fusion (Table 3).
Table 3. The ALOS PALSAR data
|
Track/Frame |
Date |
Mode |
Resolution |
|
454/590 |
20080703 |
FBD(HH/HV) |
12.5m |
(3) Other data
The data of the Digital Elevation Model (DEM) of Wuhan were selected for terrain correction of PALSAR HH data and for registration with Landsat 7 ETM+ data. The extraction accuracy was registered and evaluated by the ground truth data from Crustal Movement Observation Network of China (CMONOC) and the GPS points of the study area.
The topographic maps of the study area were scanned into digital files, and the geographic coordinates were referenced to a common projection and coordinate system (WGS84, UTM 50N). These data were used in image classification to identify the appropriate calibration and verification sites.
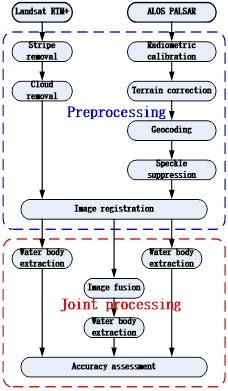
2.3 Methodology
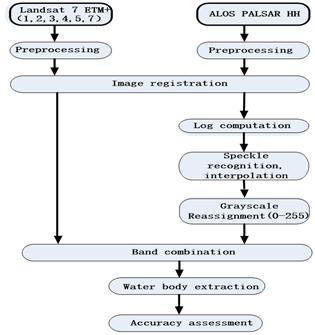
Figure 3. The workflow of this research
As shown in Figure 3, this research is carried out in the following steps:
Step 1. Preprocess Landsat 7 ETM+ data, including stripe removal and cloud removal.
Step 2. Preprocess PALSAR HH data, including radiometric calibration, terrain correction, geocoding, and speckle suppression.
Step 3. Registrant ETM+453 and PALSAR HH images.
Step 4. Extract water bodies from ETM+453 and PALSAR HH images, respectively, and generate a benchmark based on the extraction results.
Step 5. Compare the water body extraction results of traditional image fusion methods, namely, HIS, DWT, principal component analysis (PCA), high-pass filter (HPF), and Brovey transform (BT).
Step 6. Design and test a new image fusion method.
Step 7. Compare the accuracy of different methods in water body extraction.
2.3.1 Preprocessing of Landsat ETM+ data
The Landsat 7 ETM+ image was downloaded from Geospatial Data Cloud (http://datamirror.csdb.cn/). The stripes of the downloaded image were removed successfully, using the multi-image adaptive local regression (MIALR) tool provided by the website. Based on various satellite images on the same region, the MIALR method fills the gaps in the target image through local regression of the region with the maximum correlation and the minimum local area. The MIALR can effectively remove speckles, despite its high time consumption.
About 5.35% of the original image was covered by clouds, which may affect the extraction of water bodies. Hence, both clouds and cloud shadows were removed through the local index-based method proposed by Xiao et al. [62].
2.3.2 Preprocessing of ALOS PALSAR data
The ALOS PALSAR image, provided by the Alaska Satellite Facility (ASF), was on the Level 1.5 and could not be used directly. Therefore, the image was preprocessed by the ASF MapReady 3.0 software. The preprocessing operations include radiation correction using Sigma calibration coefficients, terrain correction based on Wuhan DEM information, terrain normalization, and geocoding to 30m pixel resolution (WGS84, UTM 50N).
The speckles on the ALOS PALSAR image greatly affect the image quality and the evaluation of image classification. To solve the problem, the original image was speckle suppressed by a gamma maximum-a-posteriori (GM) filter [63] before image fusion for water body extraction.
2.3.3 Image registration
Registration is a key step in the fusion of remote sensing images [64]. Since Landsat 7 ETM+ image and ALOS PALSAR image were taken by imaging systems with different sizes and resolutions, image resolution must be performed before image fusion.
If the registration effect is poor, the fused dataset will have a nominal spatial resolution, which is worse than any of the two input images. Ideally, the registration should be pixel to pixel for systems with the same spatial resolution, but pixel-to-pixel registration is basically impossible.
Here, 12 ground control points (GCPs) in the study area are employed to correct the ALOS PALSAR image to the Landsat 7 ETM+ coordinate system, using second-order transform and the nearest neighbor difference. The final root mean square error (RMSE) was 0.5 pixels.
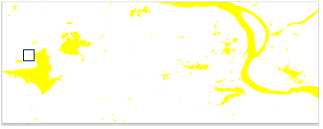
3.1 Water body extraction of EMT+453
The ETM+453 image was taken in August during the rainy season. Due to the high precipitation, the water bodies in the study area were large, and the tributaries and small rivers were clearly visible. However, some water bodies, e.g. Baoan Lake and Huama Lake, were partially covered with lotus, and thus not observable in the EMT+453 image. Hence, the water bodies were extracted by maximum likelihood classification (MLC). The extraction result and accuracy are given in Figure 4 (yellow) and Table 4, respectively.
Figure 4. The water bodies extracted from the ETM+453 image
Table 4. Accuracy of water body extraction from the ETM+453 image
|
|
Extracted points |
Nonextracted points |
Total points |
Accuracy (%) |
|
water |
424 |
76 |
500 |
84.8 |
3.2 Water body extraction of PALSAR HH image
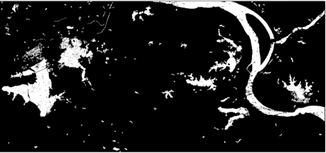
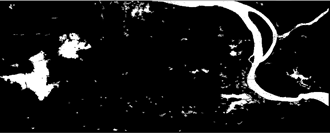
From the PALSAR HH image, the water bodies were extracted directly through single-band thresholding. The extraction result and accuracy are given in Figure 5 (yellow) and Table 5, respectively.
Figure 5. The water bodies extracted from the PALSAR HH image
Table 5. Accuracy of water body extraction from the PALSAR HH image
|
|
Extracted points |
Nonextracted points |
Total points |
Accuracy (%) |
|
water |
467 |
33 |
500 |
93.4% |
The high resolution (12.5m) of PALSAR HH enables the differentiation of complex small objects like ponds and small rivers from other features. In addition, the L-band and multi-polarization modes of PALSAR enhance the distinction between surface objects than the ETM+, and penetrate through plant covers on water bodies. As shown in Figure 5, the water areas covered by lotus in Baoan Lake and Huama Lake were successfully extracted. However, the extracted areas had some holes, due to the presence of speckles. As shown in Table 5, the water bodies extracted from PALSAR HH image were more accurate than those extracted from ETM+453.
3.3 Benchmark
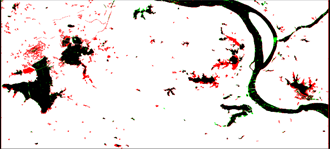
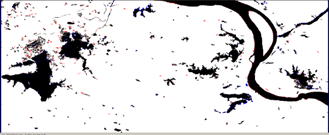
Figure 6 combines the water bodies extracted from the ETM+453 image and the PALSAR HH image. Since both images were taken within a short interval in summer, it is assumed that the water bodies did not change, owing to human activities or natural disasters. The water bodies only extracted from the PALSAR HH image are in red, those only extracted from the ETM+453 are in green, and those extracted from both images are in black. The extremely small water bodies were neglected. Obviously, more water bodies were extracted from the PALSAR HH image, such as the ponds in the north of Baoan Lake, two small rivers, and the lotus-covered areas in Baoan Lake and Huama Lake. The combined image carries the information from both source images, and was thus adopted as a benchmark for comparative analysis. The water bodies extracted from the two source images are compared in Table 6.
Figure 6. The benchmark for comparative analysis
Table 6. Comparison between the water bodies extracted from the two source images
|
|
Color |
Extracted water area (ha) |
Percentage of total area (%) |
|
ETM+453 |
green |
15,710.76 |
9.98 |
|
PALSAR HH |
red |
19,496.34 |
12.39 |
|
Overlapping area |
black |
14,720.22 |
9.35 |
|
Benchmark |
|
20,486.88 |
13.02 |
|
Total area |
157,380.57 |
||
This section fuses the two source images in turn by several traditional image fusion methods, and uses the fused images to extract water bodies. The image fusion methods include the PCA [65], BT [66], HPF [67], IHS [68], and DWT [69]. For comparison, the fuse images were all classified by the MLC.
4.1 PCA image fusion
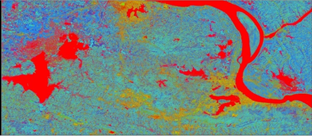
The ETM+453 image was taken as the multispectral input file, and PALSAR HH image was regarded as the high-resolution input file. Then, the PCA was performed on the ETM+453 image to generate three principal components. The first principal component was replaced by the PALSAR HH image. After the replacement, the three principal components were inversely transformed to create a fused image (Figure 7). The water bodies extracted from the fused image are displayed in Figure 8. As shown in Figures 7 and 8, more water bodies of the PALSAR HH image were retained than those of the ETM+453, thanks to the replacement of the first principal component with the high-resolution PALSAR HH image. The lotus area in Baoan Lake was visible, while the speckles in PALSAR image were also kept.
The main defect of PCA image fusion is that the PCA only considers statistical features, but not the features of each band. In terms of performance, the PCA works as if it selects between the source images, rather than fuse the salient information of source images. During the fusion process, the PCA measures information saliency by global variance, and tends to assign a high weight to the source image with large variance. The weighting strategy is not scientific. Besides, the PCA is highly sensitive to interference information like dead pixels and noises. In the presence of interference information, the global variance of the image will surge up. That is why far more information from the PALSAR HH image was included in the fused image than that from the ETM+453 image. In actual fusion, the PCA has better effect if the source images are of low contrast.
Figure 7. The image fused by the PCA
Figure 8. The water bodies extracted from the PCA fused image
4.2 BT image fusion
To enhance image information, the BT first normalizes each band in the ETM+453 image, and then multiplies the normalized results with the PALSAR HH image. The red (R), green (G), and blue (B) of the fused image can be respectively computed by:
$R=\frac{T M 4}{(T M 4+T M 5+T M 3)} * H H$ (1)
$G=\frac{T M 5}{(T M 4+T M 5+T M 3)} * H H$ (2)
$B=\frac{T M 3}{(T M 4+T M 5+T M 3)}^{*} H H$ (3)
where, TMi/(TM4+TM5+TM3) is the spectral information of the image; HH is the spatial information of the image.
The image fused by the BT and the water bodies extracted from the BT fused image are presented in Figures 9 and 10, respectively. Like the PCA, the BT introduces too much information of the PALSAR HH into the fused image. Besides the lotus area, both speckles and small water bodies were retained.
Figure 9. The image fused by the BT
Figure 10. The water bodies extracted from the BT fused image
4.3 IHS image fusion
The ETM+453 image was transformed into the IHS space to produce I, H, and S components. Then, the I component was replaced by the PALSAR HH image. After that, the three components were inversely transformed to the RGB space. The image fused by the IHS and the water bodies extracted from the IHS fused image are presented in Figures 11 and 12, respectively.
As shown in Figures 11 and 12, there was no speckle in the fused image, but the lotus-covered areas in Baoan Lake and Huama Lake were not extracted. This means the spectral information of the ETM+453 image plays a dominant role in the classification process.
Figure 11. The image fused by the HIS
Figure 12. The water bodies extracted from the IHS fused image
4.4 HPF image fusion
The HPF image fusion involves the following steps: The HPF of the PALSAR HH image to extract the high-frquency information (e.g. linear features and edge features); the low-pass filtering (LPF) of the ETM+453 image to extract low-frequency information (i.e. spectral information); the weighted summation of the extracted high-frequency and low-frequency information to create a sharpened fused image. The HPF transform can be defined as:
$H P_{i}=\left(w_{a} * M S I_{i L P}\right)+\left(w_{b} * H H_{i H P}\right)$ (4)
Figure 13. The image fused by the HPF with high weight coefficient
Figure 14. The water bodies extracted from the HPF fused image with high weight coefficient
Figure 15. The image fused by the HPF with low weight coefficient
Figure 16. The water bodies extracted from the HPF fused image with low weight coefficient
The weight of the ETM+453 in the fused image is defined as the weight coefficient. The weight coefficient is positively corelated with the sharpness of the fused image, and negatively with the smoothness of the fused image. Figures 13 and 14 are the image fused by the HPF and the water bodies extracted from the HPF fused image at a high weight coefficient (>0.6), respectively; Figures 15 and 16 are the image fused by the HPF and the water bodies extracted from HPF fused image at a low weight coefficient (<0.5), respectively.
For the PALSAR HH image, the grayscales of speckles are much larger than those of water. Therefore, the speckle information was preserved and the water information was not well preserved after the HPF. Under a high weight coefficient, the speckle information was inevitably enhanced in the fused image, bringing more noises. By contrast, the water body information was not preserved well, and the plant-covered areas in Baoan Lake and Huama Lake were not retained.
Under a low weight coefficient, the speckles in the PALSAR HH image were suppressed and smoothed, but the water body information in that image were more severely suppressed. Therefore, more water body information of the ETM+453 image was retained. The plant-covered areas in Baoan Lake and Huama Lake were not retained, and some small water bodies were gone.
4.5 DWT image fusion
Using the db4 wavelet function, the ETM+453 and PALSAR HH images were decomposed by three-layer DWT. For the approximate coefficients, the fusion rule based on average wavelet coefficients was adopted; for the detail coefficients, the rule of obtaining maximum variance of a local moving window (3×3) was employed. The image fused by the DWT and the water bodies extracted from the DWT fused image are presented in Figures 17 and 18, respectively. It can be seen that the water bodies were not satisfactorily extracted: the lotus-covered water areas, small rivers, and reservoir were all lost.
Figure 17. The image fused by the DWT
Figure 18. The water bodies extracted from the DWT fused image
4.6 Comparison of traditional fusion methods
Table 7 compares the water body areas in the images fused by the traditional fusion methods, and Table 8 compares the extraction accuracies of these methods.
Table 7. The water body areas in the images fused by the traditional fusion methods
|
Fusion scheme |
Extracted water pixels |
Extracted water area (ha) |
Percentage of total area (%) |
|
PCA |
199734 |
17,976.06 |
11.42 |
|
Brovey |
202040 |
18.183.60 |
11.55 |
|
IHS |
200443 |
18,039.87 |
11.46 |
|
HPF_hw |
173316 |
15,598.44 |
9.91 |
|
HPF_lw |
189570 |
17,061.30 |
10.84 |
|
DWT |
183849 |
16,546.41 |
10.51 |
|
Total pixels |
1748673 |
Total area |
157,380.57(ha) |
Table 8. The accuracies of the traditional fusion methods in water body extraction
|
Fusion scheme |
Extracted points |
Nonextracted points |
Accuracy (%) |
|
PCA |
463 |
37 |
92.6 |
|
Brovey |
465 |
35 |
93.0 |
|
IHS |
464 |
36 |
92.8 |
|
HPF_hw |
421 |
79 |
84.2 |
|
HPF_lw |
457 |
43 |
91.4 |
|
DWT |
456 |
44 |
91.2 |
From Tables 7 and 8, it can be seen that the BT achieved the best effect in water body area and extraction accuracy, followed by the IHS and PCA. Except HPF image fusion with a high weight vector, the other fusion methods all outperformed the ETM+453 image alone in water body extraction, and all overshadowed by the PALSAR HH image alone (accuracy: 93.4%). The results show that most fusion methods can improve the water body extraction of Landsat 7 ETM+ image, but cannot improve that of ALOS PALSAR image.
Compared with the benchmark, all the traditional fusion schemes are not satisfactory in visual effect and accuracy, failing to fuse the complementary water information of the two source images. Based on the global information of the entire image, some of the fusion methods overemphasize on the Landsat 7 ETM+ image, and some overemphasize on the ALOS PALSAR image. These theoretical methods mainly evaluate the fusion result based on the spectral preservation of the whole image, the information entropy, the degree of distortion, etc. None of them considers the requirement of a specific recognition task. For specific applications like water body extraction, the image fusion methods completely ignore the salient information of water in both source images. As a result, the image fusion does little good to water body extraction. Therefore, it is necessary to design a fusion method that combine the complementary information of multi-source images for specific recognition tasks.
5.1 OBC-based image fusion
Through analysis, it was found that the water pixels in the PALSAR HH image were far smaller than those in the ETM+453 image, while the values of the speckles in that image were very high. The speckles will be introduced to the fused image, if the weight vector of the PALSAR HH image is increased to highlight the water information; the salient water information of small water bodies and lotus-covered water areas in the PALSAR HH image will be suppressed, if the weight vector of the ETM+453 image is increased. The common water areas or large water areas (e.g. large lakes and the Yangtze River) will not be affected by the weight vector of either image.
Figure 19. The workflow of the OBC-based image fusion
Table 9. The grayscale range of the PALSAR HH image
|
Min |
Max |
Mean |
Median |
|
0.0010004 |
22.202 |
0.107 |
0.0010004 |
For water body extraction, the fusion between the Landsat ETM+453 and PALSAR HH images should maintain the integrity of the ETM+453 image, and highlight the small water bodies and the lotus-covered water areas in the PALSAR HH image, while suppressing the speckles in the latter image. These goals cannot be achieved easily by the traditional image fusion methods. Here, the bands of the ETM+453 image and the PALSAR HH band are observed to find the OBC. Band6 of the ETM+ was discarded due to its coarse resolution. The workflow of the OBC-based image fusion is explained in Figure 19. Specifically, band 1 was superimposed to bands 5 and 7 of Landsat 7 ETM+ and PALSAR HH, and the spectral features were analyzed in details. The analysis shows that the grayscales of the PALSAR HH were much smaller than those of each band of Landsat 7 ETM+. After the HH was geo-recoded, its gray values became very small. The grayscale range of PALSAR HH image is given in Table 9, where the pixel values far below 1 are of water bodies, and those above 1 are of speckles and buildings.
In the PALSAR HH image, the pixel values of the water bodies are much lower than those of the speckles. In the fusion process, if more weight is given to the PALSAR HH image, the speckles will be introduced into the fused image. The good practice is to find out the pixels with high values (speckles or buildings) in the PALSAR HH image, and replace them by interpolation, making them consistent with the surroundings. Then, the pixel values of the HH is reassigned between 0-255, which is the grayscale range of the Landsat 7 ETM+ image.
After the above treatment, the HH band was superimposed with the bands of the ETM+ image to draw a spectral curve. To highlight the ponds and the lotus-covered water areas in the HH band, the values of the HH band in these places must be greater than the values of the selected ETM+ bands, such that the information from the HH band has the dominance. To suppress the speckles, the values of the ETM+ bands in speckled areas should be greater than those of the HH band, allowing the speckles to be replaced by the corresponding pixels of the ETM+ image.
Figure 20 shows the spectral curves of the bands of the fused image (b123457hh). For ponds, the pixel values of the HH band were much higher than those of the ETM+ bands, which helps to highlight the ponds. For lotus-covered water areas, the pixel values of the ETM+ image were close to those of the HH band, failing to highlight the advantage of the HH band in the extraction of such areas. Since bands 3 and 7 had the lowest pixel values, the pixel values of the HH band should be increased properly to surpass those of bands 3 and 7, without affecting ponds and speckles. Then, the combination of band 3, band 7 and modified HH may achieve the desired effects.
The spectral curves of ETM+ bands and modified HH band are displayed in Figure 21. After the modification of the HH band, the grayscales of the ponds were much higher than those of the other bands; the grayscales of speckles were slightly higher than those of band 7 but smaller than those of other bands. For lotus-covered water areas, the pixel values of the HH bands were higher than those of bands 3 and 7. Therefore, the combination of band 3, band 7 and modified HH can highlight the ponds and lotus-covered water areas in the PALSAR HH image, while suppressing the speckles of the HH.
Figure 20. The spectral curves of ETM+ bands and HH band
Figure 21. The spectral curves of ETM+ bands and modified HH band
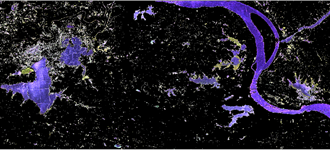
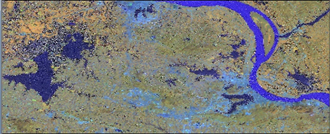
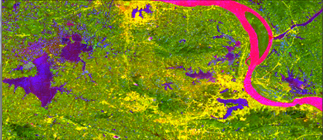
Figure 22 is the fused image of band 3, band 7 and modified HH (B37HH). It can be seen that the complementary information of the two source images were effectively integrated. All water bodies were highlighted in different colors, making them distinctive from other features.
Figure 22. The fused image of band 3, band 7 and modified HH (B37HH)
5.2 Water body extraction by the OBC-based image fusion method
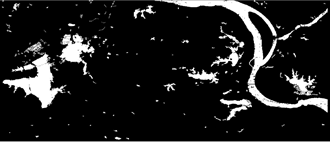
Figure 23 shows the water bodies extracted by the B37HH combination using the MLC. Figure 24 compares the extracted water bodies with the benchmark image. Obviously, the B37HH fusion image is almost identical to the benchmark, with a slightly higher brightness.
Figure 23. The water bodies extracted by the B37HH combination using the MLC
Figure 24. The comparison between the extracted water bodies with the benchmark image
Table 10 compares the water bodies extracted by B37HH with those in the benchmark image. It can be seen that our method extracted basically the same percentage (13.02%) of water bodies as the benchmark, and achieved an extraction accuracy of 97.2%. The accuracy is way higher than that by any single source image, or by traditional image fusion methods.
Table 10. The comparison between the water bodies extracted by B37HH and those in the benchmark image
|
Image |
Color |
Extracted water area(ha) |
Percentage of total area (%) |
|
B37HH |
red |
20,491.74 |
13.02 |
|
benchmark |
green |
20,486.88 |
13.02 |
Table 11 compares the water body extraction results of different methods, and Figure 25 describes the results in line charts. From Table 11 and Figure 25, it can be concluded that:
(1) The extraction accuracy is proportional to the size of extracted water bodies: the higher the accuracy, the greater the area of the extracted water bodies as a percentage of the total area of water bodies in the study area.
(2) Our method, i.e. the OBC-based image fusion, achieved the highest extraction accuracy (97.2%), followed by the PALSAR HH and then several traditional methods. The lowest accuracy belongs to the water body extraction from Landsat 7 ETM+ image alone.
(3) For single-source image methods, the ALOS PALSAR image had a higher accuracy than the Landsat ETM+ image. The former enjoys great advantages in extracting small water bodies and water areas covered by plants. But the water area extracted from the ALOS PALSAR image alone had some holes, due to the presence of speckles. Meanwhile, the extraction from Landsat ETM+ alone cannot detect the lotus-covered water areas or small water bodies, resulting in a very low accuracy.
(4) The traditional image fusion methods were lower than the PALSAR HH image alone in the extraction accuracy. The accuracy of the HPF image fusion with a high weight vector was even below that of the Landsat ETM+ image alone. Thus, it is very important to choose a proper fusion method for a specific task. The complementary information of each source image must be considered during the image fusion. Our image fusion method fully considers the complementary information of the two source images, and thus achieves high accuracy in water body extraction.
Table 11. The area and accuracy of water bodies extracted by different methods
|
Scheme |
Extracted points |
Nonextracted points |
accuracy (%) |
Extracted area(ha) |
Percentage of total area (%) |
|
ETM+(20080819) |
424 |
76 |
84.8 |
15710.76 |
9.98 |
|
ALOS HH(20080703) |
467 |
33 |
93.4 |
19,496.34 |
12.39 |
|
PCA |
463 |
37 |
92.6 |
17,976.06 |
11.42 |
|
BT |
465 |
35 |
93 |
18.183.60 |
11.55 |
|
HIS |
464 |
36 |
92.8 |
18,039.87 |
11.46 |
|
HPF_hw |
421 |
79 |
84.2 |
15,598.44 |
9.91 |
|
HPF_lw |
457 |
43 |
91.4 |
17,061.30 |
10.84 |
|
DWT |
456 |
44 |
91.2 |
16,546.41 |
10.51 |
|
OBC(B37HH) |
486 |
14 |
97.2 |
20,491.74 |
13.02 |
|
Benchmark |
484 |
16 |
96.8 |
20,486.88 |
13.02 |
|
Total area |
157,380.57 |
||||
Figure 25. The line charts of the area and accuracy of water bodies extracted by different methods
This paper designs an OBC-based image fusion method for the exaction of water bodies from remote sensing images. The proposed method was proved better than traditional image fusion methods. There are several important findings through our research. First, single-source images are not sufficient for water body extraction, due to their limitations. Second, traditional image fusion methods outshine the ETM+ image alone in water body extraction, but are overshadowed by the PALSAL image alone. Third, it is very important to choose a proper fusion method for a specific task like water body extraction. The complementary information of each source image must be considered during the image fusion. The research results provide a good reference for image fusion and extraction tasks in similar cases.
This work was supported in part by the Talent Plan of the Open University of Guangdong (Project funding No: RC1918).
[1] Bagli, S., Soille, P. (2003). Morphological automatic extraction of Pan-European coastline from Landsat ETM+ images. In International Symposium on GIS and Computer Cartography for Coastal Zone Management, 256-269. https://doi.org/10.1.1.549.5422
[2] Rishikeshan, C.A., Ramesh, H. (2018). An automated mathematical morphology driven algorithm for water body extraction from remotely sensed images. ISPRS Journal of Photogrammetry and Remote Sensing, 146: 11-21. https://doi.org/10.1016/j.isprsjprs.2018.08.014
[3] Liao, H.Y., Wen, T.H. (2020). Extracting urban water bodies from high-resolution radar images: Measuring the urban surface morphology to control for radar’s double-bounce effect. International Journal of Applied Earth Observation and Geoinformation, 85: 102003. https://doi.org/10.1016/j.jag.2019.102003
[4] Feyisa, G.L., Meilby, H., Fensholt, R., Proud, S.R. (2014). Automated Water Extraction Index: A new technique for surface water mapping using Landsat imagery. Remote Sensing of Environment, 140: 23-35. https://doi.org/10.1016/j.rse.2013.08.029
[5] Zhang, F., Tiyip, T., Johnson, V.C., Wang, J., Nurmemet, I. (2016). Improved water extraction using Landsat TM/ETM+ images in Ebinur Lake, Xinjiang, China. Remote Sensing Applications: Society and Environment, 4: 109-118. https://doi.org/10.1016/j.rsase.2016.08.001
[6] Xie, L., Zhang, H., Wang, C., Chen, F. (2016). Water-Body types identification in urban areas from radarsat-2 fully polarimetric SAR data. International Journal of Applied Earth Observation and Geoinformation, 50: 10-25. https://doi.org/10.1016/j.jag.2016.02.012
[7] Sarp, G., Ozcelik, M. (2017). Water body extraction and change detection using time series: A case study of Lake Burdur, Turkey. Journal of Taibah University for Science, 11(3): 381-391. https://doi.org/10.1016/j.jtusci.2016.04.005
[8] Dai, C., Howat, I.M., Larour, E., Husby, E. (2019). Coastline extraction from repeat high resolution satellite imagery. Remote Sensing of Environment, 229: 260-270. https://doi.org/10.1016/j.rse.2019.04.010
[9] Yang, X., Qin, Q., Grussenmeyer, P., Koehl, M. (2018). Urban surface water body detection with suppressed built-up noise based on water indices from Sentinel-2 MSI imagery. Remote sensing of Environment, 219: 259-270. https://doi.org/10.1016/j.rse.2018.09.016
[10] Klein, I., Dietz, A.J., Gessner, U., Galayeva, A., Myrzakhmetov, A., Kuenzer, C. (2014). Evaluation of seasonal water body extents in Central Asia over the past 27 years derived from medium-resolution remote sensing data. International Journal of Applied Earth Observation and Geoinformation, 26: 335-349. https://doi.org/10.1016/j.jag.2013.08.004
[11] Paul, A., Tripathi, D., Dutta, D. (2018). Application and comparison of advanced supervised classifiers in extraction of water bodies from remote sensing images. Sustainable Water Resources Management, 4(4): 905-919. https://doi.org/10.1007/s40899-017-0184-6
[12] Labed, K., Fizazi, H., Mahi, H., Galvan, I.M. (2018). A comparative study of classical clustering method and cuckoo search approach for satellite image clustering: Application to water body extraction. Applied Artificial Intelligence, 32(1): 96-118. https://doi.org/10.1080/08839514.2018.1451214
[13] Duong, N.D., Hang, L.M., Tuan, T.A., Ouyang, Z. (2017). Development of a spectral‐pattern‐analysis‐based method for automated water body extraction using Landsat image data: A case study in central Vietnam and southern Laos. Limnology and Oceanography: Methods, 15(11): 945-959. https://doi.org/10.1002/lom3.10215
[14] Bioresita, F., Puissant, A., Stumpf, A., Malet, J.P. (2018). A method for automatic and rapid mapping of water surfaces from sentinel-1 imagery. Remote Sensing, 10(2): 217. https://doi.org/10.3390/rs10020217
[15] Ganesh, K.M., Raju, P.A.R.K., Prasad, A.S.S.V., Ratnagiri, D. (2018). Automated mapping of water bodies from Resourcesat-2 Awifs image using automated algorithm, Nalgonda District, Telangana State, India. International Journal of Engineering and Technology (UAE), 7(3): 224-227. https://doi.org/10.14419/ijet.v7i3.31.18301
[16] Kaplan, G., Avdan, U. (2017). Object-based water body extraction model using Sentinel-2 satellite imagery. European Journal of Remote Sensing, 50(1): 137-143. https://doi.org/10.1080/22797254.2017.1297540
[17] Mukherjee, N.R., Samuel, C. (2016). Assessment of the temporal variations of surface water bodies in and around Chennai using Landsat imagery. Indian Journal of Science and Technology, 9(8): 7. https://doi.org/10.17485/ijst/2016/v9i18/92089
[18] Yamazaki, F., Liu, W. (2016). Extraction of flooded areas due the 2015 kanto-tohoku heavy rainfall in Japan using PALSAR-2 images. International Archives of the Photogrammetry, Remote Sensing and Spatial Information Sciences - ISPRS Archives, 41: 179-183. https://doi.org/10.5194/isprsarchives-XLI-B8-179-2016
[19] Du, Y., Zhang, Y., Ling, F., Wang, Q., Li, W., Li, X. (2016). Water bodies’ mapping from Sentinel-2 imagery with modified normalized difference water index at 10-m spatial resolution produced by sharpening the SWIR band. Remote Sensing, 8(4): 354. https://doi.org/10.3390/rs8040354
[20] Ghassemian, H. (2016). A review of remote sensing image fusion methods. Information Fusion, 32: 75-89. https://doi.org/10.1016/j.inffus.2016.03.003
[21] Solanky, V., Katiyar, S.K. (2016). Pixel-level image fusion techniques in remote sensing: A review. Spatial Information Research, 24(4): 475-483. https://doi.org/10.1007/s41324-016-0046-6
[22] Stathaki, T. (2008). Image fusion: algorithms and applications, 1st Edition. Academic Press, London, UK.
[23] Blum, R.S., Liu, Z. (Eds.). (2005). Multi-Sensor Image Fusion and Its Applications. CRC Press.
[24] Pohl, C., Van Genderen, J.L. (1998). Review article multisensor image fusion in remote sensing: concepts, methods and applications. International Journal of Remote Sensing, 19(5): 823-854. https://doi.org/10.1080/014311698215748
[25] Tamkuan, N., Nagai, M. (2017). Fusion of multi-temporal interferometric coherence and optical image data for the 2016 Kumamoto earthquake damage assessment. ISPRS International Journal of Geo-Information, 6(7): 188. https://doi.org/10.3390/ijgi6070188
[26] Fadhil, A.F., Kanneganti, R., Gupta, L., Eberle, H., Vaidyanathan, R. (2019). Fusion of enhanced and synthetic vision system images for runway and horizon detection. Sensors, 19(17): 3802. https://doi.org/10.3390/s19173802
[27] Liu, C., Yang, K., Bennett, M.M., Guo, Z., Cheng, L., Li, M. (2019). Automated Extraction of Built-Up Areas by Fusing VIIRS Nighttime Lights and Landsat-8 Data. Remote Sensing, 11(13): 1571. https://doi.org/10.3390/rs11131571
[28] Ma, X., Li, C., Tong, X., Liu, S. (2019). A new fusion approach for extracting urban built-up areas from multisource remotely sensed data. Remote Sensing, 11(21): 2516. https://doi.org/10.3390/rs11212516
[29] Januar, T.W., Lin, T.H., Huang, C.Y., Chang, K.E. (2020). Modifying an image fusion approach for high spatiotemporal LST retrieval in surface dryness and evapotranspiration estimations. Remote Sensing, 12(3): 498. https://doi.org/10.3390/rs12030498
[30] Cao, Q., Ma, A., Zhong, Y. (2019). Urban classification by multi-feature fusion of hyperspectral image and LiDAR data. Journal of Remote Sensing, 23(5): 892-903. https://doi.org/10.11834/jrs.20197512
[31] Saadi, R., Hasanlou, M., Safari, A. (2019). Classifier fusion of polsar, hyperspectral and pan remote sensing data for improving land use classification. the international archives of photogrammetry. Remote Sensing and Spatial Information Sciences, 42: 913-916. https://doi.org/10.5194/isprs-archives-XLII-4-W18-913-2019
[32] Luo, S., Wang, C., Xi, X., Zeng, H., Li, D., Xia, S., Wang, P. (2016). Fusion of airborne discrete-return LiDAR and hyperspectral data for land cover classification. Remote Sensing, 8(1): 3. https://doi.org/ 10.3390/rs8010003
[33] Qadri, S., Khan, D.M., Qadri, S.F., Razzaq, A., Ahmad, N., Jamil, M., Awan, S.A. (2017). Multisource data fusion framework for land use/land cover classification using machine vision. Journal of Sensors. https://doi.org/10.1155/2017/3515418
[34] Al-Najjar, H.A., Kalantar, B., Pradhan, B., Saeidi, V., Halin, A.A., Ueda, N., Mansor, S. (2019). Land cover classification from fused DSM and UAV images using convolutional neural networks. Remote Sensing, 11(12): 1461. https://doi.org/10.3390/rs11121461
[35] Chen, B., Huang, B., Xu, B. (2017). Multi-source remotely sensed data fusion for improving land cover classification. ISPRS Journal of Photogrammetry and Remote Sensing, 124: 27-39. https://doi.org/10.1016/j.isprsjprs.2016.12.008
[36] Akram, T., Laurent, B., Naqvi, S.R., Alex, M.M., Muhammad, N. (2018). A deep heterogeneous feature fusion approach for automatic land-use classification. Information Sciences, 467: 199-218. https://doi.org/10.1016/j.ins.2018.07.074
[37] Le Bris, A., Chehata, N., Ouerghemmi, W., Wendl, C., Postadjian, T., Puissant, A., Mallet, C. (2019). Decision fusion of remote-sensing data for land cover classification. In Multimodal Scene Understanding, 341-382. https://doi.org/10.1016/B978-0-12-817358-9.00017-2
[38] Crowson, M., Warren-Thomas, E., Hill, J.K. (2019). A comparison of satellite remote sensing data fusion methods to map peat swamp forest loss in Sumatra, Indonesia. Remote Sensing in Ecology and Conservation, 5(3): 247-258. https://doi.org/10.1002/rse2.102
[39] Babadi, M., Sattari, M., Iran Pour, S. (2019). Exploring the potential of full waveform airborne lidar features and its fusion with RGB image in classification of a sparsely forested area. International Archives of the Photogrammetry, Remote Sensing and Spatial Information Sciences - ISPRS Archives, 42(4): 147-152. https://doi.org/10.5194/isprs-archives-XLII-4-W18-147-2019
[40] Tusa, E., Laybros, A., Monnet, J.M., Dalla Mura, M., Barré, J.B., Vincent, G., Chanussot, J. (2020). Fusion of hyperspectral imaging and LiDAR for forest monitoring. In Data Handling in Science and Technology, 32: 281-303. https://doi.org/10.1016/B978-0-444-63977-6.00013-4
[41] Gao, F., Anderson, M.C., Zhang, X., Yang, Z., Alfieri, J. G., Kustas, W.P., Prueger, J.H. (2017). Toward mapping crop progress at field scales through fusion of Landsat and MODIS imagery. Remote Sensing of Environment, 188: 9-25. https://doi.org/10.1016/j.rse.2016.11.004
[42] Hütt, C., Waldhoff, G., Bareth, G. (2020). Fusion of sentinel-1 with official topographic and cadastral geodata for crop-type enriched LULC mapping using FOSS and open data. ISPRS International Journal of Geo-Information, 9(2): 120. https//doi.org/10.3390/ijgi9020120
[43] Guan, H., Su, Y., Hu, T., Chen, J., Guo, Q. (2019). An object-based strategy for improving the accuracy of spatiotemporal satellite imagery fusion for vegetation-mapping applications. Remote Sensing, 11(24): 2927. https://doi.org/10.3390/rs11242927
[44] McClelland, C.J., Coops, N.C., Berman, E.E., Kearney, S.P., Nielsen, S.E., Burton, A.C., Stenhouse, G.B. (2019). Detecting changes in understorey and canopy vegetation cycles in West Central Alberta using a fusion of Landsat and MODIS. Applied Vegetation Science, 23(2): 223-238. https://doi.org/10.1111/avsc.12466
[45] Gašparović, M., Medak, D., Pilaš, I., Jurjević, L., Balenović, I. (2018). Fusion of sentinel-2 and planetscope imagery for vegetation detection and monitorin. In Volumes ISPRS TC I Mid-term Symposium Innovative Sensing-From Sensors to Methods and Applications, 42(1): 155-160. https://doi.org/10.5194/isprs-archives-XLII-1-155-2018
[46] Abdikan, S. (2018). Exploring image fusion of ALOS/PALSAR data and LANDSAT data to differentiate forest area. Geocarto International, 33: 21-37. https://doi.org/10.1080/10106049.2016.1222635
[47] Fu, B., Wang, Y., Campbell, A., Li, Y., Zhang, B., Yin, S., Jin, X. (2017). Comparison of object-based and pixel-based Random Forest algorithm for wetland vegetation mapping using high spatial resolution GF-1 and SAR data. Ecological Indicators, 73: 105-117. https://doi.org/10.1016/j.ecolind.2016.09.029
[48] Haas, J., Ban, Y. (2017). Sentinel-1A SAR and Sentinel-2A MSI data fusion for urban ecosystem service mapping. Remote Sensing Applications: Society and Environment, 8: 41-53. https://doi.org/10.1016/j.rsase.2017.07.006
[49] Karimi, D., Akbarizadeh, G., Rangzan, K., Kabolizadeh, M. (2017). Effective supervised multiple-feature learning for fused radar and optical data classification. IET Radar, Sonar and Navigation, 11: 768-777. https://doi.org/10.1049/iet-rsn.2016.0346
[50] Rajah, P., Odindi, J., Mutanga, O. (2018). Feature level image fusion of optical imagery and synthetic aperture radar (SAR) for invasive alien plant species detection and mapping. Remote Sensing Applications: Society and Environment, 10: 198-208. https://doi.org/10.1016/j.rsase.2018.04.007
[51] Shah, E., Jayaprasad, P., James, M.E. (2019). Image fusion of SAR and optical images for identifying Antarctic ice features. Journal of the Indian Society of Remote Sensing, 47(12): 2113-2117. https://doi.org/10.1007/s12524-019-01040-3
[52] Zare, M.L., Mahmoudi, F.T. (2019). Road recognition based on decision level fusion of sar and optic data. The International Archives of Photogrammetry, Remote Sensing and Spatial Information Sciences, 42: 665-669. https://doi.org/10.5194/isprs-archives-XLII-4-W18-665-2019
[53] Seo, D.K., Kim, Y.H., Eo, Y.D., Lee, M.H., Park, W.Y. (2018). Fusion of SAR and multispectral images using random forest regression for change detection. ISPRS International Journal of Geo-Information, 7(10): 401. https://doi.org/10.3390/ijgi7100401
[54] Fagir, J., Schubert, A., Frioud, M., Henke, D. (2017). SAR and oblique aerial optical image fusion for urban area image segmentation. International Archives of the Photogrammetry, Remote Sensing and Spatial Information Sciences - ISPRS Archives, 42(1): 639-642. https://doi.org/10.5194/isprs-archives-XLII-1-W1-639-2017
[55] Mustak, S.K., Uday, G., Ramesh, B., Praveen, B. (2019). Evaluation of the performance of SAR and SAR-optical fused dataset for crop discrimination. International Archives of the Photogrammetry, Remote Sensing and Spatial Information Sciences-ISPRS Archives, 42(3): 563-571. https://doi.org/10.5194/isprs-archives-XLII-3-W6-563-2019
[56] Amarsaikhan, D., Douglas, T. (2004). Data fusion and multisource data classification. International Journal of Remote Sensing, 25(17): 3529-3539. https://doi.org/10.1080/0143116031000115111
[57] Mahyoub, S., Fadil, A., Mansour, E.M., Rhinane, H., Al-Nahmi, F. (2019). Fusing of optical and synthetic aperture radar (SAR) remote sensing data: A systematic literature review (SLR). International Archives of the Photogrammetry, Remote Sensing and Spatial Information Sciences-ISPRS Archives, 42(4): 127-138. https://doi.org/10.5194/isprs-archives-XLII-4-W12-127-2019
[58] Kulkarni, S.C., Rege, P.P. (2020). Pixel level fusion techniques for SAR and optical images: A review. Information Fusion, 59: 13-29. https://doi.org/10.1016/j.inffus.2020.01.003
[59] Hunger, S., Karrasch, P., Wessollek, C. (2016). Evaluating the potential of image fusion of multispectral and radar remote sensing data for the assessment of water body structure. In Remote Sensing for Agriculture, Ecosystems, and Hydrology XVIII, 9998: 999814. https://doi.org/10.1117/12.2241264
[60] Ahmad, S.K., Hossain, F., Eldardiry, H., Pavelsky, T.M. (2019). A fusion approach for water area classification using visible, near infrared and synthetic aperture radar for south Asian conditions. IEEE Transactions on Geoscience and Remote Sensing. https://doi.org/10.1109/TGRS.2019.2950705
[61] Mejail, M.E., Jacobo-Berlles, J.C., Frery, A.C., Bustos, O.H. (2003). Classification of SAR images using a general and tractable multiplicative model. International Journal of Remote Sensing, 24(18): 3565-3582. https://doi.org/10.1080/0143116021000053274
[62] Xiao, X.H., Wang, Y.G. (2014). A cloud-removal method based on image fusion using local indexes. Computer Modeling and New Technology, 18(4): 82-88.
[63] Zaitsev, V.V., Zaitsev, V.V. (1996). Analysis of MAP speckle suppression algorithms. In IGARSS'96. 1996 International Geoscience and Remote Sensing Symposium, 1: 363-365. https//doi.org/10.1109/IGARSS.1996.516341
[64] Hong, T.D., Schowengerdt, R.A. (2005). A robust technique for precise registration of radar and optical satellite images. Photogrammetric Engineering & Remote Sensing, 71(5): 585-593. https//doi.org/10.14358/PERS.71.5.585
[65] Kwarteng, P., Chavez, A. (1989). Extracting spectral contrast in Landsat Thematic Mapper image data using selective principal component analysis. Photogramm. Eng. Remote Sens, 55(1): 339-348.
[66] Gharbia, R., El Baz, A.H., Hassanien, A.E., Tolba, M.F. (2014). Remote sensing image fusion approach based on Brovey and wavelets transforms. In Proceedings of the Fifth International Conference on Innovations in Bio-Inspired Computing and Applications IBICA 2014, pp. 311-321. https//doi.org/10.1007/978-3-319-08156-4_31
[67] Shettigara, V.K. (1992). A generalized component substitution technique for spatial enhancement of multispectral images using a higher resolution data set. Photogrammetric Engineering & Remote Sensing, 58: 561-567.
[68] Tu, T.M., Su, S.C., Shyu, H.C., Huang, P.S. (2001). A new look at IHS-like image fusion methods. Information fusion, 2(3): 177-186. https://doi.org/10.1016/S1566-2535(01)00036-7
[69] Amolins, K., Zhang, Y., Dare, P. (2007). Wavelet based image fusion techniques—An introduction, review and comparison. ISPRS Journal of Photogrammetry and Remote Sensing, 62(4): 249-263. https://doi.org/10.1016/j.isprsjprs.2007.05.009