Abdelhakim Chergui* | Salim Ouchtati | Sébastien Mavromatis | Salah Eddine Bekhouche | Mohamed Lashab | Jean Sequeira
© 2020 IIETA. This article is published by IIETA and is licensed under the CC BY 4.0 license (http://creativecommons.org/licenses/by/4.0/).
OPEN ACCESS
The use of facial images in the kinship verification is a challenging research problem in soft biometrics and computer vision. In our work, we present a kinship verification system that starts with pair of facial images of the child and parent, then as a final result is determine whether two persons have a kin relation or not. our approach contains five steps as follows: (i) the face preprocessing step to get aligned and cropped facial images of the pair (ii), extracting deep features based on the deep learning model called Visual Geometry Group (VGG) Face, (iii) applying our proposed pair feature representation function alongside with a features normalization, (iv) the use of Fisher Score (FS) to select the best discriminative features, (v) decide whether there is a kinship or not based on the Support Vector Machine (SVM) classifier. We conducted several experiments to demonstrate the effectiveness of our approach that we tested on five benchmark databases (Cornell KinFace, UB KinFace, Familly101, KinFace W-I, and KinFace W-II). Our results indicate that our system is robust compared to other existing approaches.
kinship verification, deep learning, VGG-Face, fisher score, SVM
The likeness between two people based on their facial appearance is one of the most important factors for kinship verification. Generally, four main types of kinship relationships were used in most studies which are: father-daughter relationship (F-D), mother-son (M-S), father-son (F-S) and mother-daughter (M-D). Although, there are other types of kinship relationships such as siblings and grandparents, and these types are rarely studied.
Kinship verification through facial images has attracted more attention from biometrics and computer vision
In practice, it has many applications such as finding missing children, family album organization and creation of family trees. Among the difficulties found in the study of kinship verification, the apparent similarity of two people who have no relationship and the case when people have blood relationship and don't have a similar appearance. In addition, effect of the different conditions of images captured in the wild.
In this paper, we propose a new system of kinship verification that is composed of five stages: starting by obtaining pairs facial images (child/parent) after the face preprocessing step, then we used the deep features based on VGG-FACE model that is able to extract discriminant pairs features of faces, these pairs features are transformed into a single features vector using the proposed features representation. These latter features are ranked based on Fisher’s Score weights to select the best discriminative features. Finally, the SVM classifier is used for the final decision (Kin or No-Kin).
Our main contributions include:
• The use of deep learning model called VGG-Face for the features extraction step to further improve the result of the kinship verification system compared with VGG-16.
• The advantages of the proposed features representation equation which gives the best representative between the parent and the child, and its effect on the results.
• The effectiveness of the features Normalization equation which transforms features values into other values that improve results.
• Considerable experiments on five public databases (Cornell kinface, UB KinFace, Familly 101, KinFace W-I and KinFace W-II) along with good and stable results of the proposed approach compared with most of the existing approaches.
The rest of this paper is organized as follows: Section 2 presents some background about the field of kinship verification. Section 3 explains the main five stages of the proposed kinship verification system. Section 4 mentions all the databases used to validate the proposed system and discusses the obtained results of this study. Finally, we conclude the paper in section 5.
Many research works have been conducted on facial kinship verification, all these research works can be categorized based on two main stages the feature extraction stage and the verification stage.
Fang et al. [1] proposed a system based on PSM (Pictorial structure model) for feature extraction and they used KNN for the classification phase, a fair result was obtained on the Cornell KinFace database. Xia et al. [2] applied the transfer learning approach to acquire the kinship verification knowledge, they evaluated their experiments on the UB KinFace database. Shao et al. [3] also evaluate their work on the same database, they verified the kinship relationships using the transfer subspace learning. Interesting work was done by Lu et al. [4] where they used the neighborhood repulsed metric learning (NRML) method to verify the kinship relationship. In addition, they proposed an extension of NRML called multi-view NRML (MNRML) approach to seeking a common metric distance in order to better use the multiple-image descriptor features, they applied their approach on KinFaceW-I and W-II databases.
Wang et al. [5] proposed a deep kinship verification (DKV) model and evaluate this model on KinFaceW-I and KinFaceW-II databases. DKV model is integrating excellent deep learning architecture into metric learning. Yan et al. [6] done a work that aims to learn discriminative mid-level features. Also, it introduced a kinship verification system where a new prototype-based discriminative feature learning (PDFL). In this system, each entry is the corresponding decision value from one SVM. Moreover, the performance evaluation was carried out on Cornell KinFace and UB Kin databases.
Chergui et al. [7] applied Discriminant Analysis in color images for the kinship verification task. This work was tested on Cornell KinFace, family 101, KinFaceW-I and KinFaceW-II databases. Chergui et al. [8] proposed the used of another image descriptor called LTP with another face representation called ML for extracting selected facial features. Moreover, an approach based on mixed image descriptors with ML features representation was done by Chergui et al. [9], and in other work [10] they proposed kinship verification system based on the deep features applied to the same databases. Moujahid et al. [11] proposed a system based on the covariance (second-order statistics) between diverse local features using PML representation for modeling the face images, they evaluate the performance of the system on the UB Kinface, Kinface W-I and KinFace W-II databases.
A deep architecture called towards young cross-generation model was proposed by Wang et al. [12] where they extracted features based on a newly designed Sparse Discriminative Metric Loss (SDM-Loss), and the testing was done on RFIW database. Liang et al. [13] developed a framework of weighted graph embedding based metric learning (WGEML) for facial kinship verification. They extract four types of features which are LBP, HOG, SIFT and VGG-FACE. Then they constructed an intrinsic graph and two penalty graphs to characterize the intraclass compactness and interclass separability for each feature representation. They conducted extensive experiments on KinFaceW-I, KinFaceW-II and TSKinFace databases.
Kohli et al. [14] they proposed a hierarchical Kinship Verification via Representation Learning (KVRL) framework is utilized to learn the representation of different face regions in an unsupervised manner. They proposed an approach for feature representation termed as filtered contractive deep belief networks (fcDBN), they applied their method on five databases Cornell, UB KinFace, KinFaceW-I, KinFaceW-II and WVU Kinship databases. Rehman et al. [15] proposed a deep learning system of kinship verification where they adopted Alexnet for the process of feature extraction and used SVM as a classifier, they examined this system on KinFace W-II and KinFace W-II databases. Jain et al. [16] work aims at the extraction of facial-based features and integrates them with a Siamese neural network to achieve higher accuracy.
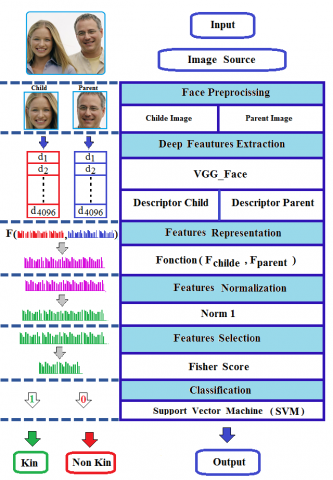
Figure 1 shows the block diagram of main stages of the proposed approach. First, we detect and crop the face. Second, we extract the deep features using the VGG-face descriptor. Then, we apply the features representation and normalization function. After that, we select the best discriminative features using FS. Finally, we used the SVM as a classifier for the final decision (kin or No-kin).
Figure 1. General structure of the proposed approach
3.1 Face preprocessing
In our approach, the face preprocessing stage consists of three steps: face detection using the Viola and Jones algorithm [17], the Pictorial Structure Model [18] for the eye’s localization and pose correction, then the face cropping [19]. Figure 2 shows the three steps of the face preprocessing stage.
Figure 2. Example of face alignment: (a) face detection, (b) eye localization, and (c) face cropping
3.2 CNN-based features
A Convolutional Neural Network (CNN) is a Deep Learning algorithm that can take in an input image, assign importance to various objects in the image and be able to differentiate one from the other. CNNs use relatively little pre-processing compared to other algorithms and this means that the network learns the filters that in traditional algorithms were hand-engineered. Several models have been extracted from CNN. In our research, study two important models VGG-16 and VGG-Face. VGG16 is a convolutional neural network model proposed by Simonyan and Zisserman [20].
This model was trained by the ImageNet dataset where ImageNet is a dataset of over 14 million images belonging to 1000 classes. The VGG-16 architecture contains the input and output layer, as well as multiple layers. the input layer is of fixed size, the image is passed through a stack of convolutional layers, using filters with the small field (3*3) and it also uses (1*1) convolution filters, and always used the same padding and the max-pool layer of 2x2 filter. It follows this arrangement three FC layers follow a stack of convolutional layers: the first two have 4096 channels each, the third performs 1000-way ILSVRC, and finally a 1000-way soft-max layer. Figure 3 shows the general architecture of VGG-16 with different layers (input, convolution layers, max pool, fully connected, and soft-max).
The VGG-Face CNN descriptors are computed using CNN implementation based on the VGG-16 CNN architecture but this model trained by VGG-Face, which is a dataset especially for facial images of over (2.6M images, 2.6K people), that was assembled by a combination of automation and human in the loop. It has the same architecture and contains the same layers (convolution layers, max pool, fully connected, and soft-max). The facial deep features are extracted from FC7 layer (fully connected layer), and the number of these features is 4096. Figure 4 presents the extraction of the learned face image features from VGG-face (a pretrained convolutional neural network). The layers FC7 was chosen since deeper layers contain higher-level features compared with earlier layers.
Figure 3. The general architecture of the VGG-16 model
Figure 4. CNN layers of the VGG-FACE model
3.3 Feature representation and normalization
Features Normalization is a method often applied as part to standardize the range of features, since, the range of values of features may vary widely, which made it an important stage.
At this point, we normalize the features using Euclidean norm as the following formula shows.
$F_{\text {Norm}}=\frac{F}{\sqrt{\sum_{j=1}^{N} F(j)}}$ (1)
where, $F_{\text {Nor } m}$ normalized features vector, F is the features vector and Fj is a one feature with the index j.
Formula 2 is used to transform the two feature vectors to one feature vector.
$F=\frac{F_{\text {Parent}}+F_{\text {Child}}}{\left(F_{\text {parent}}-F_{\text {Child}}\right)^{2}}$ (2)
where, $F, F_{\text {Parent}}, F_{\text {Child}}$ are the new feature vector, the feature vector of the parent and the feature vector of the child respectively.
3.4 Features selection
Feature Selection or data cleaning is one of the core concepts and very important step which impacts the performance of our approach.
Fisher’s score is one of the most widely used supervised features selection methods, the Fisher vector selects each feature independently [21]. Its equation is given as follow:
$W_{i}=\frac{\sum_{j=1}^{2} N_{j}\left(m_{j}-\bar{m}\right)^{2}}{\sum_{j=1}^{2} N_{j} \sigma_{j}^{2}}$ (3)
where, $W_{i}$ is the weight of feature $F_{i}$ , $\bar{m}$ is the mean of the features, $N_{j}$ is the total number of samples related to class j $(1 \rightarrow \operatorname{kin} / 2 \rightarrow \text { non }-\text { kin })$ , $m_{j} \text { and } \sigma_{j}^{2}$ are the mean and the variance of the class j of the studied feature $F_{i}$ .
3.5 Kinship verification
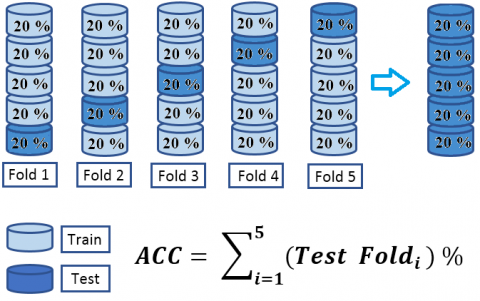
This is the last step in our approach to give the results (Kin or No-Kin). The cross-validation of five folds scheme was done in the evaluation process by following two steps. First, we create a model of classification from 80% of training pairs, then We use this model to test the remaining 20% of testing pairs. Last, we obtained the final accuracy after repeating the process five times along with changing the testing pairs each time.
3.5.1 Classifier (SVM)
The kinship verification task is a binary classification problem, so we pick out SVM as a classifier. The idea behind SVM is to find a maximum margin hyperplane to separate the features of the positive pairs from the negative pairs. We used the Gaussian kernel, also known as Radial Basis Function (RBF) kernel, with SVM [22].
3.5.2 Cross-validation
To fine-tune the hyperparameters of SVM we follow the grid search strategy, and we follow the cross-validation technique to have a fair evaluation of the kinship system. Cross-validation is defined as a procedure that organizes the partitions needed to evaluate the classifier’s performance, the cross-validation is performed on five partitions, for this reason it is called a five-partition cross-validation. In a first step, the database is divided into five disjoint stratified partitions of equal size.
In the first iteration, the first four partitions are used for learning the classifier, and the last one is used for testing. In the second iteration partitions 2 to 5 are used for learning and partition 1 is used for testing. In the third iteration, partitions 3 to 5 and partition 1 are used for learning, and partition 2 is used for testing, and so on.
Figure 5 shows the principle of cross-validation based on five partitions. The classification algorithm is trained five times for many different data segments and five independent tests are conducted each time. The number of partitions can be modified to meet the particular needs for a given experiment.
Figure 5. Cross-validation steps
This section contains two subsections, the details of the databases used are illustrated in the first part and the discussion of obtained results is explained in the second part.
4.1 Used databases
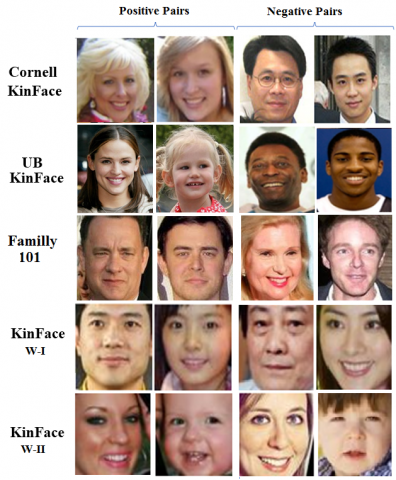
We used five of the most challenging databases (ِCornell KinFace, UB KinFace, Familly 101, KinFace W-I and KinFace W-II) to test the effectiveness of our proposed approach. These five databases contain images of children and their parents for four relationships which are: father-daughter (F-D), father-son (F-S), mother-son (M-S), and mother-daughter (M-D). Table 1 shows some stats about the used databases.
Table 1. The used databases for kinship verification
|
Databases |
Image |
Relationship |
Year |
|||
|
F-S |
F-D |
M-S |
M-D |
|||
|
Cornell Kin [2] |
286 |
40% |
22% |
13% |
25% |
2010 |
|
UB KinFace [4] |
600 |
45% |
39% |
06% |
10% |
2011 |
|
Familly 101 [23] |
14861 |
30% |
22% |
27% |
21% |
2013 |
|
KinFace W-I [5] |
1066 |
29% |
25% |
22% |
24% |
2014 |
|
KinFace W-II [5] |
2000 |
25% |
25% |
25% |
25% |
|
Some examples of positive and negative pairs of each database are shown in Figure 6.
Figure 6. Several image examples of used databases, two images in of positive and negative for each database
4.2 Experiments and discussion
In this part, we present and discuss the obtained results using different effects on our approach, we tested our experiments on five publicly available databases (Cornell KinFace, UB KinFace, Familly 101, KinFace-I, and KinFace-II). A five-fold cross-validation scheme is done to evaluate the performance of our kinship verification system.
4.2.1 Effect of learning CNN model (VGG-16 to VGG-Face)
In this experiment we have used two convolutional neural network models (VGG-16, VGG-Face) which have the same architecture, but each model was trained by a special database.
VGG-16 is a CNN model, it was trained by ImageNet database (it's a database containing different types of images).
The VGG-Face CNN are computed using VGG-16 CNN it has the same architecture and it was trained by VGG-Face database (it's a database containing only facial images).
Table 2. Accuracy (%) obtained with VGG-16 and VGG-face for the used databases
|
|
VGG-16 |
VGG-Face |
|
Cornell Kin |
87.12 |
92.89 |
|
UB KinFace |
86.35 |
90.59 |
|
Familly 101 |
81.65 |
84.82 |
|
KinFace W-I |
82.64 |
86.65 |
|
KinFace W-II |
76.41 |
81.11 |
From Table 2 we noticed that the results using VGG-Face better than VGG-16. This confirm the effect of learning CNN's models through specific databases. In our experiment, the CNN model trained by the VGG-Face database specializes in facial images, which gave their use a good result compared with VGG-16.
4.2.2 Effect of the image pair feature representation
In our approach it is important to study different functions allowing to represent the features of the two images into one single feature descriptor. We carried out several experiments for the pair feature representation step, by using different functions such as sum (Eq. (4)), distance (Eq. (5)), and our proposed function (Eq. (6)). We test the following pair function schemes:
$F_{1}=F_{\text {Parent}}+F_{\text {Child}}$ (4)
$F_{2}=\left|F_{\text {Parent }}-F_{\text {Child }}\right|$ (5)
$F_{3}=\frac{F_{\text {Parent}}+F_{\text {Child}}}{\left(F_{\text {Parent}}-F_{\text {Child}}\right)^{2}}$ (6)
Table 3. Accuracy (%) obtained with different pair fusion schemes for the used databases
|
|
F1 |
F2 |
F3 |
|
Cornell Kin |
60.69 |
80.26 |
92.89 |
|
UB KinFace |
58.98 |
78.46 |
90.59 |
|
Familly 101 |
53.98 |
73.30 |
84.82 |
|
KinFace W-I |
55.64 |
75.35 |
86.65 |
|
KinFace W-II |
52.86 |
66.10 |
81.11 |
From Table 3, we can see that the functioning scheme that uses the element wise absolute difference F2 gives the best results compared with the fusion schemes F1. For that reason, we included this distance in the proposed function schemes (Eq. (6)). As it can be seen the performance is significantly increased when using the proposed function (Eq. (6)).
4.2.3 Effect of the image pair feature normalization
This step is very important, the goal of normalization is to change the values numeric in the features to a common scale, without distorting differences in the ranges of values.
We tested our work using two different features normalization functions which are as $F_{\text {Norm} 1} \text { and } F_{\text {Norm} 2}$ , also without using any features normalization to see his impact on our approach.
$F_{\text {Norm} 1}=\frac{F-F_{\min }}{F_{\max }-F_{\min }}$ (7)
$F_{\text {Norm} 2}=\frac{F}{\sqrt{\sum_{j=1}^{N} F(j)}}$ (8)
From Table 4, we observed that our system has better results when using Norm2, compared with Norm1 and without using the Norm.
Table 4. Accuracy (%) obtained with different features normalization Norm for the used databases
|
|
Without |
Norm1 |
Norm2 |
|
Cornell Kin |
80.26 |
88.95 |
92.89 |
|
UB KinFace |
78.46 |
87.42 |
90.59 |
|
Familly 101 |
72.30 |
82.02 |
84.82 |
|
KinFace W-I |
74.35 |
84.64 |
86.65 |
|
KinFace W-II |
66.10 |
77.98 |
81.11 |
After the tests of several functions, we can see that the FNorm2 features representation improves the results and makes the system very robust.
4.2.4 Effect of the features selection
Feature Selection is the process that automatically select the contribute features and eliminate the features which can negatively impact performance.
In this experiment, we used and compared different functions The Kullback-Leibler [24], RelifF [25] and used Fisher Score or the feature selection step, and these functions are the most well-known.
From Table 5 we can see the effectiveness of used Fisher score in features selection step.
Table 5. Accuracy (%) obtained with different features selection schemes for the used databases
|
|
K.L |
ReleifF |
Fisher Score |
|
Cornell Kin |
74.35 |
86.24 |
92.89 |
|
UB KinFace |
73.12 |
85.35 |
90.59 |
|
Familly 101 |
70.30 |
82.84 |
84.82 |
|
KinFace W-I |
72.35 |
83.64 |
86.65 |
|
KinFace W-II |
68.32 |
78.32 |
81.11 |
The Kullback-Leibler achieved a poor performance while ReliefF and Fisher Score provided good performance despite the slight superiority of the Fisher Score, which gives the best results in our kinship verification system.
4.2.5 Effect of the classifier
To give the final result (Kin or No-Kin), an effective classifier must be used. That's why we compared two known classifiers to prove their effectiveness.
Table 6. Accuracy (%) obtained with KNN and SVM classifier
|
|
KNN |
SVM |
|
Cornell Kin |
81.96 |
92.89 |
|
UB KinFace |
80.33 |
90.59 |
|
Familly 101 |
76.12 |
84.82 |
|
KinFace W-I |
77..09 |
86.65 |
|
KinFace W-II |
72.36 |
81.11 |
In addition to the SVM classifier, we also tested our approach using KNN (k-Nearest Neighbors) to see the impact of SVM on our approach compared to the KNN. Table 6 above shows the performance of these experiments.
In the performance evaluation of our approach, KNN achieved a poor performance while SVM provided good performance and give better results. Due to this fact, we have chosen to use SVM as the main classifier. From our experiences, we conclude that in binary problems, SVM is efficient compared to KNN. Also, the SVM produces significant accuracy with less computation power.
4.2.6 Number of features used and CPU time
When conducting the experiments, we use FS to sort the features by its weight, then we tested different dimensions of the ranked features to show the effectiveness of the features selection step. This experiment of the used databases illustrates in Table 7.
Table 7. The obtained results using our approach when increasing the number of features
|
Features |
Cornell KinFace |
UB KinFace |
Familly 101 |
KinFace W-I |
KinFace W-II |
|
10 |
73.16 % |
70.37 % |
67.27 % |
68.32 % |
65.32 % |
|
50 |
77.54 % |
72.25 % |
68.92 % |
69.65 % |
68.42 % |
|
100 |
79.27 % |
76.62 % |
70.24 % |
72.65 % |
71.32 % |
|
250 |
82.11 % |
80.08 % |
76.47 % |
79.35 % |
75.36 % |
|
500 |
87.36 % |
83.21 % |
79.65 % |
83.01 % |
77.82 % |
|
750 |
90.06 % |
87.25 % |
83.24 % |
85.49 % |
79.61 % |
|
850 |
92.74 % |
90.39 % |
84.75 % |
86.48 % |
80.22 % |
|
1000 |
92.89 % |
90.59 % |
84.82 % |
86.65 % |
81.11% |
|
1250 |
92.93 % |
90.68 % |
84.90 % |
86.78 % |
81.14 % |
|
1500 |
92.96 % |
90.72 % |
84.98 % |
86.89 % |
81.18 % |
|
4096 |
92.97 % |
90.76 % |
84.89 % |
86.91 % |
81.23 % |
Figure 7 illustrates the kinship verification results and the consuming of time (CPU time) to test the features and it's affected by increasing the features number obtained after applying the FS features selection. This curve is for the Cornell database, for the rest of the databases have a similar shape.
The increasing use of features led to growing the time consuming linearly, and this is shown in Figure 7 and Table 7. However, the accuracy curve varies exponentially until it reaches a thousand features then it changes logarithmically. Based on these curves, we can see that the choice of a thousand features can be taken into consideration as the best trade-off in terms of accuracy and time-consuming. For our experiments we used PC computer DELL (intel core I7 4790 @ 3.60 GHz, 12GB RAM Duel Channel DDR3, Windows 8.1 Pro 64 bit).
Figure 7. Kinship verification performance in term of CPU time and the number of the used features
4.2.7 Relationship accuracy
We obtained the final results using the VGG-Face for features extraction with the proposed pair feature representation function and Fisher Score feature selection approach. Table 8 shows the performance of the proposed approach with different relationships (F-S), (F-D), (M-S) and (M-D).
Table 8. The accuracy (%) on the four relationships of the used databases
|
|
F-S |
F-D |
M-S |
M-D |
Mean |
|
CornellKinFace |
93.89 |
92.73 |
91.96 |
92.98 |
92.89 |
|
UB KinFace |
91.79 |
89.87 |
89.76 |
90.94 |
90.59 |
|
Familly 101 |
85.25 |
84.77 |
83.94 |
85.32 |
84.82 |
|
KinFace W-I |
87.63 |
86.31 |
85.64 |
87.02 |
86.65 |
|
KinFace W-II |
82.14 |
80.41 |
79.86 |
82.03 |
81.11 |
We can note: That, the easiest relationship to classify is to find the relationship on same gender, whether male or female, like (F-S) is easier than (F-D) and (M-D) is easier than(M-S), and hardest relationship to classify is the relationship that is not on the same gender
4.2.8 Receiver operating characteristic curves
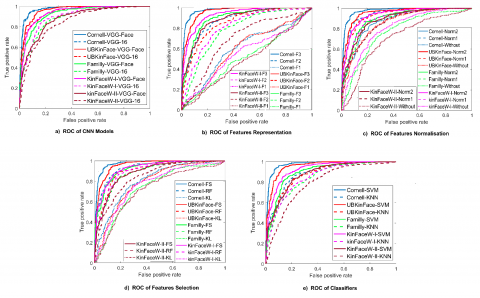
For the good confirmation of the best results and the performance of our approach, the receiver operating characteristic (ROC) curves of (four relationships, and different features representation function) are shown in Figure 8. This figure illustrates the ROC curves of the classification results on used kinship databases. We can observe the robustness of VGG-Face for features extraction step and the effect of the proposed features representation function, the use of features normalization and the Fisher Score for features selection also the SVM classifier for decision step. The curves associated with the other databases have a similar shape.
4.2.9 A comparison with some existing approaches
A comparison between the performance of our approach and some competing approaches is given in Table 9. In this table, we observe that our approach has very good results which are 92.89 %, 90.59%, 86.65%, 81.11% and 84.82% on Cornell KinFace, UBKinFace, KinFaceW-I, KinFaceW-II and Familly 101 respectively. These results emphasize the robustness of our proposed work in all these used databases.
Figure 8. ROC curves of different effects on the used databases
Table 9. A comparison of the proposed approach with other approaches
|
Year |
Approach |
Databases |
||||
|
Cornell |
UB KinFace |
Familly 101 |
KinFace W-I |
KinFace W-II |
||
|
2010 |
PSM [2] |
70.67 % |
-- |
-- |
-- |
-- |
|
2011 |
TSL [4] |
-- |
69.67 % |
-- |
-- |
-- |
|
2014 |
MNRML [5] |
-- |
-- |
-- |
69.90 % |
76.50 % |
|
PDFL [7] |
71.90 % |
67.30 % |
-- |
-- |
-- |
|
|
2015 |
DKV [6] |
-- |
-- |
-- |
66.90 % |
69.50 % |
|
RSBM [26] |
-- |
-- |
69.60 % |
-- |
-- |
|
|
2016 |
ESL-LBP [8] |
-- |
-- |
-- |
74.10 % |
74.30 % |
|
2017 |
NRCML [9] |
-- |
-- |
-- |
65.80 % |
65.80 % |
|
2018 |
LPQ-ML [27] |
82.86 % |
73.25 % |
-- |
75.98 % |
77.20 % |
|
BSIF-PML [11] |
86.71 % |
64.12 % |
-- |
78.89 % |
75.01 % |
|
|
LTP-PML [9] |
90.02 % |
87.16 % |
77.32 % |
82.84 % |
79.06 % |
|
|
2019 |
ResNat [28] |
87.16 % |
83.68 % |
82.07 % |
79.76 % |
76.89 % |
|
KML [29] |
81.40 % |
75.50 % |
-- |
75.57 % |
85.70 % |
|
|
Proposed |
92.89 % |
90.59 % |
84.82 % |
86.65 % |
81.11. % |
|
This study explores the subject of automating the kinship verification through facial images. Our study proposes a novel kinship verification system based on the VGG-face CNN Model for features extraction and our proposed features representation besides the use of the features normalization tools. Also, we used FS for features selection step and SVM classifier for the final decision between the images of the child and the parent. The obtained results are very encouraging and comparable with other existing approaches.
The results can be further improved as future work using other models of CNN-based features such as Inception-ResNet-v2, Inception-v4, and VGG-Face2. Also, given the importance of features representation and normalization stage we are studying other functions to improve the results.
Moreover, we envision to develop some CNN architectures for multitasking classification as contains all the kinship verification stages from input (child/parent) images to the final decision (Kin or No-Kin).
[1] Fang, R., Tang, K.D., Snavely, N., Chen, T. (2010). Towards computational models of kinship verification. In 2010 IEEE International Conference on Image Processing, pp. 1577-1580. https://doi.org/10.1109/ICIP.2010.5652590
[2] Xia, S., Shao, M., Fu, Y. (2011). Kinship verification through transfer learning. In Twenty-Second International Joint Conference on Artificial Intelligence, pp. 2539-2544. http://dx.doi.org/10.5591/978-1-57735-516-8/IJCAI11-422
[3] Shao, M., Xia, S., Fu, Y. (2011). Genealogical face recognition based on UB KinFace database. In CVPR 2011 Workshops, pp. 60-65. https://doi.org/10.1109/CVPRW.2011.5981801
[4] Lu, J., Zhou, X., Tan, Y.P., Shang, Y., Zhou, J. (2013). Neighborhood repulsed metric learning for kinship verification. IEEE Transactions on Pattern Analysis and Machine Intelligence, 36(2): 331-345. https://doi.org/10.1109/TPAMI.2013.134
[5] Wang, M., Li, Z., Shu, X., Tang, J. (2014). Deep kinship verification. In Multimedia Signal Processing (MMSP), 2015 IEEE 17th International Workshop on, IEEE, 2015. https://doi.org/10.1109/MMSP.2015.7340820
[6] Yan, H., Lu, J., Zhou, X. (2014). Prototype-based discriminative feature learning for kinship verification. IEEE Transactions on Cybernetics, 45(11): 2535-2545. https://doi.org/10.1109/TCYB.2014.2376934
[7] Chergui, A., Ouchtati, S., Sequeira, J., Bekhouche, S.E., Bougourzi, F., Benlamoudi, A. (2018). Discriminant analysis for facial verification using colorimages. unpublished. In Proceeding of the first International Conference on Electrical Engineering ICEEB18.
[8] Chergui, A., Ouchtati, S., Sequeira, J., Bekhouche, S.E., Telli, H. (2018). Robust kinship verification using local descriptors” unpublished. In Proceeding of Third International Conference on Advanced Technologies and Electrical Engineering ICTAEE 18, 2018.
[9] Chergui, A., Ouchtati, S., Mavromatis, S., Bekhouche, S.E., Sequeira, J., Zerrari, H. (2019). Kinship verification using mixed descriptors and multi block face representation. In 2019 International Conference on Networking and Advanced Systems (ICNAS), pp. 1-6. https://doi.org/10.1109/ICNAS.2019.8807875
[10] Chergui, A., Ouchtati, S., Sequeira, J., Bekhouche, S.E., Bougourzi, F., Telli, H. (2019). Deep features for kinship verification from facial images. In 2019 International Conference on Advanced Systems and Emergent Technologies (IC_ASET), pp. 64-67. https://doi.org/10.1109/ASET.2019.8871011
[11] Moujahid, A., Dornaika, F. (2019). A pyramid multi-level face descriptor: Application to kinship verification. Multimedia Tools and Applications, 78(7): 9335-9354. https://doi.org/10.1007/s11042-018-6517-0
[12] Wang, S., Ding, Z., Fu, Y. (2018). Cross-generation kinship verification with sparse discriminative metric. IEEE Transactions on Pattern Analysis and Machine Intelligence, 41(11): 2783-2790. https://doi.org/10.1109/TPAMI.2018.2861871
[13] Liang, J., Hu, Q., Dang, C., Zuo, W. (2018). Weighted graph embedding-based metric learning for kinship verification. IEEE Transactions on Image Processing, 28(3): 1149-1162. https://doi.org/10.1109/TIP.2018.2875346
[14] Kohli, N., Vatsa, M., Singh, R., Noore, A., Majumdar, A. (2016). Hierarchical representation learning for kinship verification. IEEE Transactions on Image Processing, 26(1): 289-302. https://doi.org/10.1109/TIP.2016.2609811
[15] Rehman, A., Khalid, Z., Asghar, M.A., Khan, M.J. (2019). Kinship verification using deep neural network models. In 2019 International Symposium on Recent Advances in Electrical Engineering (RAEE), 4: 1-6. https://doi.org/10.1109/RAEE.2019.8886969
[16] Jain, A., Bhagat, N., Srivastava, V., Tyagi, P., Jain, P. (2020). A Feature-Based kinship verification technique using convolutional neural network. In Advances in Data Sciences, Security and Applications, 353-362. https://doi.org/10.1007/978-981-15-0372-6_28
[17] Viola, P., Jones, M. (2001). Rapid object detection using a boosted cascade of simple features. In Proceedings of the 2001 IEEE Computer Society Conference on Computer Vision and Pattern Recognition. CVPR 2001, 1: 511-518. https://doi.org/10.1109/CVPR.2001.990517
[18] Bekhouche, S.E., Ouafi, A., Dornaika, F., Taleb-Ahmed, A., Hadid, A. (2017). Pyramid multi-level features for facial demographic estimation. Expert Systems with Applications, 80: 297-310. https://doi.org/10.1016/j.eswa.2017.03.030
[19] Bekhouche, S.E. (2017). Facial Soft Biometrics: Extracting demographic traits. Doctoral dissertation, Faculté des Sciences et Technologies. https://doi.org/10.13140/RG.2.2.28945.28008
[20] Parkhi, O.M., Vedaldi, A., Zisserman, A. (2015). Deep face recognition. In BMVC, 1(3): 6. https://dx.doi.org/10.5244/C.29.41
[21] Lohninger, H. (1999). Teach/me: Data Analysis. Springer. https://doi.org/10.1007/s00216-004-2812-x
[22] Arumugam, M., Thangaraj, P., Sivakumar, P., Pradeepkumar, P. (2010). Implementation of two class classifiers for hybrid intrusion detection. In 2010 International Conference on Communication and Computational Intelligence (INCOCCI), ISBN: 978-81-8371-369-6, pp. 486-490.
[23] Fang, R., Gallagher, A.C., Chen, T., Loui, A. (2013). Kinship classification by modeling facial feature heredity. In 2013 IEEE International Conference on Image Processing, pp. 2983-2987. https://doi.org/10.1109/ICIP.2013.6738614
[24] Duda, R.O., Hart, P.E. (2001). DG Stork Pattern Classification. Wiley-I nterscience, New York, 200, 1.1. https://doi.org/10.1007/s00357-007-0015-9
[25] Robnik-Šikonja, M., Kononenko, I. (2003). Theoretical and empirical analysis of ReliefF and RReliefF. Machine Learning, 53(1-2): 23-69. https://doi.org/10.1023/A:1025667309714
[26] Qin, X., Tan, X., Chen, S. (2015). Tri-subject kinship verification: Understanding the core of a family. IEEE Transactions on Multimedia, 17(10): 1855-1867. https://doi.org/10.1109/TMM.2015.2461462
[27] Chergui, A., Ouchtati, S., Telli, H., Bougourzi, F., Bekhouche, S.E. (2018). LPQ and LDP descriptors with ml representation for kinship verification. In The second edition of the International Workshop on Signal Processing Applied to Rotating Machinery Diagnostics (SIGPROMD’2018), pp. 1-10.
[28] Chergui, A., Ouchtati, S., Mavromatis, S., Bekhouche, S. E., Sequeira, J. (2019). Investigating deep CNNs Models Applied in Kinship Verification through Facial Images. In 2019 5th International Conference on Frontiers of Signal Processing (ICFSP), pp. 82-87.
[29] Zhou, X., Jin, K., Xu, M., Guo, G. (2019). Learning deep compact similarity metric for kinship verification from face images. Information Fusion, 48: 84-94. https://doi.org/10.1016/j.inffus.2018.07.011