Huadong Zou* | Ruiqing Jia
© 2019 IIETA. This article is published by IIETA and is licensed under the CC BY 4.0 license (http://creativecommons.org/licenses/by/4.0/).
OPEN ACCESS
The coals and gangues in a raw coal image have similar visual features, due to the presence of coal ash on the surface. Thus, it is difficult to locate and recognize coals and gangues on the transmission line through visual recognition. To solve the problem, this paper proposes a visual positioning and recognition method for gangues based on scratch feature detection. Firstly, an image acquisition system was designed to capture the clear and suitable images. Next, scratched features were prepared on gangue surface with mechanical tools, laying the basis for visual positioning and recognition. Afterwards, the texture feature recognition method based on grey-level co-occurrence matrix (GLCM) was adopted to identify coal and scratched gangue blocks. The test results show that the GLCM correlation feature parameter is effective for scratch recognition. The parameter and the said method were proved effective through experiments.
gangue, raw coal, grey level co-occurrence matrix (GLCM), texture feature, scratch feature
Gangue is a commercially worthless material that accompanies coal. The material is generally harder than coal, featuring low volatility, low calorific value and high ash content. In terms of composition, gangues are either dominated by coal, with a few amounts of rocks, or mainly composed of incombustible rocks. To ensure the quality of coal, gangues must be filtered out from the raw coal at the coalmine.
In most coalmines in China, gangue removal is carried out manually. Several workers stand on both sides of the raw coal transmission line, picking out the gangues by hand. The manual separation of gangues is illustrated in Figure 1. However, it is very difficult to differentiate between gangues and coals, due to the layer of coal dust on most gangues. In many cases, the workers use hooks and claws to turn over the suspected blocks, and judge if they are gangues by turning force and block volume. This method is clearly inefficient and labor-intensive. Besides, the heavy dust and noise in the workshop may harm workers’ health. This calls for an intelligent gangue separation system that reduces the workload and enhances separation efficiency.
Figure 1. Manual separation of gangues
The existing intelligent gangue separation systems mainly rely on ray recognition and machine vision recognition [1-5]. The dual-energy ray recognition has long been adopted for coal preparation. This method distinguishes between coal and gangue based on their difference in the absorption of low energy rays. In actual application, the signals are collected by a ray sensor and sent to a computer, which then identifies the gangues according to the ray absorption model and the collected signals. This method works excellently when the coal and gangue blocks are relatively small, but performs poorly in the case of large blocks, for gamma rays cannot easily penetrate large solid materials. This defect, coupled with the radiation damage of gamma rays, severely limits the application frequency of ray recognition in gangue separation.
Machine vision recognition is the most popular method for gangue separation. In 2007, David M. Hobson et al. [7] designed an image processing method based on texture feature recognition: the original image is processed by an edge detector, and then the gangues are identified by density resolution and the proportion of bright spots. Zhang Chen et al. [8] developed a gangue separation method based on density detection. Jian Cheng put forward an improved Gaussian mixture model that recognizes gangues through video detection. Specifically, the improved model was adopted to extract the video background, which was further separated to detect the gangues [9]. References [10, 11] propose to identify gangues with gray level co-occurrence matrix. Most of these studies assume that there is a clear contrast between the background and object, which is not always the case in actual workshops.
To solve the problem, this paper proposes a visual positioning and recognition method for gangues based on scratch feature detection. Firstly, an image acquisition system was designed to capture the clear and suitable images. Next, scratched features were prepared on gangue surface with mechanical tools, laying the basis for visual positioning and recognition. Afterwards, the GLCM-based texture feature recognition method was adopted to identify coal and scratched gangue blocks. The test results show that the GLCM correlation feature parameter is effective for scratch recognition. The parameter and the said method were proved effective through experiments.
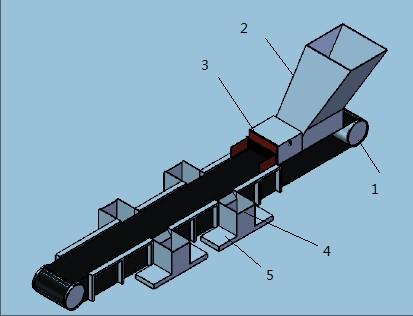
Gangue separation is necessary before raw coal is loaded for transportation. Figure 2 describes the structure of a typical gangue separation line. As shown in the figure, the raw coal needs to pass through a vibration sieve to filter out small coal blocks. Meanwhile, the large raw coal blocks remain on the conveyor belt and enter the separation line through the entrance. Upon entering the line, the large blocks roll down a slope. A baffle plate is installed on the slope to prevent the blocks from rolling out of the track. The gangues are then identified by workers and relocated to the separation well in the operation station.
1. Conveyor belt; 2. Entrance; 3. Baffle plate; 4. Separation well; 5. Operation station
Figure 2. Gangue separation line
Due to the presence of coal dust and the lack of ambient light, the separation line has a poor visual environment. It is impossible to detect object boundaries in such an environment, not to mention positioning and recognizing the gangues. From the image of raw coal in Figure 3, neither coals nor gangues have clear boundaries, but gangues have more bright spots than coals.
Figure 3. Image of raw coal
Two traditional edge detection operators, namely, Sobel and Perwitte, were selected to detect the edges of gangues. The detected results are shown in Figure 4 below.
(a) Detection results of Sobel operator (b) Detection results of Perwitte operator
Figure 4. Detection results of Sobel and Perwitte operators
The results show that neither operator managed to acquire the contours accurately, which reflects the negative impacts from coal dust in the background. During the transport of raw coal, the presence of coal dust makes it difficult to extract position coordinates without edge contour information, or recognize coals and gangues. To separate gangues from raw coal, the key lies in identifying the edges of gangues and finding the feature difference between gangues and coals.
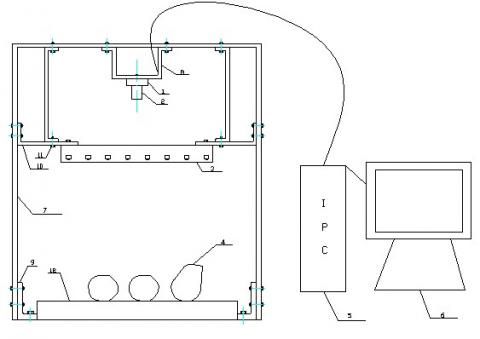
The image acquisition system was set up based on the original coal transmission line. As shown in Figure 5, the system consists of charge-coupled device (CCD) camera, surface light source, support bracket, isolation cover, industrial personal computer (PC), etc. Gigabit ethernet cameras were chosen to acquire the image (model: RS-A5001-GM/GC14; resolution: 2,592×1,944 pixels; pixel size: 2.2×2.2μm; frame rate: 14fps). The lens model is VS1614-10M (resolution: 5 million pixels). The surface light source is an LED strip light (size: 497mm×31mm×22mm) that provides good lighting conditions for camera shooting. The isolation serves as a dust shield and reduces the interference of external light.
1.CCD camera; 2. Lens; 3. Suface light source; 4. Raw coal; 5. Industrial PC; 6. Monitor; 7. Isolation cover; 8. Camera mounting bracket; 9. Bottom fixing bracket; 10. Camera connection bracket; 11. Fastening bolts; 12. Conveyor belt.
Figure 5. Mechanical structure of the image acquisition system
Since the conveyor belt is 1,200mm in width, the CCD camera was installed at a proper height to cover most of the area of the belt, such as 900mm. For the same purpose, the target size of the CCD camera was set to 1’/3. The focal length of the VS1614-10M fell between F1.4 and F16. The installation height of the lens was determined by:
$L=\frac{W\times f}{w}$ (1)
where, W is the field of view; f is the focal length of the lens; w is the width of the target surface.
Substituting the parameters into formula (1), the upper and lower bounds of the installation height can be obtained as ${{L}_{\min }}=\frac{900\times 1.4}{4.8}=262.5mm$ and ${{L}_{\max }}=\frac{900\times 16}{4.8}=3000mm$. The system design assumes that small coal and gangue blocks have been removed by the vibrating sieve, and that the large coal and gangue blocks are less than 1m in height. Considering all these factors, the installation height and focal length of lens were set to 1,450mm and 8mm, respectively.
4.1 Basic principle of the GLCM
Despite its commonplace in image analysis, texture has no uniform definition at present. It can be roughly understood as a periodic collection of various closely interwoven elements. Texture can describe the smooth, sparse and regular features of the region [12, 13].
The GLCM reflects the grey levels of an image about the direction, adjacent interval and change range. Let S be a set of pixel pairs with specific spatial connections in the target region R. Then, the GLCM P can be defined as:
$P(i,j)=\frac{\#\{[({{x}_{1}},{{y}_{1}}),({{x}_{2}},{{y}_{2}})]\in S|f({{x}_{1}},{{y}_{1}})=i,f({{x}_{2}},{{y}_{2}})=j\}}{\#S}$ (2)
where, # is the serial number; the numerator is the number of spatially correlated pixels and the grey values of i and j; #S is the total number of pixel pairs.
The GLCM should be computed by the position operator to statistically describe texture using spatial information. According to the definition of formula 2, a pair of pixels (x1, y1) and (x2, y2) were selected with interval d and grey values i and j, respectively. Considering the four directions of 0°, 45°, 90° and 135°, the probability for the pixel pair to occur was denoted as P(i,j,d,θ). The joint probability densities of the grey levels of an image can be expressed as a matrix. After counting all the pixels of the image, the GLCM can reflect the grey levels of an image about the direction, adjacent interval and change range, laying the basis for analysing the coal patterns and their arrangement of the image.
To describe the texture features of an image, what is adopted in is not the GLCM, but the texture feature parameters derived from the GLCM. An image usually has 256 grey levels. If mapped directly, the GLCM of the image will have too many rows and columns, making it time-consuming to solve. Thus, the number of grey levels of the image was compressed to 8 or 16 before being mapped into the GLCM. The compression formula can be expressed as:
$T\operatorname{Im}age[i][j]=\frac{\operatorname{Im}age[i][j]}{256/Laynum}$ (3)
where, Image[i][j] and TImage[i][j] are the grey values of the pixel at coordinates (i, j) of the original and the converted images, respectively; Laynum is the number of grey levels.
4.2 One direction feature parameter of the GLCM
Instead of directly applying the GLCM, the texture features of an image were described by the following parameters: energy, entropy, moment of inertia, inverse difference moment, and correlation.
(1) Energy
Energy is the square sum of element values of the GLCM. It reflects the uniformity of grey value distribution and texture thickness in an image. The parameter can be described as:
${{W}_{ENG}}=\sum\limits_{i=0}^{L-1}{\sum\limits_{j=0}^{L-1}{{{(P(i,j,d,\theta ))}^{2}}}}$ (4)
(2) Entropy
Entropy reflects the degree of regularity of an object. The more regular the object, the smaller the entropy. Statistically, the entropy value represents the amount of image information. When all GLCM elements are at peak stochasticity, all the values in the matrix are basically equal; when the elements are dispersed, the entropies are relatively large. The entropy indicates the texture inhomogeneity or complexity in the image. The denser the texture, the greater the entropy value:
${{W}_{ENT}}=\sum\limits_{i=0}^{L-1}{\sum\limits_{j=0}^{L-1}{-P(i,j,d,\theta )}}\log (P(i,j,d,\theta ))$ (5)
(3) Moment of inertia
Moment of inertia, also known as contrast, describes the clarity and depth of texture groove in the image. The moment of inertia is positively correlated with image clarity. The value of this parameter can be described as:
${{W}_{CON}}=\sum\limits_{i=0}^{L-1}{\sum\limits_{j=0}^{L-1}{{{(i-j)}^{2}}}}P(i,j,d,\theta )$ (6)
(4) Inverse difference moment
Inverse difference moment is the reciprocal of the moment of inertia. The value of this parameter can be described as:
${{W}_{IDM}}=\sum\limits_{i=0}^{L-1}{\sum\limits_{j=0}^{L-1}{\frac{P(i,j,d,\theta )}{1+{{(i-j)}^{2}}}}}$ (7)
(5) Correlation
The correlation measures the similarity of the GLCM in row and column directions, and thus represents the main direction of image texture. The correlation value is high when matrix elements have uniform and equal values, and low when the latter have vastly different values. If the image contains a horizontal texture, then the horizontal direction matrix will have a greater correlation value than that of any other matrix. The value of correlation can be described as:
${{W}_{COR}}=\frac{\sum\limits_{i=0}^{L-1}{\sum\limits_{j=0}^{L-1}{i\times j}}\times P(i,j,d,\theta )-{{\mu }_{1}}{{\mu }_{2}}}{{{\sigma }_{1}}^{2}\times {{\sigma }_{2}}^{2}}$ (8)
where
${{\mu }_{1}}=\sum\limits_{i=0}^{L-1}{i\sum\limits_{j=0}^{L-1}{(P(i,j,d,\theta ))}}$ (9)
${{\mu }_{1}}=\sum\limits_{j=0}^{L-1}{j\sum\limits_{i=0}^{L-1}{(P(i,j,d,\theta ))}}$ (10)
${{\sigma }_{1}}^{2}=\sum\limits_{i=0}^{L-1}{{{(i-{{\mu }_{1}})}^{2}}\sum\limits_{j=0}^{L-1}{P(i,j,d,\theta )}}$ (11)
${{\sigma }_{2}}^{2}=\sum\limits_{j=0}^{L-1}{{{(j-{{\mu }_{1}})}^{2}}\sum\limits_{i=0}^{L-1}{P(i,j,d,\theta )}}$ (12)
5.1 Preparation of scratch features
The texture feature parameters of the GLCM describe the information of the image about grey level direction, interval and change range. These parameters ensure the reliability and effectiveness of feature recognition, and thus have been widely used in fingerprint recognition, textile recognition and other fields [14-17].
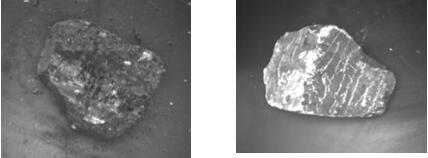
The previous analysis shows that the texture features often have periodicity and interval features. However, coals and gangues are not suitable for texture feature analysis, if the humidity is large and the object is covered with coal dust. According to their composition and physical features, coal is relative soft and in black colour, while gangue is mainly made up of hard rocks and shows a white colour. When the raw coal is dry on the surface with no water accumulation, white marks can be made on the gangue surface with a hard tool. Meanwhile, no white mark could be left on the coal surface by the same method, as the coal is entirely black. Therefore, the coal dust was blown away from the raw coal on the transmission line with high-pressure gas. Then, scratch features were created at equal intervals with hard metal brushes on gangues, laying the basis for visual recognition.
Figure 6. Image of raw coal after scratching
The scratched raw coal is illustrated in Figure 6. It can be seen that the scratched gangues both exhibited good texture features and obvious boundary features. Both features are useful in contour extraction by machine vision methods. Here, the image of the scratched gangues is processed by the image segmentation based on run-length connectivity scanning [18-20]. The resulting image is displayed in Figure 7, which shows that the scratched gangues were positioned correctly. The position information is essential for robot positioning and removal of gangues in the following steps.
Figure 7. Results of image segmentation
5.2 Feature parameters of the GLCM for gangue recognition
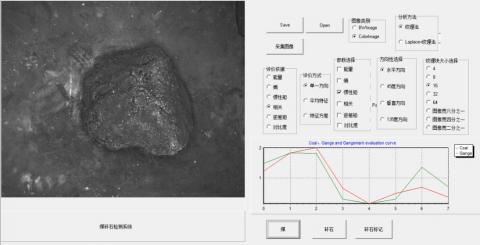
After preparing the scratch features, the GLCM was adopted to recognize coals and gangues. Our analysis covers 8 images of coals, 8 images of gangues and 5 images of scratched gangues. The size of each image is 2,592×1,944. The test samples were all collected from TongXin Coalmine, Shanxi Province, China. The analytical software was developed on C++ Builder 6.0. The software interface is shown in Figure 8.
Figure 8. Software interface of gangue recognition
Figure 9. GLCM evaluation curves of coal, gangue and scratched gangues images by energy
Figure 10. GLCM evaluation curves of coal, gangue and scratched gangues images by entropy
Figure 11. GLCM evaluation curves of coal, gangue and scratched gangues images by moment of inertia
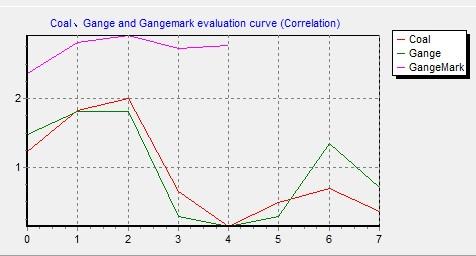
Figure 12. GLCM evaluation curves of coal, gangue and scratched gangues images by correlation
The GLCM provides five texture feature parameters, including energy, entropy, moment of inertia, inverse difference moment, and correlation. Among them, the moment of inertia is correlated with the inverse difference moment. As a result, energy, correlation, moment of inertia and entropy were selected to analyse the test samples, and evaluate the recognition effect. Before that, direction was set to 0°, the step distance D to 1, the number of grey levels to 16, and the size of the texture block to 16×16. Then, the evaluation curves of the above parameters are plotted as Figure 9-12, where the x-axis is the parameter and the y-axis is the serial number.
As shown in Figure 9-11, the GLCM evaluation curves were interlaced with each other before preparing the scratch features, making it impossible to find a suitable threshold to differentiate between coal and gangue. By contrast, the correlation evaluation curve of scratched gangues in Figure 12 stayed above the other two curves. This means the correlation threshold can be used to distinguish between coal and scratched gangue. No other threshold could achieve the same effect. Therefore, it is decided to use the correlation evaluation value as the parameter for gangue recognition.
5.3 Recognition experiment
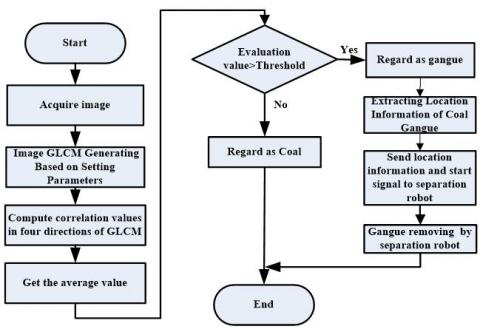
Figure 13 explains how the GLCM correlation feature value and the corresponding threshold are adopted in gangue recognition. Firstly, our image acquisition system collected the image of scratched gangues and coals. Next, the GLCM of the image was generated based on direction, interval and block size. After that, the correlation evaluation values of the four directions were calculated separately. On this basis, the mean value of the four correlation evaluation values was obtained, and used for gangue recognition. An object was judged as gangue if the evaluation value is greater than the threshold. In this case, the position of the object in the image was derived by image processing. All information was sent to the separation robot through the serial port. Upon receiving the gangue information, the robot started to locate and remove the gangue into separation well.
Figure 13. The flow chart of gangue recognition and separation
The experiment targets samples of coal and gangue in different sizes and shapes. A total of 60 images on coal and scratched gangue were captured by the CCD camera under the surface light source. The image size was 2,592 × 1,944. The recognition software was designed under the Boland C++ (BCB) environment. Figure 14 shows the gangue location and test scene.
Figure 14. Gangue location and test scene
The recognition results of coal and gangue are listed in Table 1. The results show that the gangues were identified accurately. In other words, the GLCM-based recognition method can effectively distinguish between gangue and coal, after the preparation of scratch features.
Table 1. Recognition results of coal and gangue
|
Total number |
correct number |
correctness |
|
90 |
90 |
100% |
|
15 |
15 |
100% |
The length and width of the gangues in Figure 7 were measured by image method with a ruler, and compared with the test results to verify the positioning accuracy. The measured data are recorded in Table 2. It can be seen that the two approaches had a measuring error of less than 1mm. With the scratch features, it is easier to locate the gangues on the conveyor belt.
Table 2. The measured results (W´H)
|
Gangue length (Pixel) |
Gangue width (Pixel) |
Measuring length (mm) |
Length measuring by ruler (mm) |
Measuring width (mm) |
Width measuring by ruler (mm) |
|
792 |
576 |
371.4 |
371.8 |
272.4 |
272.9 |
This paper proposes a visual positioning and recognition method for gangues based on scratch feature detection. Firstly, an image acquisition system was designed to capture the clear and suitable images. Next, scratched features were prepared on gangue surface with mechanical tools, laying the basis for visual positioning and recognition. Afterwards, the GLCM-based texture feature recognition method was adopted to identify coal and scratched gangue blocks. The test results show that the GLCM correlation feature parameter is effective for scratch recognition. The parameter and the said method were proved effective through experiments.
However, the scratch features are still time-consuming to prepare, owing to the varied shapes and sizes of gangues. To prepare these features, the height, position and relative angle of the tool must be adjusted frequently, which negatively affects the real-time performance of sorting. Another problem lies in the high wear rate of the tool. Therefore, the future research will further optimize the design of the automatic separation system and enhance the device reliability and stability.
This work is supported by the Industrial Robot Technology Collaborative Innovation Centre project of Qing yuan Polytechnic. We acknowledge the Qin Niu Chuangzhi Co., Ltd., China. We also acknowledge Dr Wang Qian and Zhou Dongxu for providing the test samples. Master GAO Renzhi and GAO Peng provided us with photography and other related help, and I would like to thank them for that.
[1] Zheng, K.H., Du, C.L., Li, J.P., Qiu, B.J., Yang, D.L. (2015). Underground pneumatic separation of coal and gangue with large size (≥50 mm) in green mining based on the machine vision system. Powder Technology, 278: 223-233. http://dx.doi.org/10.1016/j.powtec.2015.03.027
[2] Wang, W.D., Zhang, C. (2017). Separating coal and gangue using three-dimensional laser scanning. International Journal of Mineral Processing, 278: 223-233. https://doi.org/10.1016/j.minpro.2017.10.010
[3] Yu, L. (2017). A new method for image recognition of coal and coal gangue. Modern Computer, 06: 66-70.
[4] Fookes, R.A., Gravitis, V.L., Watt, J.S., Hartley, P.E., Campbell, C.E., Howells, E., McLennan, T., Millen, M.J. (1983). On-Line determination of the ash content of coal using a “Siro ash” gauge based on the transmission of low and high energy γ-Rays. The International Journal of Applied Radiation and Isotopes, 34(1): 63-69. https://doi.org/10.1016/0020-708X(83)90117-5
[5] Kong, L., Li, H., Xu, Q., Xu, S.H. (1998) Regional segmentation and recognition method of Coal Gangue Based on dual-energy γ-ray. Journal of Hua Zhong University of Science and Technology, (1): 39-40, 62. https://doi.org/10.13245 /j.hust.1998. 01.012
[6] Ma, X.M. (2003). Study of on-line recognition and automatic separation of waste rock in coal mine. Journal of Xi’an University of Science and Technology, 23(3): 66-68.
[7] Hobson, D.M., Carter, R.M., Yan, Y., Lv, Z.X. Differentiation between coal and stone through image analysis of texture features. 2007 IEEE International Workshop on Imaging Systems and Techniques-IST. https://doi.org/10.1109/ist.2007.379597
[8] Cheng, J., Wang, D.W., Yang, L.K., Zhang, M.L., Guo, Y.N. (2018). An improved Gaussian mixture model for coal gangue video detection. Journal of Central South University (Natural Science Edition), 49(1): 119-123.
[9] Zhang, C., Zhang, C.L. (2012). Coal gangue separation system based on density measurement. IEEE International Conference on Computer Science and Automation Engineering (CSAE)-Zhangjiajie, China. https://doi.org/10.1109/csae.2012.6272583
[10] He, M., Wang, P.P., Jiang, H.H. (2012). Recognition of coal and stone based on SVM and texture. Computer Engineering and Design, 03: 1117-1121.
[11] Qian, J.X., Li, Y. (2009). Application of image processing in coal gangue recognition system. Sichuan Journal of Military Engineering, 30(11): 15-20.
[12] Li Y.N., Lin, X.J., Chen, J.P., Chen, S.X. (2017). Defects identification for carbonization bamboos based on GLCM and SVM. Journal of Jimei University (Natural Science Edition), 22(3): 49-53.
[13] Tang, B., Kong, J.Y., Wu, S.Q. (2017). Review of surface defect detection based on machine vision. Chinese Journal of Image and Graphics, 22(12): 1640-1661.
[14] Chen, C.G., Ai, T. (2014). Statistical method of texture analysis based on grey level co-occurrence matrix. Journal of Tianjin Agricultural College, 21(2): 33-38.
[15] Raheja, J.L., Kumar, S., Chaudhary, A. (2013). Fabric defect detection based on GLCM and Gabor filter: A comparison. Optik, 124(23): 6469-6474. http://dx.doi.org/10.1016/j.ijleo.2013.05.004
[16] Arabi, P.M., Joshi, G., Deepa, N.V. (2016). Performance evaluation of GLCM and pixel intensity matrix for skin texture analysis. Perspectives in Science, 8: 203-206. http://dx.doi.org/10.1016/j.pisc.2016.03.018
[17] Xin, B.J., Yu, X.F., Wu, Z.P. (2011). Automatic identifying the woven fabric Pattern by image analysis technique. Journal of Donghua University (Natural Science Edition), 37(1): 35-41.
[18] He, L.F., Chao, Y.Y., Suzuki, K., Wu, K.S. (2009). Fast connected-component labeling. Pattern Recognition, 42(9): 1977-1987. http://dx.doi.org/10.1016/j.patcog.2008.10.013.
[19] da Silva, E.S., Pedrini, H. (2016). Connected-component labelling based on hypercubes for memory constrained scenarios. Expert Systems with Applications, 61: 272-281. http://dx.doi.org/10.1016/j.eswa.2016.06.002
[20] Kalentev, O., Rai, A., Kemnitz, S., Schneider, R. (2010). Connected component labeling on a 2D grid using CUDA. Journal of Parallel and Distributed Computing, 71(4): 615-620. http://dx.doi.org/10.1016/j.jpdc.2010.10.012