OPEN ACCESS
District heating (DH) is an increasingly exploited technology because of the possibility of integrating various high performance technologies fed by different source (including renewable). The research activity on optimal management of DH networks is still thriving because of the possibility to achieve high efficiency and increase exploitation of renewable energy sources and waste heat.
In this paper, a multi-purpose software for the optimal management of DH networks is propose and tested on a real network. The multi-purpose software has the aim of achieving optimal management on demand side. The main goals of the proposed platform are: a) making data automatically gathered in the substations, suitable for modelling purposes b) automatically detecting fouled heat exchanger c) forecasting of the thermal request evolution of the building and d) indicating how properly perform demand side management, taking into account the network dynamics. The approach presented relies on a) a physical description of the district heating network and b) data collected by the monitoring systems usually installed in the district heating substations for billing purposes.
For the first time in the author knowledge, a multi-purpose platform including demand side management and fouling detection is tested on a large-scale application. The software is based on methodologies developed in years of studies and has been tested on a part of the largest district heating network in Italy.
demand response, thermal network, optimization, sustainability, future energy systems
The fortune of DH technology is due to the possibility of using, for space heating and hot water production, instead of small combustors with low efficiency:
(1). high performances technologies, such as heat pumps [1-3] and cogeneration plants [4-5].
(2). Heat wasted from industrial applications [6-7].
(3). Renewable energy sources [8-9].
Several works in the literature show the interest for reaching higher performances and flexibility; among them are [10-12]. In particular, description for the next generation DH systems are proposed and described in various paper [13-15].
However when considering real networks, especially if large and dating back several years [16-18], these are often outdated. Changes in these kinds of network would allow saving energy as well as reducing pollutant emission, fuel consumption and energy costs. Nevertheless, modifications in large networks require great care because of their complexity, long distances involved and long transient due to the high water quantity within the pipelines.
Among the most significant problems in large DH systems are a) gaps between demand and supply, in particular in case of thermal peak occurrence and b) anomalies in heat exchanger operations.
Concerning the gap between demand and supply the main issue concerns peak load. This problem is crucial in Mediterranean areas where heating systems are off during the night in the morning the request dramatically rises. Effects of thermal peaks are multiple such as a) high pumping cost [12] b) large water velocity not allowing connection of further buildings [19] c) reduced possibility of plant selection (since most of them must be used to cover peaks) d) difficulties in managing malfunctions [20]. A common approach used for managing thermal peaks consists in using thermal storages, as shown in [21-24]. A different approach to achieve peak shaving is application of demand side management, also called demand response or virtual storage [25-27]. It consist in modifying the thermal request of the users by managing the setting or the schedule of heating systems in the building. This is interesting since avoid high costs and issues related to space availability typical of thermal storage installation.
Another crucial problem in large DH networks consists in preventing that heat exchangers works in abnormal conditions. One of the main causes of anomalies in substation heat exchanger is the fouling presence. Detection of fouling is a significant point to guarantee high DH system performances and comfort conditions within buildings. Performance in case of fouled heat exchanger significantly decreases [28].
In order to tackle these problems, different analysis have been proposed in the literature. Methods for monitoring DH substations are proposed in [29, 30], test for the exploitation of the building capacity to perform demand side management are carried out in [31, 32], analysis for the exploitation of network thermal capacity [33].
In this framework, we present here an intelligent multi-purposes platform, that has been applied to a large DH system (the largest in Italy and one of the largest in Europe). This consists in a software for network management, including different models:
(1). A platform for the data charging, pre-processing, and reorganization, that make them suitable for modelling purposes.
(2). A tool for the plot of the fouling level of all the heating system substations; this allows technician detecting fouled heat exchangers.
(3). A model for forecasting building thermal request evolution.
(4). A demand side management optimizer for evaluating the best heating system rescheduling with the aim of minimizing thermal peaks.
This is a summary of a considerable work lasted two years, including a) conception of ideas for the four steps discussed b) global system design c) implementation d) testing phase on the Turin DH network. The main strength of this work stand in the possibility of significantly improving the performances of a DH systems only relying on data that are usually available, i.e. data monitored for billing purposes.
Furthermore, in the author knowledge, for the first time a real application of demand response and fouling detection on a large scale DH system is tested. Results show that the global system for network management can provides reduction of peak (with current strong limitation) of 5 %, that can reach 30 % by relaxing these limitations and a correct detection of fouled heat exchanger with t consequent reduction of primary energy needs.
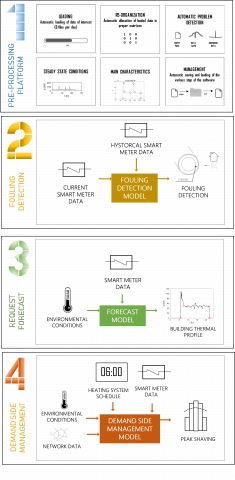
Figure 1. Smart DH manager description
The multi-purpose tool here presented is developed for being used automatically in large DH networks; for these reasons modelling approaches and implementation have be smart, fast and carefully planned. The smart prototype for network management includes four sub-tools. These are represented in Figure 1. The first part of the software (TOOL1) is a platform for the data pre-processing. This allows managing data measured in the thermal substations, in order to make them proper for being use in the subsequent steps. This is described in section 2.1. The second, TOOL 2, is an automatic detector of eventual fouled heat exchanger. TOOL 2 has two main goals. The first is to show the technician presence of fouled heat exchanger so that they can plan cleaning procedure, significantly improving performances of the DH system. The second is to exclude fouled heat exchangers from the following analysis since they behave abnormally. The third phase (TOOL 3) concerns the forecast of the thermal request evolution of each building. Knowledge of the forecasted load allows performing a series of operations, such as demand side managements, with a good level of accuracy. The last part include a demand side management model (TOOL 4), for modifying properly the user request evolution with the aim of obtaining a flatter network request by shaving thermal peaks.
2.1 Pre-processing platform
The pre-processing platform is often a necessary task for the applications that use data gathered from experimental test or data collection systems. In this case, this is done to make measured data suitable for modelling purposes. The pre-processing platform includes:
A tool for the automatic loading of the historical data of each substation. Data collected by the smart meters are mass flow rates and temperature measured each 5 minutes (as described in detail in section 3). Historical data, including a file for each day and for each quantity, are opened automatically in the pre-processing software. Files include data for 3 years. The first test of the platform developed has been done on 10 distribution networks (about 350 buildings); the amount of data in this case was of about 107.
An automatic model for reorganizing data in matrices, one for each quantity analyzed and one for each distribution network. The matrices have as many column as the number of building located in the distribution network and as many rows as the time considered for the analysis (depending on the time step selected and the considered period).
An automatic system for data gap managements; this is used to automatically evaluate data out of meaningful range, i.e. data gap, and fill them through proper interpolation.
Automatic evaluation of the quasi steady state condition, for each users and each day. Quasi steady state is a period of the day when the power supplied to the building is about constant since it is only affected by small oscillations. This is done since the analysis of heat exchanger fouling level should be done to during steady state operations (details in section 2.2). To this end, a routine has been used: the daily power evolution is scrolled until a time sufficiently long where the thermal demand varies little (less than a given tolerance) is found.
The automatic estimation of the main curve characteristics (see section 2.3) used to simplify the daily thermal request evolution; this is done to easily make the thermal request prediction. This step needs various precautions because of the measurement errors that sometime makes data evolution very different to the expected one.
A model for the automatic data saving in the proper format and folders for the automatic utilization in the following steps.
2.2 Fouling detection
Fouling detection is not straightforward in case no pressure measures are available. In case of DH substations, no pressure meters are usually installed. The research activity the authors developed had the main aim of evaluating of a quantity that can be used for the automatic detection of fouled heat exchanger. Various quantities have been tested before selecting the best one. The quantity used for detecting fouling should take into account the variation of the heat exchanged, depending on the external temperature (the higher the external temperature, the lower the heat exchanged). For this reason the relations among a quantity and a variable (heat exchanged or mass flow rate preprocessed) are used. The quantities are FUA, which is the product of the heat exchange area A, the global heat exchange coefficient U and the factor taking into account that the heat exchanger is not perfectly countercurrent and LMTD i.e. is the logarithmic mean temperature difference. Relation between the two quantities and the fouling factor are given in Eq. 1-2:
ϕ=F U A LMTD (1)
$FUA=\frac{1}{\frac{1}{A_ih_i}+\frac{Rf_1}{A_i}+\frac{s}{Ak}+\frac{Rfo}{A_o}+\frac{1}{A_oh_o}}F$ (2)
Among the most meaningful relations individuated are:
All these quantities have been evaluated by means of data gathered at the substation and processed in the pre-processing platform. All the four quantities cited allow detecting fouling presence, since in fouled condition UAF is expected to be smaller and NTU is expected to be larger. However, the evolution should be converted in a quantity that automatically can detect the fouling presence. For this reason, only one of them has been selected. This is FUA(ϕ) , since experimental analysis, reported in section 4.2, shown that is a quantity particularly suitable for the fouling detection.
Evaluation of the heat exchanger performances, for being meaningful, must be performed during steady state conditions. For this reason it is important creating a model that allows to extract data of the stationary condition during the day. This is done during the pre-processing stage, as described in section 2.1. The approach of scrolling the thermal request until a steady state condition is found, is used for each day, for each building in all the distribution networks. This allows obtaining a data set sufficiently high for getting a clean condition for each heat exchanger.
2.3 Demand forecast
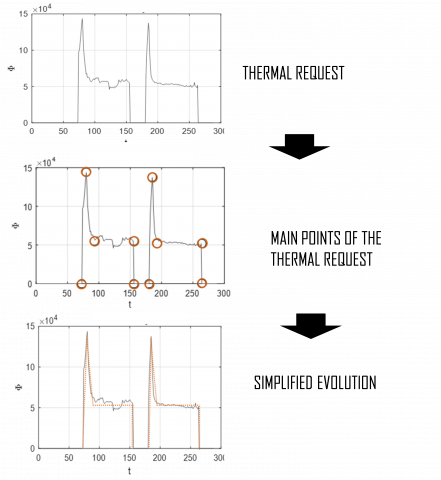
Concerning the demand forecast, this is based on the idea of identifying a series of the main points (main curve characteristics) of the thermal request evolution and predict the position of these points. The evaluation of the simplified evolution to get the main curve characteristics is depicted in Figure 2.
Figure 2. Thermal profile simplification
The procedure includes the following steps:
The reasons this approach is selected are: a) it robust and avoids errors due to long period of data gaps, b) it is simple since allows predicting the entire thermal evolution, by only predicting a limited number of quantities c) requires very low computational costs. It makes the model reliable, robust and suitable for large scale application.
Table 1. Main curve characteristics for the thermal profile simplification
|
Quantity |
Unit |
Evaluation |
|
maximum height of the peak |
kW |
maximum value of the data array |
|
steady-state heat request |
kW |
average heat request between the peak end and the switching off |
|
time from switching on to the peak request |
s |
routine algorithm (for detail see [34]) |
|
time from the peak request to the end of the peak |
s |
routine algorithm (for detail see [34]) |
The evaluation of the thermal request is done by means of a black box approach, constituted by a linear model, providing the main curve characteristics, given a set of input data (hereafter described). The model is trained by means of experimental data. More details are given in [34].
In order to define the inputs, i.e. the quantities more affecting the thermal profile evolution, a preliminary analysis have been carried out. A series of variables are selected on the basis of a literature review [35] and tested. The main quantities affecting the thermal request evolution are found to be:
Solar radiation I, humidity φ and wind intensity v are not taken into account for the model.
2.4 Demand side management
As in several other Mediterranean cities, the building heating systems are switched off at night and this causes a significant thermal peak in the morning. This causes a series of negative effects, discussed in the introduction section. In these cases, demand side management can be used with the aim of minimizing thermal peak amplitude. A simple but effective way consists in properly shifting the building thermal load by rescheduling the heating systems. This makes the occurrence of the various thermal peaks more distributed in time and the thermal load at the thermal plant flatter.
The evaluation of the best set of anticipation to be applied at building schedule is done by using an optimization approach. The independent variables of the optimization are the modification on the heating system schedule, i.e. the anticipation on the time they are switched on. The time anticipations are discrete, since the remote schedule control system acts with time step of 10 minutes. An heuristic approach has been used since this allows managing non-linear problems and avoid local optima. In particular, a genetic algorithm (GA), which was successfully applied in various fields [36-38], was selected.
An important aspect that must be addressed concerns the network dynamic. The best peak shaving has to be evaluated at plant level. The load at the plants is not the summation of the thermal requests in the buildings because of the thermal transient phenomena within the network [39]. These include the thermal losses between the pipelines, the time the water takes to travel the network, the mixing between various water streams, the thermal transients in the network, due to the large quantity of water in the pipes. These phenomena can be taken into account by means of a network model. In particular, in this work a one dimensional model, based on a graph approach is used to solve mass (Eq. 3), momentum (Eq. 4) and energy conservation equations (Eq. 5), applied to the entire network.
$A\cdot G+G_{ext}=0$ (3)
$G=Y\cdot A^T\cdot P$ (4)
$M\dot{T}+KT=g$ (5)
Momentum and mass problems can be solved as steady state since fluid-dynamic perturbations travel the network in a period of time smaller than the time step adopted for calculations (60 s). The thermal model instead is transient since it must consider the water variation that travel with the water velocity. Further detail and validation can be found in [40, 41].
The network model is thus used to evaluate the global heat request and it strongly depends on the load anticipation of the various buildings (independent variables). The set of anticipation providing the most significant peak reduction in the overall thermal request is found with the genetic algorithm optimizer. The optimization process provides the following information: a) the peak reduction that can be achieved b) the best time anticipation in each building.
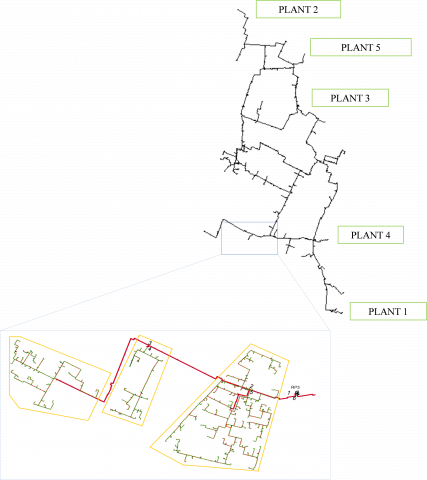
The Turin DHS is the largest in Italy and one of the largest in Europe supplying 60 million m3 of buildings, an annual thermal request of 2160 GWh with a maximum thermal load of 1.4 GW. A schematic of the system is shown in Figure 3.
Figure 3. Schematic of the DH network considered
The network can be divided into two main parts: the transportation network, connecting power plants with the various city areas, and several distribution networks, connecting the main pipeline to the buildings. The main pipeline and three up to 182 distribution networks are depicted in Figure 3. For the current test 10 up to 182 distribution networks have been considered.
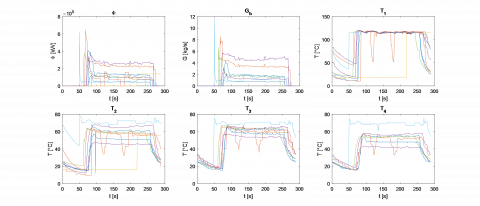
As described in section 2 the platform developed relies on data gathered at the DH substations. These are gathered by a system for measurements and automatic data collection installed in all the building substations. The metering system is characterized by temperature and mass flow rate meters installed at the inlet and outlet sections of the heat exchangers. Figure 4 shows the evolutions of temperatures at the inlet and outlet section of the heat exchanger, the mass flow rate on the primary side and the heat fluxes exchanged. Data in Figure 4 are referred to a typical winter day for an entire distribution networks. Mass flow rate and heat flux evolution clearly show the cause of the large thermal peak occurring in the morning: this is the large number of hours the heating systems are switched off in the night.
Figure 4. Evolution of data gathered by the substation meters
4.1 Pre-processing stage
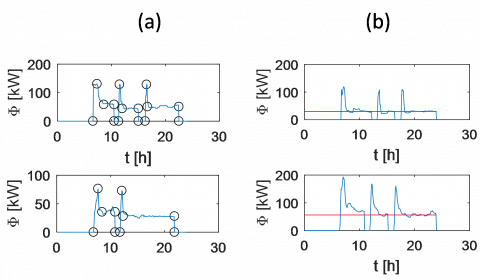
In this section, results related to the pre-processing stage have been reported. In particular Figure 1 shows the two main results of the platform.
Figure 1a depicts the outcomes of the automatic detection of the main curve characteristics. In particular, the figure depicts the thermal evolution in clue and, in black, the point detected.
Figure 1b shows results of the steady state condition evaluation, that is used for the fouling detection stage. The figure shows the thermal evolution in blue and, in red, the steady state condition.
Figure 5. Outcomes of the pre-processing platform: (a) main point of the thermal request evolution (b) steady state condition
The cases considered in Figure 5 have been randomly selected. It is evident that both the sub-platform used to get Figure 5(a) and (b) allows evaluating with an optimal level of approximation the quantities required.
4.2 Fouling detection
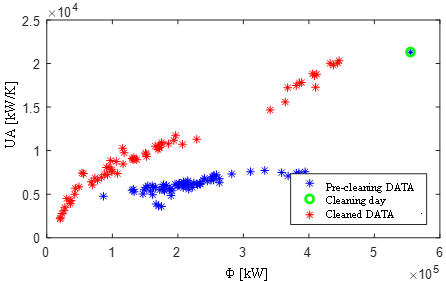
In this section, results related to fouling detection are reported. Figure 6 shows FUA as a function of thermal power exchanged, which is the quantity that has been selected among the ones reported in section 2.2. The slope of the tendency line is significantly different from clean to fouled heat exchanger. The strong difference between the two tendency lines can be easily detected by evaluation their slope. Comparing slopes of data collected when the heat exchanger was clean and slope of current data allows evaluating eventual criticalities. This makes this approach very suitable in order to detect fouling despite the strong variation of heat exchanged at the substation.
Figure 6. Experimental results for the fouling detection
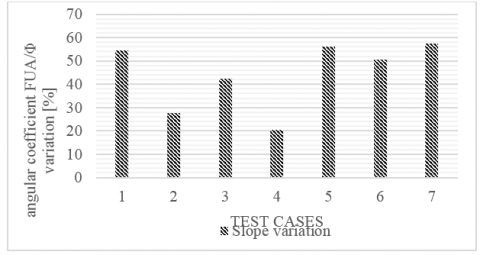
In the following graph, it is possible to notice the variation of the quantity FUA for various experimental test that have been performed in the Turin networks. Results show that variations between fouled and clean heat exchangers are always higher than 20 %. The variation of the slope FUA is particularly suitable for the detection of fouling since through an automatic procedure it is possible evaluating a value that quantify the amount of fouling level.
Figure 7. Slope variation of the interpolation line between clean and fouled heat exchanger
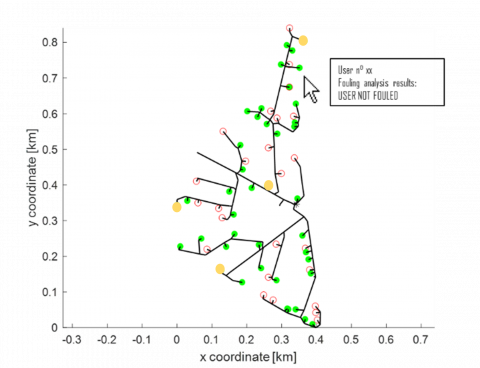
The selected quantity has been used with the aim of providing a system for the automatic map creation; this was made for the support of technician operations. Using results evaluated by means of the FUA(Φ) interpolation line, maps have been created where buildings are identified with colored points, depending on the fouling level of the heat exchanger. This is a valuable tool that can be used for saving energy and avoiding user complaints.
Figure 8. Screenshot of the tool for the heat exchanger fouling monitoring
4.3 Demand forecast
Forecast of the thermal request evolution through the main curve characteristics is here discussed. A comparison with measured data has been performed. The relative error achieved between predicted and measured values are between 8 and 14 % respectively for the steady state and peak request. Larger errors occurs at the beginning and in the end of the season, when thermal requests are low and although the absolute error is low, the relative error appears to be large. A more accurate analysis shows that of R2 is 0.95, higher than average values of works available in the literature (about 0.9) [27]. Because of the high variability of the load evolutions, simplicity of the model and eventual inaccuracy of in input data, these are significantly positive result.
4.4 Demand side management
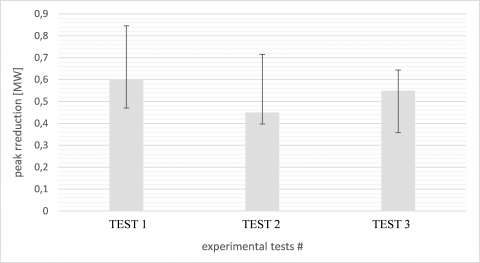
Demand side management is applied to the DH with the aim of minimizing the thermal peak requests. Figure 9 shows results of three experimental tests conducted in a distribution network of the DH system. Peak shaving in terms of thermal power reduction are depicted. Three tests have been performed in different days characterized by different weather conditions. In all the tests considered peak reduction between 0.4 and 0.6 MW are achieved for peak demand ranging from 7 and 10 MW. The error bar represents the range of peak reduction estimated by means of the simulation. The range has been obtained by considering the uncertainty of the input values and supply network dynamic. Peak shaving achieved are around 5-10 %.
Figure 9. Peak reduction achieved in the experimental tests
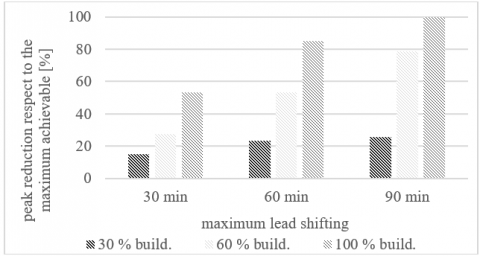
Results presented in Figure 9 have been obtained with specific limitations, since a) only a fraction of the heating systems can be subjected to demand response, (i.e. that having signed a specific agreement with company) b) only anticipation limited to 20 minutes are considered. In order to show peak reduction achievable with different fraction of buildings and various range of possible anticipation, Figure 10 is reported. Results show that, results strongly vary depending on the limitations. In particular, the percentage of building subjected to demand side management strongly affect the results. Compared to case where the maximum peak reduction is achievable (that has an assigned value of 100 %), with the same load shifting limitation, the benefit drop to 25 % if only 30 % of buildings are subjected to demand side management. These results show that high potential exists for application of demand side management for thermal peak shaving when modification can be done in a large number of buildings.
Figure 10. Potential for thermal peak reduction. Peak reduction fraction that can be obtain respect to the best case (100 % and 90 min)
Peak shaving bring significant benefits to the DH system since this allows connecting other buildings, reducing heat from heat only boiler (used for supplying peaks) and simplify the malfunction management.
In this work, authors present a multi-purposes platform, for the smart management of DH networks. The platform has been developed for being applied to large DH networks. The platform is the results of a two year activity spent for conceiving the modelling approaches, the platform design and carrying out the experimental tests. The prototype has been applied and tested on the Turin DH system. The platform is able to perform the following analysis:
(1). Charging, pre-processing, and reorganization, of the data collected by smart meters installed in the DH substations; this makes data suitable for modelling purposes.
(2). Automatic detection of the fouled heat exchangers in the DH substations and plot on a map of the most critical occurrence.
(3). Forecast of the building thermal request for the daily evolution.
(4). Demand side management for thermal peak shaving; this is done by optimally shifting thermal loads.
The proposed prototype only relies on data that are usually available in DH networks, i.e. data monitored for billing purposes. This enhance the applicability of the software to a large number of DH systems; this is very important since in the author knowledge, this represents the first complete application to a real network of a prototype for smart management including fouling detection, demand evaluation and demand side management. The software allows to significantly improve performances of DH systems, since reduction of peaks from 5 to 30 % can be achieved. Furthermore cleaning procedure allows saving primary energy since the return temperature are significantly lower. This makes DH technology more efficient.
Options for the future platform development, consist in including further blocks:
Model simulator to combine demand side management and thermal energy storage
Use of different types of regulation technologies with the aim of implementing not only load shifting but also a modification of the request shape.
Including delay or different rescheduling for the various part of the day.
This work has been conducted within the H2020 Project PLANET: Planning and operational tools for optimising energy flows & synergies between energy networks. Grant agreement 773839. https://www.h2020-planet.eu/. Authors thanks employers of IREN Company for the support and data.
|
A |
exchange area, m2 |
|
F |
Coefficient for non perfectly countercurrent heat exchangers, - |
|
G |
mass flow rate, kg.s-1 |
|
h |
convective heat transfer coefficient W.m-2. K-1 |
|
k |
thermal conductivity, W.m-1. K-1 |
|
K |
Stiffness matrix |
|
M |
Mass matrix |
|
Rf |
Fouling resistance, m2. K. W-1 |
|
T |
Temperature, K |
|
U |
Global heat exchange coefficient, W.m-2. K-1 |
|
|
|
|
Greek symbols |
|
|
f |
Thermal power, kW |
|
Subscripts |
|
|
ext |
From the extern |
|
i |
in |
|
o |
out |
[1] Li Y, Fu L, Zhang S, Zhao X. (2011). A new type of district heating system based on distributed absorption heat pumps. Energy 36(7): 4570-4576. http://doi.org/10.1016/j.energy.2011.03.019
[2] Sciacovelli A, Guelpa E, Verda V. (2014). Multi-scale modeling of the environmental impact and energy performance of open-loop groundwater heat pumps in urban areas. Applied Thermal Engineering 71(2): 780-789. http://doi.org/10.1016/j.applthermaleng.2013.11.028
[3] Lindenberger D, Bruckner T, Groscurth HM, Kümmel R. (2000). Optimization of solar district heating systems: seasonal storage, heat pumps, and cogeneration. Energy 25(7): 591-608. http://doi.org/10.1016/S0360-5442(99)00082-1
[4] Lindenberger D, Bruckner T, Groscurth HM, Kümmel R. (2000). Optimization of solar district heating systems: seasonal storage, heat pumps, and cogeneration. Energy 25(7): 591-608. http://doi.org/10.1016/S0360-5442(99)00082-1
[5] Casisi M, Pinamonti P, Reini, M. (2009). Optimal lay-out and operation of combined heat & power (CHP) distributed generation systems. Energy 34(12): 2175-2183. http://doi.org/10.1016/j.energy.2008.10.019
[6] Sun F, Fu L, Sun J, Zhang, S. (2014). A new waste heat district heating system with combined heat and power (CHP) based on ejector heat exchangers and absorption heat pumps. Energy 69: 516-524. http://doi.org/10.1016/j.energy.2014.03.044
[7] Fang H, Xia J, Jiang Y. (2015). Key issues and solutions in a district heating system using low-grade industrial waste heat. Energy 86: 589-602. http://doi.org/10.1016/j.energy.2015.04.052
[8] Lund H, Mathiesen BV. (2009). Energy system analysis of 100 % renewable energy systems—The case of Denmark in years 2030 and 2050. Energy 34(5): 524-531. http://doi.org/10.1016/j.energy.2008.04.003
[9] Lund H. (2005). Large-scale integration of wind power into different energy systems. Energy 30(13): 2402-2412. http://doi.org/10.1016/j.energy.2004.11.001
[10] Laajalehto T, Kuosa M, Mäkilä T, Lampinen M, Lahdelma R. (2014). Energy efficiency improvements utilising mass flow control and a ring topology in a district heating network. Applied Thermal Engineering 69(1-2): 86-95. http://doi.org/10.1016/j.applthermaleng.2014.04.041
[11] Sciacovelli A, Guelpa E, Verda V. (2013). Pumping cost minimization in an existing district heating network. ASME 2013 International Mechanical Engineering Congress and Exposition 6A (15-21): V06AT07A066, 7. http://doi.org/10.1115/IMECE2013-65169
[12] Steer KCB, Wirth A, Halgamuge SK. (2011). Control period selection for improved operating performance in district heating networks. Energy and Buildings 43(2-3): 605-613. http://doi.org/10.1016/j.enbuild.2010.10.029
[13] Lund H, Werner S, Wiltshire R, Svendsen S, Thorsen JE, Hvelplund F, Mathiesen BV. (2014). 4th Generation District Heating (4GDH): Integrating smart thermal grids into future sustainable energy systems. Energy 68: 1-11. http://doi.org/10.1016/j.energy.2014.02.089
[14] Rismanchi B. (2017). District energy network (DEN), current global status and future development. Renewable and Sustainable Energy Reviews 75: 571-579. http://doi.org/10.1016/j.rser.2016.11.025
[15] Suciu R, Girardin L, Maréchal F. (2018). Energy integration of CO2 networks and power to gas for emerging energy autonomous cities in Europe. Energy 157: 830-842. http://doi.org/10.1016/j.energy.2018.05.083
[16] Levihn F. (2017). CHP and heat pumps to balance renewable power production: Lessons from the district heating network in Stockholm. Energy 137: 670-678. http://doi.org/10.1016/j.energy.2017.01.118
[17] Alexandrov GG, Ginzburg AS. (2018). Anthropogenic impact of Moscow district heating system on urban environment. Energy Procedia 149: 161-169. https://doi.org/10.1016/j.egypro.2018.08.180
[18] Dorfner J, Hamacher T. (2014). Large-scale district heating network optimization. IEEE Trans. Smart Grid 5(4): 1884-1891. http://doi.org/10.1109/TSG.2013.2295856
[19] Guelpa E, Mutani G, Todeschi V, Verda V. (2018). Reduction of CO2 emissions in urban areas through optimal expansion of existing district heating networks. Journal of Cleaner Production 204: 117-129. http://doi.org/10.1016/j.jclepro.2018.08.272
[20] Guelpa E, Verda V. (2018). Model for optimal malfunction management in extended district heating networks. Applied Energy 230: 519-530. http://doi.org/10.1016/j.apenergy.2018.08.024
[21] Bo H, Gustafsson EM, Setterwall F. (1999). Tetradecane and hexadecane binary mixtures as phase change materials (PCMs) for cool storage in district cooling systems. Energy 24(12): 1015-1028. http://doi.org/10.1016/s0360-5442(99)00055-9
[22] Sibbitt B, McClenahan D, Djebbar R, Thornton J, Wong B, Carriere J, Kokko J. (2012). The performance of a high solar fraction seasonal storage district heating system–five years of operation. Energy Procedia 30: 856-865. http://doi.org/10.1016/j.egypro.2012.11.097
[23] Sciacovelli A, Guelpa E, Verda V. (2014). Second law optimization of a PCM based latent heat thermal energy storage system with tree shaped fins. International Journal of Thermodynamics 17(3): 145-154. http://doi.org/10.1016/j.apenergy.2014.07.015
[24] Verda V, Colella F. (2011). Primary energy savings through thermal storage in district heating networks. Energy 36(7): 4278-4286. http://doi.org/10.1016/j.energy.2011.04.015
[25] Guelpa E, Deputato S, Verda V. (2018). Thermal request optimization in district heating networks using a clustering approach. Applied Energy 228: 608-617. https://doi.org/10.1016/j.apenergy.2018.06.041
[26] Capone M, Guelpa E, Verda V. (2019). Optimal operation of district heating networks through demand response. International Journal of Thermodynamics (IJoT) 22(1): 35-43. https://doi.org/10.5541/ijot.519101
[27] Verda V, Guelpa E, Sciacovelli A, Acquaviva FG, Patti A. (2016). Thermal peak load shaving through users request variations. International Journal of Thermodynamics 19(3): 168-176.
[28] Guelpa E, Deputato S, Verda V. (2018). Analysis of the heat exchanger fouling in large district heating networks. Proceeding at ECOS conference, Guimaraesh, pp. 17-22.
[29] Gustafsson J, Delsing J, Deventer VJ. (2010). Improved district heating substation efficiency with a new control strategy. Applied Energy 87(6): 1996-2004. http://doi.org/10.1016/j.apenergy.2009.12.015
[30] Wang Y, You S, Zhang H, Zheng X, Wei S, Miao Q, Zheng W. (2017). Operation stability analysis of district heating substation from the control perspective. Energy and Buildings 154(1): 373-390. https://doi.org/10.1016/j.enbuild.2017.08.034
[31] Ingvarson OL, Werner S. (2008). Building mass used as short-term heat storage. In 11th International Symposium on District Heating and Cooling, Reykjavik, Iceland, August 31–September 2, 2008.
[32] Kensby J, Trüschel A, Dalenbäck JO. (2015). Potential of residential buildings as thermal energy storage in district heating systems–results from a pilot test. Applied Energy 137: 773-781. http://doi.org/10.1016/j.apenergy.2014.07.026
[33] Korpela T, Kaivosoja J, Majanne Y, Laakkonen L, Nurmoranta M, Vilkko M. (2017). Utilization of district heating networks to provide flexibility in CHP production. Energy Procedia 116: 310-319. http://doi.org/10.1016/j.egypro.2017.05.077
[34] Guelpa E, Marincioni L, Capone M, Deputato S, Verda V. (2019). Thermal load prediction in district heating systems. Energy 176(1): 693-703. https://doi.org/10.1016/j.energy.2019.04.021
[35] Zhao HX, Magoulès F. (2012). A review on the prediction of building energy consumption. Renewable and Sustainable Energy Reviews 16(6): 3586-3592. http://doi.org/10.1016/j.rser.2012.02.049
[36] Kumar M, Husian M, Upreti N, Gupta D. (2010). Genetic algorithm: review and application. Int. J. Inf. Technol. Knowl. Manag 2(2): 451-454.
[37] Tiene S, Bragadin MA, Ballabeni A. (2018). A genetic algorithm-based approach for project management and developed design of construction. TECHNE-Journal of Technology for Architecture and Environment 16: 131-141. http://dx.doi.org/10.13128/Techne-23027
[38] Guelpa E, Sciacovelli A, Verda V, Ascoli D. (2016). Faster prediction of wildfire behaviour by physical models through application of proper orthogonal decomposition. Int. J. Wildland Fire 25(11): 1181-1192. http://doi.org/10.1071/WF15150
[39] Guelpa E, Marincioni L, Verda V. (2019). Towards 4th generation district heating: Prediction of building thermal load for optimal management. Energy 171: 510-522. https://doi.org/10.1016/j.energy.2019.01.056
[40] Guelpa E, Sciacovelli A, Verda V. (2017). Thermo-fluid dynamic model of large district heating networks for the analysis of primary energy savings. Energy. https://doi.org/10.1016/j.energy.2017.07.177
[41] Guelpa E, Verda V. (2019). Compact physical model for simulation of thermal networks. Energy 175(15): 998-1008. https://doi.org/10.1016/j.energy.2019.03.064