OPEN ACCESS
Acceptance, meant as a social issue, plays a fundamental role on different levels in the effective integration of technological innovations into building heating systems. Many efforts have been made in previous studies to understand the key indices and indicators of acceptance, used to improve the agreement of people towards the considered innovation and widen its use. In Italy many laws have come into force with the target of increasing the level of acceptance of renewable plants in terms of affordability and economic benefits.
The paper reports the Authors’ experience in a specific application of solar assisted heat pump designed and built to provide up to the 70 % of the heating energy needs of Palacus sports center in Genoa, Italy. A voluntary passage from the heat pump heating mode to the classical burner has been noticed most of times when a technical action on the plant was required, despite of the well-known pollution and environmental impact. These difficulties can be overcome easily, working not on how people could better manage the innovative, not user-friendly plants, but on how the plant automation could satisfy the end-users’ needs minimizing their intervention at affordable costs.
acceptance, control, monitoring
Acceptance can be conceived as a general agreement that something is satisfactory or right [1]. Many observations can be drawn from this definition: no specific field is mentioned so this concept can be easily applied to many possible areas, including technology, products or policies. As far as this paper is concerned, emphasis will be payed to the acceptance linked to technologies in the civil buildings heating systems: progresses have been made both in terms of technological development and cultural background of the population, but renewable energies still are not end-users’ first choice, despite of their well-known benefits. Furthermore, the term “general” points out that people or inhabitants of a specific region are involved with their opinion which can be (and usually is) different from factual measured outcomes. People express whether they are ready or feel comfortable to accept a certain facility in their neighborhood regardless of rational judgements. This is the reason why acceptance will be here referred to as “social acceptance”.
Another important remark is concerned with the distinction, not globally agreed by every Author, between acceptance and acceptability: the latter considers the judgement of experts as to whether the construction of a facility (e.g. a power plant or transmission line) is a reasonable burden under rational consideration of quantifiable criteria (e.g. health impact or noise) [2-3].
Many Authors have conceived social acceptance as the mix of the socio-political, community and market aspects. In this paper a resume on these three categories will be proposed; an innovative point of view concerning the technological aspects on acceptance is presented [4].
1.1 Socio-political acceptance
Only economic and environmental evaluations may not be enough to tell whether a technology will be embraced by the inhabitants, apart from technical, economic and legal aspects [5-8]. The socio-political acceptance represents how political events influence people’s acceptance. Following Wüstenhagen’s distinction, this kind of acceptance is focused on a wider scale, at the level of Countries. Many studies suggested that public attitudes are not stable and change over time influencing the correct integration and success of a project. A survey on the socio-political acceptance of nuclear power plants was carried out in Switzerland before the nuclear disaster in Japan. The repetition of the survey after the Fukushima disaster involving 70 % of the former participants showed a rough decrease in the acceptance of nuclear power.
1.2 Community acceptance
It refers to the specific acceptance of siting decisions and renewable energy projects by local stakeholders and authorities or residents. The so-called NIMBY (Not-In-My-Back-Yard) phenomenon belongs to the community acceptance. It is an attitude to which are usually referred to those people who might accept the new project (e.g. devices associated to renewable energies), given the place of construction is far away from their home or community. The NIMBY mood can be described as a form of local opposition to a facility siting [9-11]. It interprets the strong local opposition as a selfish, irrational reaction by people living in the physical proximity of new energy developments. They acknowledge that the facilities are necessary, but not near their homes [12]. Recent research has changed the NIMBYism and outlined a different framework that changes the perspective from material aspects to the iconic nature of places: negative local attitudes toward facilities are due to prejudicial people’s interpretation, for instance as a threat to place identity [13]. This kind of acceptance depends on how the inhabitants of the affected places perceive the developments as aligned with their feelings and relationships to those places.
1.3 Market acceptance
Market acceptance concerns the level of economic approval of an innovation, product or facility through its adoption [4]. Namely, market acceptance is people’s trust in a product and it is reflected by a widespread willingness to invest in or acquire it. This general compliance shifts from a mere passive consent on the small scale to an active one on larger levels. An important distinction between market acceptance and the NIMBYism has become necessary: the former approaches the topic only from an economical point of view while the latter concerns the social sphere. Market acceptance is untied to the previous couple: given that people agree both with the relevance attributed to the renewable plants (socio-political acceptance) and the possibility of domestic installation (community acceptance), these innovations might not satisfy the cost-benefit analysis (market acceptance). This example has a frequent occurrence: the transition from fossil carbon installations has a high initial cost which affects negatively the level of market acceptance of the projects.
1.4 Technological acceptance
According to the Authors, the above-mentioned different types of acceptance neglect the technical level. The use of advanced devices is often not so straightforward or intuitive, so that the end-user prefers the use of well-known traditional systems.
The fear or mistrust towards technological innovation, coupled with the instinctive belief that old devices always perform better, is a very ordinary human attitude. This common place can be partially agreed, in case of experimental devices, since the tools might be not optimized and can be subjected to unexpected failures. On the contrary, mistrust towards commercial renewable energy systems is totally irrational as their Technological Readiness Level (TRL) has reached almost its maximum value. The problem is highlighted by the co-existence in civil houses of fossil fuel heating systems and renewable energy installations, since a switch to the traditional heating system is always possible. Technological acceptance represents users’ reluctance towards the employment of new technologies due to the frequent lack of knowledge. Often people refuse to learn how to manage a new system and they are not compelled to. A low level of technological acceptance isn’t a good reason to abandon advanced technology applications, but a motivation to adopt new regulation criteria and plant monitoring.
Some Authors formulated a model which tried to consider the aspects qualitatively discussed above including technological issues. The Technology Acceptance Model (TAM), developed by Davis [16], tried to connect the factors that cause the failures of systems and technology spread through the introduction of three factors: perceived ease of use, perceived usefulness and attitude toward the use of the technology. This model and its further developments always base on personal opinions. The technological acceptance here proposed is conceptually different from Davis’, since it is focused on objective and measured parameters.
Standard parameters to express acceptance are a very difficult task to cope with. As far as the papers and studies analysed are concerned, there are several indicators (mainly with a qualitative approach), linked to people’s feelings and emotions. On the other hand, few papers attempt to introduce indices, associated to quantitative analyses. What underpins the indices introduced by other Authors is the implicit dependence on economic quantities which only add a further degree of uncertainty. This approach tries to highlight the issue of market acceptance, overshadowing the community, technological and socio-political ones. Generally, the application of existing indices and indicators is not very straightforward, since a connection between subjective feeling and objective measure is a tough task. This proves how a genuine understanding of the dynamics of public acceptance remains elusive.
2.1 Indicators
There is a significant number of parameters that can be considered as measurable variables: time, anxiety, perceived adaptability, perceived enjoyment, perceived sociability, social influence, culture, perceived case of use, system’s reliability and trust [17-20]. Three basic indicators focused on subjectivity have been identified, among the papers, to express the fundamental physical magnitudes of the problem. An appropriate combination can express every other more sophisticated, above-mentioned indicator.
(1) Perception: meant as psychological and physical possible health implications of the technologies. New sensory information can change the perception which can be based on a belief, an attitude, a feeling or on knowledge. In terms of hierarchy, fear shows its importance involving safety and survival.
(2) Fairness: the outcomes from the process might benefit part of the community at the perceived expense of others. It depends on the definition, information and management of risks [21].
(3) Knowledge: it evaluates not the real cultural level but how much people feel to know. Its influence on the other parameters is evident, for instance a well-known facility might be perceived as fairer.
2.2 Methodology
Every public opinion research has been carried out by means of phone interviews or by mail, face to face interviews, field observations, web-based questionnaires. Factors determining the choice of the data collection method included type of information needed, ease of data standardization, representativeness, staff requirement, time constraints and costs. The interviews also considered participants’ education, personal income, gender, age, marital status and economic or cultural level to put the results into context [22-23].
The research questions are addressed to a very wide range of people and this requires a concise, clear and simple formulation. This need in turn implies a general formulation with a further implicit dependence on subjectivity associated to how the researcher conceives and interprets the results. Every person answering might have a different interpretation of brief questions concerning concepts such as “being aware”, “feeling comfortable”.
The problem can be coped with three main strategies:
i) knowledge, ii) regulation, iii) automation and domotics (IoT, Internet of Things or IT Information Technology).
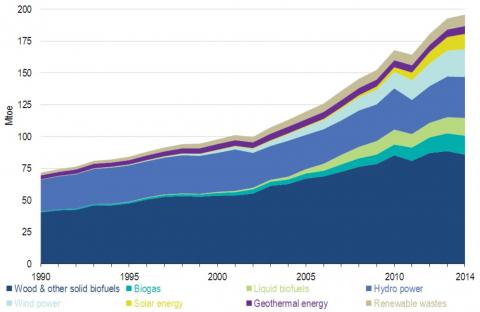
As far as knowledge is concerned, an appropriate confidence with the innovative technologies should be always granted. Nevertheless, renewable energies have been a relevant topic at any level (newspapers, books, papers) for about half a century and still many people are not confident with them, as shown by statistics available on the web [24]. The graph of Figure 1 shows that an effective increase in the renewable installations over Europe (e.g. solar) has taken place only in recent decades. This evidence reveals a general bad level of diffusion, inferring limited acceptance, apart from the increase of people’s cultural level and all the initiatives by Governments and various associations to promote renewable energy in the eyes of the population.
Figure 1. European energy sources trend during the last decades; the increase from early years 2000 is evident
Furthermore, there is a great difference between having an overview over such a complex topic and being capable to manage any intervention about energy audits and renewable installations. Knowledge alone will never be sufficient to overcome the problem, but it can represent a good initial point.
Regarding regulation aspects, often the rejection of an innovation is linked to negative economic cost-benefit analysis. Again, referring to the trend shown in the graph of Figure 1, its explanation in terms of inhabitants’ confidence only would be too superficial and abrupt. The economic aspect always plays an important role in the diffusion of innovating devices. Economic parameters, such as simple pay-back period, would reveal the need of operating periods longer than the working life of the installation itself. Small innovative installations not involved in academic or industrial processes would hardly be chosen by common people. This is the reason why in Italy and in many European Countries the laws, come into force within the last decades, give economic incentives in terms of tax relieves to overcome the high initial cost of innovative plants.
The financial incentive approach is usually not sufficient to assure renewable energy applications to be effectively employed. Recognizing the great environmental impact linked to fossil fuels energy sources, mandatory laws oblige end-users to install renewable energy plants. For instance, in Italy, there is a body of laws asking for fixed percentages of different renewable energy installations in each new building.
A further improvement recently introduced in Italy is represented by the credit assignment. The tax relief granted to anyone who faces the costs of energy efficiency refurbishment (up to 70 % of the total expenses) can be sold to a third-party society, for instance an ESCO (Energy Service COmpany), in exchange for an immediate financial contribution to the intervention. The advantage for the end-users consists in receiving immediately back part of the tax relief in the form of a discount on the total cost of the investment. The remaining part becomes a long-term additional income for the ESCO taking care of the refurbishment intervention (over a period of about 10 years). This policy is designed to involve an extended percentage of the population who pays very little tax and cannot deduct this relief or has a lease of life too short to be interested in this kind of investments.
Another step forward this policy is represented by the “ren-on-bill” action. This new approach excludes direct economic end-users’ interventions as the aforementioned ESCOs directly pay for the entire refurbishment in buildings, gaining the credit in terms of tax relief. The potential reduction of the costs of the energy bills doesn’t occur immediately to amortize the part of the investment not tax deductible. In other words, with an almost constant or lower cost of the energy bill, the end user benefits of a gain in comfort without any direct economic effort [25]. Nevertheless, long term financial analyses have drawbacks too, linked to the weak stability of the political line of the government or of the energy markets, which often leads to changes in regulations and amortization schedules.
The third and last way here mentioned to increase the level of acceptance of renewable installations in civil constructions is associated to control automation and information technology. Nowadays such a large class of issues is often referred to as IoT (Internet of Things) or AAL, (Ambient Assisted Living). This last strategy gives a different perspective of the problem: a working and efficient plant is always associated to a very high level of acceptance, independently from its complexity and provided that the good performance of the plant doesn’t involve the end users’ intervention. For instance, the radiator thermostatic valves belong to this topic. They can keep the temperature inside the rooms at a fixed level (within a very little tolerance) with a regulation of the flow rate of hot water inside the radiators.
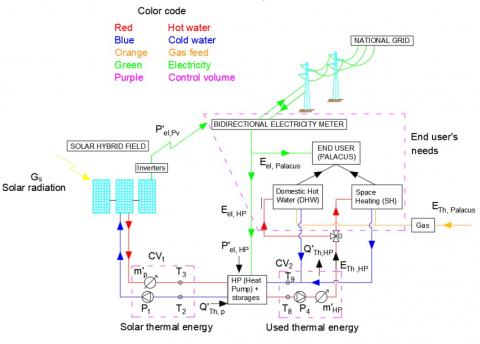
Figure 2. block diagram of the SAHP-PVT pilot plant installed at Palacus sports center in Genoa
This working criterion starts to fail whenever a steep decrease in temperature is measured: this might be a users’ response to an excessively hot environment who decides to open a window. In terms of needs this represents a situation in which the heat flow rate should be stopped fast, even if a negative temperature slope has been measured. This “smarter” response requires an integration, with respect to the classical thermostatic valve, to measure both temperature and its derivative, introducing the need of additional regulation and monitoring criteria (in this specific case a cut-off based on the value of the time derivative of temperature).
The IoT approach makes innovative plants appear more reliable for the end users, since their intervention is needed only in extreme cases, or to give simple, general rules of plant management. On the other hand, the IoT approach always lacks an economic, direct income.
It is true that on the long period these improvements allow substantial savings in terms of money, but they always imply an initial significant capital investment, not always affordable for everyone.
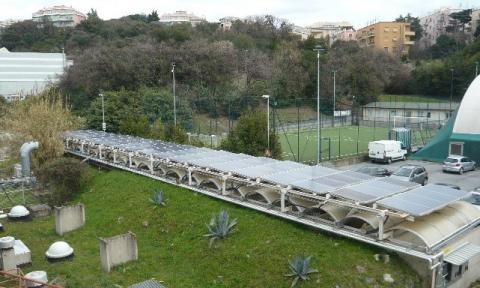
The Solar Assisted Heat Pump with hybrid Panels SAHP-PVT (Figure 3) is an interesting example of coupling fossil and renewable energies, where the problem of acceptance hampers the full potential of the installation.
Figure 2 is a schematic representation of the plant; for sake of simplicity, only the valves and sensors relevant for the current paper are shown. Papers [26-28] provide a deeper and complete insight of the plant with analysis of its optimization. The trapezoidal purple dotted line represents the end-user’s side (Palacus), with its energy needs (electricity, DHW, SH). This control volume includes exchange of electricity with the PV field and the national electrical grid, by means of a bidirectional meter to account for electrical energy delivered to the grid when the energy produced is not consumed by the Heat Pump (HP). The correct working of inverters is controlled by a specific signal which flags on in case of failure or malfunction, in particular in the case of lack of connection between the panels and the grid. This signal helps to know the period over which panels have been connected and worked correctly.
Figure 3. Solar field of Palacus plant
The remaining couple of control volumes is provided with sensors which can appreciate pumping operation, temperature and mass flow rate. Each volume has a pumping system, provided with a counter to record the actual working hours (Δτop).
The following control volume energy balances can be considered:
- Thermal solar energy: the solar heat rate entering the cold-water storage (not shown in Figure 2) of the HP can be expressed (neglecting the heat capacity of the pumping and auxiliary systems) as:
${{\dot{Q}}_{Th,p}}=m_{p}^{'}{{c}_{p}}({{T}_{3}}-{{T}_{2}})$ (1)
where, $m_{p}^{'}$, T3, T2 are the quantities shown in Figure 2 representing water flow rates and inlet-outlet temperatures from the solar panels as a function of time.
And the related thermal energy (Th) computed integrating over the maximum operating time Δτtot :
${{E}_{Th,sol}}=\int_{0}^{\Delta {{\tau }_{tot}}}{{{{\dot{Q}}}_{Th,p}}(\tau )}d\tau $ (2)
- Used thermal energy: The associated heat rate exchanged on the hot-water storage side (not shown in Figure 2) of the HP is:
${{\dot{Q}}_{Th,HP}}=m_{HP}^{'}{{c}_{HP}}({{T}_{8}}-{{T}_{9}})$ (3)
And the related energy computed integrating over operating time (Δτtot):
${{E}_{Th,HP}}=\int_{0}^{\Delta {{\tau }_{tot}}}{{{{\dot{Q}}}_{Th,HP}}(\tau )}d\tau $ (4)
According to the scheme here presented, two families of new parameters can be introduced:
- End-users parameters: they quantify the exploited energy or working hours with respect to the required or possible ones.
C1 (operating hours parameter): it is expressed in terms of working hours of the SAHP-PVT with respect to the total service time amount Δτtot. It can be expressed both in terms of photovoltaic (PV) and thermal (Th) field. Δτwork is measured as the periods over which no alarm signal is recorded.
${{C}_{1,PV}}=\frac{\Delta {{\tau }_{work,PVT}}}{\Delta {{\tau }_{tot}}}$ (5)
${{C}_{1,Th}}=\frac{\Delta {{\tau }_{work,SAHP}}}{\Delta {{\tau }_{tot}}}$ (6)
In Eq. (5) $\Delta {{\tau }_{work,PVT}}$ is equal to the duration of time periods during which the PVT field is connected to the grid in standard conditions. In Eq. (6), $\Delta {{\tau }_{work,SAHP}}$ is the period during which the SAHP system is working properly with P4 activated whenever the working temperatures are appropriate.
C2 (energy fraction of user needs covered by renewable solar energy): its formulation involves the ratio between the net available energy from the pilot plant and the energy consumed by Palacus measured by the gas and electricity bills. A distinction between photovoltaic and thermal solar can be introduced as shown by the formulas below.
${{C}_{2,PV}}=\frac{{{E}_{PV}}-{{E}_{el,HP}}}{{{E}_{el\_consump\_palacus}}-{{E}_{el,HP}}}$ (7)
${{C}_{2,Th}}=\frac{{{E}_{Th}},sol}{{{E}_{el\_consump\_palacus}}}$ (8)
where, ${{E}_{PV}}$ is the energy obtained from the photovoltaic field; ${{E}_{el,HP}}$ is the electrical energy consumed by the heat pump; ${{E}_{el\_consump\_palacus}}$ and ${{E}_{Th\_consump\_palacus}}$ represent the end user’s needs, respectively the electrical and thermal ones.
Generally, low C1 and C2 parameters may imply a low level of the facility usage, its temporary stop for maintenance or a breakage. Anyhow, each motivation above can be interpreted as a symptom of a low level of acceptance: the end user’s refusal of the plant will contribute to the general malfunctioning of the plant itself affecting also its theorical effectiveness. C2,PV is the only parameter that can assume negative values. This means that the electricity produced by the photovoltaic panels is not always sufficient to cover the need of the HP; in other words, electricity from the national grid is drawn.
- Plant efficiency parameters: essentially, they are meant to express the ratio between monitored and potential production. They can be resumed by
Seasonal Coefficient of Performance (SCOP)
$SCOP=\frac{{{E}_{Th,HP}}}{{{E}_{el,HP}}}$ (9)
${{E}_{Th,HP}}$ is the thermal energy produced by the heat pump;
${{E}_{Th,HP}}=\int_{0}^{\Delta {{\tau }_{tot}}}{{{m}^{'}}_{HP}{{c}_{HP}}({{T}_{8}}-{{T}_{9}})d\tau }$ (10)
where, ${{m}^{'}}_{HP}$, ${{T}_{8}},{{T}_{9}}$ are the quantities shown in Figure 2 representing water flow rates and inlet-outlet temperatures from the heat pump as a function of time.
${{E}_{el,HP}}$ is the electrical energy consumed by the heat pump,
${{E}_{el,HP}}=\int_{0}^{\Delta {{\tau }_{tot}}}{{{P}_{el.HP}}(\tau )}d\tau $ (11)
with, Pel,HP electrical power consumed by the heat pump over time.
This quantity loses its significance without adequate monitoring systems to achieve an extended data-collection. Nevertheless, SCOP can be considered representative of the plant performance during its actual working hours.
A second meaningful parameter is the mean seasonal solar panel efficiency, SηP. The quantity here proposed is referred to the interface between the solar field and the HP system on the “cold side”
$S{{\eta }_{P}}=\frac{\sum\nolimits_{i=1}^{N}{\int_{0}^{\Delta {{\tau }_{i}}}{{{\eta }_{Pi}}(\tau )G(\tau )d\tau }}}{\sum\nolimits_{i=1}^{N}{\int_{0}^{\Delta {{\tau }_{i}}}{G(\tau )d\tau }}}=\frac{\sum\nolimits_{i=1}^{N}{\int_{0}^{\Delta {{\tau }_{i}}}{m_{_{p}{{c}_{p}}}^{'}}}({{T}_{3}}-{{T}_{2}})d\tau }{A\sum\nolimits_{i=1}^{N}{\int_{0}^{\Delta {{\tau }_{i}}}{G(\tau )d\tau }}}$ (12)
where
${{\eta }_{Pi}}(\tau )=\frac{\int_{0}^{\Delta {{\tau }_{i}}}{m{{'}_{p}}{{c}_{p}}({{T}_{3}}-{{T}_{2}})d\tau }}{A\int_{0}^{\Delta {{\tau }_{i}}}{G(\tau )d\tau }}$ (13)
N counts the number of time-periods Δτi in which the pump P1 is working;
G(τ) is the irradiance; $m_{p}^{'}$, T3, T2 are the quantities shown in Figure 2 and described before representing water flow rates and inlet-outlet temperatures from the solar panels as a function of time.
A third and last parameter is here proposed:
${{C}_{3}}=\frac{\sum\nolimits_{i=1}^{N}{\int_{0}^{\Delta {{\tau }_{i}}}{{{\eta }_{Pi}}(\tau )G(\tau )d\tau }}}{S{{\eta }_{P}}\int_{0}^{\Delta {{\tau }_{tot}}}{G(\tau )d\tau }}=\frac{\sum\nolimits_{i=1}^{N}{\int_{0}^{\Delta {{\tau }_{i}}}{m{{'}_{p}}{{c}_{p}}({{T}_{3}}-{{T}_{2}})d\tau }}}{S{{\eta }_{P}}A\int_{0}^{\Delta {{\tau }_{tot}}}{G(\tau )d\tau }}$ (14)
where, SηP is the quantity expressed in Eq. (10). It might be confused with the seasonal COP, but the difference between these two parameters is concerned with the denominator: while the SCOP is referred to the available irradiance during the pump operating period, C3 depends on the total, irradiance available according to the performance of the panels installed without accounting for the pump working period. As a consequence, C3 can be seen as complementary to the parameter C1,Th.
The definitions above only depend on measured quantities and it can be easily implemented once seasonal datasets over time are available.
Both families of parameters here defined are not based on technical analyses: they just compare the maximum, possible production as a function of what has been actually produced. This analysis should be led a step before the considerations on efficiency: beside of any optimization, the plant must work to be efficient.
In this paper the issue of acceptance has been investigated, discussing the main aspects usually introduced in the scientific literature. A brief critical analysis about the metering methodology has been carried out, highlighting the difficulty to achieve quantitative parameters and the limited value of questionnaires and face-to-face interviews reporting respondents’ feelings and opinions. The case study of “Palacus” has been studied as an example related to acceptance.
Literature indices require large heterogeneous database in terms of age, gender and cultural background to have a set of data statistically meaningful. These conditions originate from the need to simulate a population of users of the facility.
The metering approach introduced in this paper to evaluate the level of acceptance of a certain facility is related to its effective use by the end users. Many people who gave positive feed backs during face to face interviews or questionnaires didn’t actually use the facility, undermining the results in terms of acceptance and plant exploitation.
As far as the previous studies on acceptance are concerned, even high TRL (Technological Readiness Level) technologies still present a very low level of acceptance. Several economic and cultural initiatives have tried to incentive and sensitize the public to renewable plants installations. The outcomes derived from enquiries in this field reveal a lasting and extended NIMBY attitude [29]. This behaviour is usually due to the need of an active user who is implicitly asked to be able to interface with the plant and correctly interpret its warnings or error messages.
According to the approach here proposed, actual users’ sentiment towards the installation is directly measured by metering the plant during continuative working periods. The numerical nature of these parameters and their independence from the end-users’ feelings bypasses the draft of the questionnaires which should always be proposed in the most objective way, without affecting people’s opinion. A link to the qualitative indicators is always possible, while for instance knowledge and fear can be implemented as a base for economic projections and considerations at the same time. The fundamental difference of new indices compared to the previous indices consists in the separation of the evaluation of the level of acceptance from any economic or personal consideration.
The importance of acceptance decreases when the end-user is not compelled to manage the facility. The concept behind these parameters follows the over consolidated approach used in the car industry; from the purchaser’s point of view, the performances may become more important than the technical characteristics of the product. For instance, the end user is not interested in how the control unit optimizes the petrol injection while accelerating, but only requires speed and low consumptions as far as possible. This example can be replicated for the domestic appliances and it is based on the bottom line that well performing and user-friendly plants have implicitly and spontaneously a high level of acceptance.
Acceptance should not be made of technological knowledge and qualification in advanced renewable plants, but it would be based on the trust in economic and energetic achievements of the plants. The final customer can, not has to, interact with the installation: self-regulation in real time and the related increase in efficiency are necessary, also using a set of sensors (or a grid, according to the size of the plant) to uphold the needs linked both to the external boundary conditions and the internal ones. In this way, the relation between acceptance and the proposed quantitative parameters is reversed: indices are the results of acceptance; they can be concerned both as a way of measuring acceptance or as a starting point for energy efficiency considerations.
[1] https://dictionary.cambridge.org/it/dizionario/inglese/acceptance Access date 18/02/19
[2] Bertsch, V Hal M, Weinhardt C, Fichtner W. (2016). Public acceptance and preferences related to renewable energy and grid expansion policy: Empirical insights for Germany. Energy (114): 465-477. https://doi.org/10.1016/j.energy.2016.08.022
[3] Schumann D. (2015). Public acceptance. Carbon Capture, storage and use. 221-251.
[4] Wϋstenhagen R, Wolsink M, Bϋrer MJ. (2007). Social acceptance of renewable energy innovation: An introduction to the concepts. Energy Policy (35): 2683-2691. https://doi.org/10.1016/j.enpol.2006.12.001
[5] Takashi T, Sato T. (2015). Inclusive environmental impact assessment indices with consideration of public acceptance: Application to power generation technologies in Japan. Applied Energy (144): 64-72. https://doi.org/10.1016/j.apenergy.2015.01.053
[6] Sauter R, Watson J. (2007). Strategies for the deployment of micro-generation implications for social acceptance. Energy Policy 35(5): 2770-2779. https://doi.org/10.1016/j.enpol.2006.12.006
[7] Saizarbitoria H, Zamanillo I, Iker IL. (2013). Social acceptance of ocean wave energy: A case study of an OWC shoreline plant. Elsevier, Renewable and Sustainable Energy Reviews 27(C): 515-524. https://doi.org/10.1016/j.rser.2013.07.032
[8] Maack M, Skulason B. (2005). Implementing the hydrogen economy. Journal of Cleaner Production 14(1): 52-64. https://doi.org/10.1016/j.jclepro.2005.05.027
[9] Musall FD, Kuik O. (2011). Local acceptance of renewable energy–a case study from Southeast Germany. Energy Policy (39): 3252-3260.
[10] Sutterlin B, Siegrist M. (2017). Public acceptance of renewable energy technologies from an abstract versus concrete perspective and the positive imagery of solar power. Energy Policy 106: 356-366. https://doi.org/10.1016/j.enpol.2017.03.061
[11] Lim XL, Lam WH. (2014). Public acceptance of marine renewable energy in Malaysia. Energy Policy 65: 16-26. https://doi.org/10.1016/j.enpol.2013.09.053
[12] Dear M. (1992). Understanding and overcoming the nimby syndrome. Journal of the American Planning Association 58(3): 288-300. https://doi.org/10.1080/01944369208975808
[13] Wright D, Patrick, (2009). Rethinking NIMBYism: The role of place attachment and place identity in explaining place-protective action. Journal of Community & Applied Social Psychology 19(6): 426-441. https://doi.org/10.1002/casp.1004
[14] Wolsink M. (2006). Invalid theory impedes our understanding: A critique on the persistence of the language of NIMBY. Transactions of the Institute of British Geographers 31(1): 85-91. https://doi.org/10.1111/j.1475-5661.2006.00191.x
[15] Bhandari R, Trudewind A, Zapp P. (2014). Life cycle assessment of hydrogen production via electrolysis–a review. Journal of Cleaner Production 85: 151-163. https://doi.org/10.1016/j.jclepro.2013.07.048
[16] Davis FD. (1989). Perceived usefulness, perceived ease of use and user acceptance of information technology. MIS Quarterly 13(3): 319-339. https://doi.org/10.2307/249008
[17] Venkatesh V, Bala H. (2008). Technology acceptance Model 3 and a research agenda on interventions. Decision Sciences 39(2): 273-315. https://doi.org/10.1111/j.1540-5915.2008.00192.x
[18] Wright PD. (2008). Reconsidering public acceptance of renewable energy technologies: A critical review. Department of Applied Economics Occasional Papers (68): 1-15.
[19] Bagozzi RP, Davis FD, Warshaw PR. (1989). User acceptance of computer technology: A comparison of two theoretical models. Management Science 35(8): 903-1028. https://doi.org/10.1287/mnsc.35.8.982
[20] Kardooni R, Yusoff SB, Kari FB. (2016). Renewable energy technology acceptance in Peninsular Malaysia. Energy Policy (88): 1-10. https://doi.org/10.1016/j.enpol.2015.10.005
[21] Owens S. (2004). Siting, sustainable development and social priorities. Journal of Risk Research 7(2): 101–114. https://doi.org/10.1080/1366987042000158686
[22] Erbil AO. (2011). Social acceptance of the clean energy concept: Exploring the clean energy understanding of Istanbul residents. Renewable and Sustainable Energy Reviews 15(9): 4498-4506. https://doi.org/10.1016/j.rser.2011.07.101
[23] Paravantis JA, Stigka E, Mihalakakou G, Michalena E, Hills JM, Dourmas V. (2018). Social acceptance of renewable energy projects: A contingent valuation investigation in Western Greece. Renewable Energy 123: 639-651. https://doi.org/10.1016/j.renene.2018.02.068
[24] https://ec.europa.eu/eurostat/statistics-explained/images/8/80/Figure_4-Gross_inland_consumption_of_renewables_EU-28_1990-2016.png.Access date 28/03/2019
[25] https://ec.europa.eu/info/funding-tenders/opportunities/portal/screen/opportunities/topic-details/lc-sc3-ee-13-2018-2019-2020. Access date 28/03/2019
[26] Rosa MD, Romano G, Rossi C, Scarpa F, Tagliafico LA. (2016). Theoretical model and experiments on hybrid PV-T solar panels. La Termotecnica (51).
[27] Tagliafico LA, Arteconi A, Marchitto A, Saio C, Scarpa F. (2017). A pilot plant with hybrid PV/T panels; system integration of a solar assisted heat pump with existing heating devices. 35th UIT.
[28] Tagliafico LA, Rossi C. (2018) Hybrid PV/T panels refrigerated with heat pump systems. 65th National Congress ATI, 09/10.
[29] Langer K, Decker T, Roosen J, Menrad K. (2018). Factors influencing citizens’ acceptance and non-acceptance of wind energy in Germany. Journal of Cleaner Production 175: 133-144. https://doi.org/10.1016/j.jclepro.2017.11.221