Revathi Vankayalapati* | Kalyani Balaso Ghutugade | Rekha Vannapuram | Bejjanki Pooja Sree Prasanna
© 2021 IIETA. This article is published by IIETA and is licensed under the CC BY 4.0 license (http://creativecommons.org/licenses/by/4.0/).
OPEN ACCESS
Data Clustering is the process of grouping the objects in a way which is identical to the objects in the same group than in other classes. In this paper, the clustering of data is used as k-means to assess the output of students. Machine Learning is an area used in all systems. Machine learning is used in education, pattern recognition, sports, industrial applications. Its significance increases with the future of the students in the educational system. Data collection in education is very useful, as data volumes in the education system are growing each day. Higher education is relatively new, but due to the growing database its significance grows. There are several ways to assess the success of students. K-means is one of the best and most successful methods. The secret information in the database is extracted using data mining to increase the output of students. The decision tree is also a way to predict the success of the students. In recent years, educational institutions have the greatest challenges in increasing data growth and using it to increase efficiency, such that better decision-making can be made. Clustering is one of the most important methods used for the analysis of data sets. This trial uses cluster analyses according to their features for section students in various classes. Uncontrolled K-means algorithm is discussed. The mining of education data is used for the study of the knowledge available in the field of education in order to provide secret, significant and useful information. The proposed model considers K-means clustering model for analyzing learners performance. The outcomes and future of students can be strengthened with this support. The results show that the K-means cluster algorithm is useful for grouping students based on similar performance features.
K-means, clustering, data analyzing, performance evaluation, pattern recognition, machine learning
Cognition is the process of knowledge through our experiences, senses and thoughts. A Cognitive refers to a person's mental ability to think, perceive, know and learn. Learning is the ability to learn by means of experience, research or instruction. Learning and cognitive are both extremely similar—learning, which involves learning and cognition [1]. We are going through a number of cognitive processes in order to gain insight when we have found something new. By processing all sorts of information obtained from the environment, the human brain constantly performs several different tasks [2]. Sense, perception, attention and memory are some of the cognitive processes that influence our daily lives. Complex cognitive processes such as intellectual capacity, thought and language are available. As cognitive processes there are different functionalities [3].
The clustering method is an extraction process from large data sets of previously unknown, true, useful and secret patterns in place [4]. In educational databases, the volume of data stored is rapidly increased. The technique of clustering is most commonly used for future forecasting [5]. Clustering aims mainly at dividing students according to their qualities and skills into homogeneous classes. These applications will increase the standard of education both for teachers and students. This research uses cluster analysis according to their characteristics for segment students in classes [6].
Analysis of clusters can be split into hierarchical and non-hierarchical strategies of clustering. Examples of hierarchical strategies include single link, full connection, median and Ward interconnections [7]. K-means, adaptive k-means, k-medoids and fuzzy clusters are non-hierarchical strategies. The type of data that is available and the specific aim of analysis depends upon which algorithm is fine. The stability of clusters in simulation studies can be studied more objectively [8].
The "right" parameter/algorithm configuration is not easy to choose. A successful cluster algorithm should ideally create groups that do not overlap, though the practise does not generate a perfect separation. The consistency of a separation obtained by clustering algorithm can be evaluated using a figure of worth measures (indices), such as a silhouette width [9] or the homogeneity index [10]. There was consideration in [11] of the principle of stability of a clustering algorithm. The concept behind this validation approach is to reward a consistent algorithm. We used conventional K-means [12] clusters in this paper and selected Euclidean similitude measure for the study of pupil scores.
Training is an important factor for a country's growth and improvement. Education perfects an individual, through whom he/she can take part in any progressive country work. Education is civilizing and well-managed in a society. The classification of higher education means that through their academic results the student is classified [13]. Lack of deep and sufficient expertise in the higher education system could prevent system management from achieving quality goals. The technique of data clustering will help to overcome this gap in the higher education system [14].
In order to get new information in the student assessment, several variable data can be analyzed. In this context we want to define a grade point average (GPA) component, duration of the studies, duration of thesis and score for English skills. The main aim here is to identify the characteristics of students in every student cluster [15]. We divided the student data cluster into three groups. It is because we want an outstanding performance, standard performance and performance element of the student. The educational institution collects valuable potential information through the grouping of student results.
Several researchers addressed the application of clusters in education results. The hybrid procedure allows academics to predict the GPA of the student. The teacher will step up the academic performance of students Hybrid Process keywords based on the performance. The proposed mode uses regression methods to describe a prediction and cluster with K-means. Student activity in each cluster is the predictive intent.
Unattended data mining technology to classify groups with similar data characteristics [16] is the clustering method. However, cluster analyses were not used in educational research [17]. Academic authorities, however, did typologies of the learner in various formats to influence the design of the project based courses and the academic performance of the learners with little machine learning technology. This contributed to a subjective way of unregulated learning processes for students [18].
Effective learning designs are critical for universities and with big data and data mining, prediction and clusters, projects based on useful knowledge from training sets are helpful in redesigning courses [19]. K-means is an old cluster algorithm created by MacQueen in 1967 that is most commonly used. It was one of the easiest, unattended learning algorithms to solve the issue of the well-known cluster [20].
K-means clustering is an algorithm for the study of data mining / computer used to group observations into groups without any previous knowledge of those relationships. The algorithm k-means is an evolutionary algorithm, derived from its operation form [21]. The algorithm divides observations into k groups, with k as an input parameter [22]. Each observation is then allocated to clusters based on the closeness of the observation to the mean [23]. The mean of the cluster is then re-published and the process restarts.
Data mining is an evolving approach used in education to improve our understanding of the learning process in order to define, extract and evaluate variables relevant to the students' learning process. Romero and Ventura [1] proposed a K-means that is an easy-to-understand, widely-used clustering tool. Cluster analysis explains the correlation of various cases through distance measurements. Because of their similarities, these cases are grouped into different clusters. Shahiri and Husain [2] gave a case study that evaluated student figures in order to forecast performance and alert students at risk before completing their exams. K-means is a well-known grouping algorithm [3], it has been explained, which seeks to reveal connections between the variables already presented in data set. In order to recognise and strengthen educational processes that can improve decision making, Wang et al. [4] have used mining of educational data. Finally the author concluded that clustering was successful in identifying secret connections between various categories of students.
Yousef et al. [5] proposed a Decision Tree System. The J48 algorithm is used to construct a decision tree. Weka is used and the model CRISP-DM is used. Data regarding graduates and students in postgraduates was collected. It's a university in Algeria. The data are obtained from the IT department. The decision tree is checked and error rates are analysed such that the correct input and output is calculated. The attribute is various grades, and the success of the student is determined.
Zou et al. [7] used classification techniques to assess student results. Input data are gathered in the Department of Informatics at Ayya nadir JanakiAmmal, Sivakasi. Selection of methods is discussed for function selection. For the data collection, training data will be applied and the classifier model created. The classification of the decision tree has been used to predict the success of students.
Magrini et al. [8] discussed results on education are based on various factors such as personal data, social information etc. WEKA Toolkit collects in real time data from college students describing the relationship between student's learning activity and their academic success, and provides semester students with detailed information on various subject marks which are subject to data mining. In these clusters of K-means, 38 students have been selected from the total of 300 record data sets to be evaluated. The matrix of uncertainty indicates passing, failure and lack of testing. The weighted average for decision tree and naviebayes technology is compared.
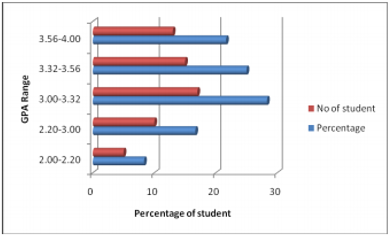
Costa et al. [11] proposed the clustering of data is used as k-means to assess the performance of students. The results are tested for the basic class, medium and final examination. Their results are measured. They are evaluated in their pattern by internal and external assessments in which they are predicted to have tale-class test marks, laboratory results, quizzes etc. They produce the diagram showing the high, medium and low gpa percentage of students.
Decision tree is techniques supervised and several methods exist for defining the decision tree and predicting results. The educational system produces immense quantities of data. These can be used to gain valuable information. Many methods are used in the current framework to forecast the success of students [24]. The J48 algorithm is used in the current machine decision tree. In the Algerian University, the success of the student is predicted by the tree of decision. Method of decision tree is unstable because of the many possible solutions provided by decision tree [25]. It changes the tree and has a different prediction when changing the root node. In the current framework, there is a large amount of information in the educational system that forecasts the output at the base of the previous six months. The decision tree uses the J48 algorithm that is extremely difficult to create due to its break [26]. To evaluate a specific divide, a tree algorithm uses several tests. But even before that the algorithm has been determined, several variables have been combined to achieve the best division.
K-means clustering is an unattended learning used when unlabeled data is available. This is the most widely used clustering algorithm in data mining. The clustering algorithm K-means is a clustering algorithm based on partition that is used to find the clusters of the given data. It divides the data into predefined numbers of clusters (K), with strong intra-cluster resembled data artefacts and low inter cluster resemblance. The data object belonging to one cluster cannot be used in any other cluster in an efficacious manner. To achieve clustering, the measure of similarity or dissimilarity must be calculated. Similarity tests the degree of proximity and is used for grouping together similar data items based on distance funktiones such as distance from Manhattan, Euclidean, Minkowski, Cosine etc. Clustering using distance measurements is referred to as remote clustering, a very common technique for clustering data objects that has shown good results. K-means operates iteratively for the algorithm.
Phase 1: Put the first group center into 2d space randomly.
Phase 2: Attribute to the category with the centroid nearest each object.
Phase 3: Measure the centroid positions.
Phase 4: If the centroid positions have not changed then the next step is taken.
Phase 5: Finishing.
The k-means algorithm can be considered to be a descent of gradients, starting from the start of cluster centroids, and updating these centroids iteratively to reduce the objective function. The k-means are often at a minimum local level. The local minimum is determined by the center of the initial cluster. NP-complete is the problem of finding the global minimum. The algorithm k-means updates central cluster to a minimum local level.
Prior to the convergence of the k-median algorithm, distance and centric are determined when loops are performed several times, while the positive integer l is considered the k-median iterations. The exact value of l varies even with the same dataset depending on the initial start of the cluster centroids. The algorithm's time complexity is O (nkl), where n is the total number of items in the dataset, k is the number of clusters we found and l is the number of iterations, k to do n, l total.
3.1 Clustering analysis
Cluster analysis used for segmenting a wide range of data into subsets known as clusters. Each cluster consists of a set of data objects which are identical to each other but differ from other clusters. Data Clustering is the technical study of unattended and statistical data. It is used as a single category to classify the same data. It works on a huge collection of data to discover secret patterns and relationships that help to decide fast and efficiently.
Cluster analysis is a collection of auto-classification methodologies for samples in a number of groups that use an association calculation, so as to ensure that samples in one group are similar and that samples from different groups are not similar. The input for a cluster analysis method is a collection of samples and a similitude between two samples. The cluster analysis output is a collection of groups (clusters) forming a partition of the data set or a partition structure.
Clustering analyses data objects without a known class mark, as opposed to classification and prediction, where class labelled data objects are analyzed. The class labels are not generally present simply because they are not identified to begin with in the training data. Such labels can be created by clustering. The objects are clustered or grouped according to the intra-class similitude theory and the inter-class similarity are minimized.
Data classification is the most accurate and effective categorization of data. Data classification Data are categorized by their critical importance or how much they must be accessed with the most critical or often used data stored on quickest media, while other data can be stored on slower (and less expensive) media in a simple approach to data storage. This classification has been designed to maximize data storage use for a multitude of purposes - technological, administrative, legal and economic. In addition to the relative significance or frequency of use, data may be categorized according to all parameters. For example, when it's developed, when it has been accessed or updated last, which person or department it has last reached or modified and which staff or departments use it the most, the data can be broken down by its current content, nature of the file, operating platform and average file volume in megabytes or GIC's. A well designed method of data classification makes it easy to locate important details. This can be especially relevant for risk management and leg management.
In other words, objects are clustered such that objects within a cluster are highly similar, but very different objects in other clusters. Each cluster shaped can be seen as an object class that derives rules from.
Typically, clustering is used for segmentation. The hierarchy of groups of identical students can be taken by an institution.
Clustering allows students to be separated into education, age, areas of interest and specialization, etc. Clustering may help institutes organize individual students into groups with similar behavior. Dividing students into clusters to ensure that students are identical to each other (i.e. average), although they are unlike students in other cluster.
Predicting the output of students can be achieved with the algorithm for machine learning. Clustering is a technology in which a cluster of identical data sets is present. K is used to predict student performance using an algorithm. K implies is a computer algorithm which is not monitored. K means clustering set the n clarifications division into k clusters in which every finding is the closest medium to the cluster. Cluster is slow with the average value of the cluster objects that can be viewed as the centroid cluster.
The aim is to set K centres and one centre per cluster. Therefore, it is better to put them far apart. The next step is to take each data set point and connect it to the nearest centre. If there is no point, the first step is completed and an age of primary group is completed. At this point, by looking at the previous step, we need to recalculate k new centres. After these k new centroids, the same data points and the closest new centre are used for a new procedure. A loop was produced. With this loop, we can announce that the k centres change place step by step until no changes are made or otherwise centres are no longer moving.
The instructor has to pass a test before any student is enrolled for the course in order to assess the data processing speed of each student. The test is designed to allow students to read understanding and to answer nine understanding questions. In individual pages the understanding and each query will be shown. The student cannot return to the understanding page until he has entered the questions. The proposed model architecture is shown in Figure 1.
Step-1: First of all the user logs into the tool using his eMail ID and password in this cognitive tool.
Step-2: He will be ready to verify where there is a counter that will work for and query internally, and to read the passage that helps measure the user's total time.
Step-3: The sum of questions correctly answered is collected.
Step 4: we used an exactness format that depends explicitly on how long each user has taken to address questions, how long he has taken to read the content, how many correct answers the user gives and then how many incorrect answers the user has given.
Accuracy=mean+K*(9-c); mean=(((read time)+(answer time))/(c+1), where c=total no.of answers correctly and k is constant.
Fifteen of us have used fifteen to measure the values of precision.
Step 5: For students based on the accuracy column, we used a K-means algorithm. Under this algorithm it is possible to inform the user of the cluster to which he belongs.
Cluster0 is a high-pitch learner, Cluder1 is a medium-pitch learner, and Cluster2 is a small-pitch learner. Cluster0 belongs to a high-pitch learner. The proposed model architecture is depicted in Figure 1.
Figure 1. Proposed model framework
K-means is used to predict student success using an algorithm. K-means clustering attempts to divide n observations into k-clusters in which each process determines to the most closely averaged cluster, acting as a cluster template.
Analysis of the clusters separates the data into useful classes with similar features. Data groupings with clustering have a high similarity intra clusters and a low similarity inter clusters. K-means is a divided clustering algorithm, with unchecked pattern classifications, which specifies the K-medoid of all clusters. K means n-instances into k-clusters in which each instance is the nearest medium to the cluster. This algorithm attempts to minimize the objective function of a squared error. The performance levels of the students are depicted in Figure 2.
Figure 2. Performance levels
The performance levels of the propose model with K value considered as 4 is indicated in Table 1. The accuracy values are depicted in the Table 1.
Table 1. Performance levels
|
Cluster # |
Cluster size |
Overall performance |
|
1 |
24 |
50.08 |
|
2 |
16 |
65.00 |
|
3 |
30 |
58.89 |
|
4 |
9 |
43.65 |
Figure 3. Clustering levels
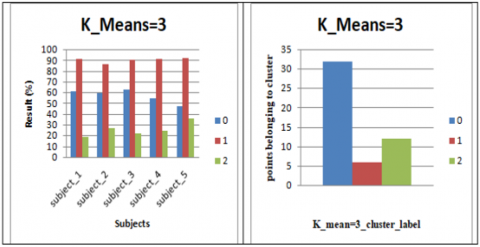
The method begins with the number of clusters. In the dynamic number of clusters, the web application has grown. The number of clusters depends on the consumer but the number of clusters is three in this study. The predicted results show a student's profile, with outstanding performance, standard performance and bad performance criteria. The clustering accuracy levels of the proposed model is depicted in Figure 3. The performance levels of the proposed model with k value as 4 is depicted in Figure 4.
Figure 4. Performance levels with K=4
In our work, the method used to measure the speed at which a user can process information is created and implemented. We administered a test for measuring this, consisting of an understanding and a set of 9 understanding questions. We have used a timekeeper for every question to get the time the user spends on every problem. We also measured how long it took to read the understanding and obtained an exact formula and the precision of the individual's calculations. We then implemented the k-means classification algorithm and classified users into their respective groups. We can increase the functionality of this tool by attaching a reliable screening which helps to keep records of and person's work and tasks and results. This monitoring agent allows users to change to another class, i.e. based on their output a user can be migrated to other classes. By using more sophisticated and powerful algorithms, classification can be enhanced. There are also more features such as a video search for a keyword and many more that make the tool easier to use.
[1] Romero, C., Ventura, S. (2017). Educational data science in massive open online courses. Wiley Interdisciplinary Reviews: Data Mining and Knowledge Discovery, 7(1): e1187. https://doi.org/10.1002/widm.1187
[2] Shahiri, A.M., Husain, W. (2015). A review on predicting student's performance using data mining techniques. Procedia Computer Science, 72: 414-422. https://doi.org/10.1016/j.procs.2015.12.157
[3] Wang, G., Fu, G. (2018): The cluster analysis of online learners’ behavior characteristics from the perspective of data mining. Modern Distance Education Research, 154(4): 106-112.
[4] Wang, X., Yang, D., Wen, M., Koedinger, K., Rosé, C.P. (2015). Investigating how student's cognitive behavior in MOOC discussion forums affect learning gains. International Educational Data Mining Society, Madrid, Spain, pp. 226-233.
[5] Yousef, A.M.F., Chatti, M.A., Wosnitza, M., Schroeder, U. (2015). A cluster analysis of MOOC stakeholder perspectives. International Journal of Educational Technology in Higher Education, 12(1): 74-90. https://doi.org/10.7238/rusc.v12i1.2253
[6] Zhang, G., Zheng, Y., Xia, G. (2019). Domain adaptive collaborative representation based classification. Multimedia Tools and Applications, 78(21): 30175-30196. https://doi.org/10.1007/s11042-018-7007-0
[7] Zou, Q., Zeng, J., Cao, L., Ji, R. (2016). A novel features ranking metric with application to scalable visual and bioinformatics data classification. Neurocomputing, 173: 346-354. https://doi.org/10.1016/j.neucom.2014.12.123
[8] Magrini, A., Lazzari, S., Marenco, L., Guazzi, G. (2017). A procedure to evaluate the most suitable integrated solutions for increasing energy performance of the building’s envelope, avoiding moisture problems. International Journal of Heat and Technology, 35(4): 689-699. https://doi.org/10.18280/ijht.350401
[9] Bejan, A. (2016). Constructal thermodynamics. International Journal of Heat and Technology, 34(1): S1-S8. http://dx.doi.org/10.18280/ijht.34S101
[10] Chen, W.K. (1990). Linear Networks and Systems: Algorithms and Computer-aided Implementations (In 2 Volumes) (Vol. 3). World Scientific.
[11] Costa, T., Zarante, P., Sodré, J. (2013). Simulation of aldehyde formation in ethanol fuelled spark ignition engines. Expert Verlag, Berlin.
[12] Bentley, R.E. (1998). Handbook of Temperature Measurement Vol. 3: The Theory and Practice of Thermoelectric Thermometry. Springer Science & Business Media.
[13] Williams, J.O. (1993). Narrow-band analyzer. Ph.D. dissertation. Department of Electronic Engineering, Harvard University, Cambridge, Massachusetts, USA.
[14] SIMUL8 Corporation. SIMUL8 – Process Simulation Software. http://www.simul8.com/, accessed on Jan. 17, 2015.
[15] Reber, E.E., Michell, R.L., Carter, C.J. (1988). Oxygen absorption in the earth’s atmosphere. Technical Report TR-0200 (4230-46)-3. Aerospace Corporation, Los Angeles, California, USA.
[16] Motorola Semiconductor Data Manual. (1989). Motorola Semiconductor Products Inc., Phoenix, USA.
[17] Sansgiry, S.S., Bhosle, M., Sail, K. (2006). Factors that affect academic performance among pharmacy students. American Journal of Pharmaceutical Education, 70(5): 104. https://doi.org/10.5688/aj7005104
[18] Datta, S., Datta, S. (2003). Comparisons and validation of statistical clustering techniques for microarray gene expression data. Bioinformatics, 19(4): 459-466. https://doi.org/10.1093/bioinformatics/btg025
[19] Rousseeuw, P.J. (1987). Silhouettes: a graphical aid to the interpretation and validation of cluster analysis. Journal of Computational and Applied Mathematics, 20: 53-65. https://doi.org/10.1016/0377-0427(87)90125-7
[20] Sharmir, R., Sharan, R. (2002). Algorithmic approaches to clustering gene expression data. In current Topics in Computational Molecular Biology MIT Press.
[21] Mucha, H.J. (1992). Adaptive cluster analysis, classification and multivarite graphics. Weirstrass Institute for Applied Analysis and Stochastics.
[22] Fahim, A.M., Salem, A.M., Torkey, F.A., Ramadan, M. (2006). An efficient enhanced k-means clustering algorithm. Journal of Zhejiang University-Science A, 7(10): 1626-1633. https://doi.org/10.1631/jzus.2006.A1626
[23] Omolehin, J.O., Oyelade, O.J., Oladipupo, O.O. (2005). Application of fizzy logic in decision making on student’s academic performance. Bulletin of Pure and Applied Sciences, 24(2): 381-387.
[24] Omolehin, J.O., Enikuomehin, A.O., Jimoh, R.G., Rauf, K. (2009). Profile of conjugate gradient method algorithm on the performance appraisal for a fuzzy system. African Journal of Mathematics and Computer Science Research, 2(3): 30-37.
[25] Kumar, N.A., Uma, G.V. (2009). Improving academic performance of students by applying data mining technique. European Journal of Scientific Research, 34(4): 526-534.
[26] Varapron, P. (2003). Using rough set theory for automatic data analysis. 29th Congress on Science and Technology of Thailand.