Shaik Shabbeer* | Edara Srinivasa Reddy
© 2021 IIETA. This article is published by IIETA and is licensed under the CC BY 4.0 license (http://creativecommons.org/licenses/by/4.0/).
OPEN ACCESS
Artificial Intelligence (AI) has its roots in every area in the present scenario. Healthcare is one of the markets in which AI has greatly grown in recent years. The tremendous increase in health data generation and the substantial evolution of the robust data analysis tools have contributed to AI improvement in health care and research, leading to increased service efficiency. Health reporting is stored as Electronic Health Records (EHR), providing information on the patients sought temporarily. EHR data have different issues, such as heterogeneity, missing values, distortion, noise, time, etc. This study reflects the irregularity of appointment that refers to the irregular timing of the operations (patient visits). Congestive heart failure (CHF) is a grave clinical disorder caused by an insufficient blood supply in the bloodstream owing to a heart muscle dysfunction. Most people suffer from CHF which result in death or immediate recognition. A multi-layer perceptron (MLP) model was used to treat visit stage abnormalities. The studies on the Medical Knowledge Mart for Intensive Care-III (MIMIC-III) dataset and the findings obtained indicate that the lack of a visit stage affects the estimation of the clinical outcome. It has been demonstrated that the readmission and reduction of the prediction model for mortality conditions is beneficial. Compared with baseline models, the proposed model is successful.
multi layer perceptron (MLP), hospital re-admission, length of stay, electronic health records (EHR), congestive heart failure (CHF)
Artificial Intelligence (AI) systems in healthcare can be of many forms. For instance, it could be in the form of robots that are used for purposes like drug delivery to treat patients, teaching children with special needs or to aid the elderly people (care robots) or it could also be in the form of virtual approach to build decision support systems or many more [1, 2]. These kinds of decision support systems designed with medical data [3, 4] can be used to help doctors in making informed clinical decisions by providing insights about a patient’s conditions to predict outcomes such as readmission, in-hospital mortality, length of stay and many other applications like these. The healthcare data is available in many forms, for instance, images, text, time-series (ECGs), sounds, categorical, numerical, text and so on.
In general, EHR data [5, 6] comprises of information such as diagnoses made on each patient, lab results, procedures followed, medications prescribed, vital measurements for each visit made by patients to a hospital and their demographic information such as age, gender, ethnicity and many more.
The real challenge lies in representing this data for predictive modelling because of its high dimensionality, temporal nature and sparsity. High dimensionality of EHR data leads to longer computation time, need for larger storage space and also leads to sparsity in data. When there are large number of diagnoses, this could lead to sparsity in data for rarely occurring diseases. Hence, need for more data arises in case of high dimensional data. Temporal nature of EHR data is the order in which diagnoses occur and time interval between diagnoses or time interval between visits.
These aspects should be considered when handling EHR data. In order to address the above-mentioned aspects, state-of-the-art deep learning models [7, 8] are being used. Potential use of these predictive models covers addressing a wide range of problems in the field of healthcare such as hospital readmission prediction, hospital length of stay prediction [9-11], in-hospital mortality prediction, phenotype classification, drug recommendation [12], decompensation and so on [13, 14]. These predictive models can also be helpful for hospitals to manage their resources efficiently, for patients to know more about future risks, for doctors to have more understanding about a patient’s condition and overall to improve the quality of medical service. Particularly, Congestive Heart Failure (CHF) [15, 16] is a chronic medical condition caused by heart muscle weakness that results in inefficient blood flow in the body. The Swedish Board of Health and Social Welfare defines CHF as the presence of at least one diagnoses. CHF is a common condition with nearly 26 million people suffering from its worldwide [17]. In Sweden the prevalence of CHF was found to be 2.2% in 2010 [18]. It is also a leading hospitalization cause in Sweden with nearly 44% of CHF patients admitted at least once per year [18]. While the demand of CHF care is understood to be high, there exists limited understanding of how the cost for CHF care is distributed within the health-care system.
The main objective of this article was to leverage the Regional Healthcare Information Platform to understand healthcare utilisation and care patterns of the CHF population while simultaneously exploring potential opportunities of improvement to curb care costs. It gave an experience of con-ducting retrospective observational studies in medicine. In order to predict the CHF readmission and chance of mortality reduction.
Here we use the MLP and Word2Vec model to process EHR data. Word2Vec model is takes the input text data and process it and give the vectors as input to MLP, and it is effective in handling and made classification of CHF readmission and mortality. The rest of the paper is organized as follows secion-2 describes the literature work, section-3 gives proposed model, section-4 illustrates the experimental results and final section concludes the article. Here Figure 1 explains the EHR data description.
Figure 1. HR data
Logistic regression (LR). For notes, we use tf-idf representations. We simply concatenate structured variables with`2-normalized tf-idf vec-tor from notes to incorporate structured information. We use scikit-learn [1] and apply 2regularization to prevent overfitting. We search hyper parameters $\operatorname{Cin}\{2 x \mid x \in Z,-11 \leq x \leq 0\}$.
Deep averaging networks (DAN) [2]. We use the average embedding of all to-kens in the notes to represent the unstructured information, which can be considered a deep version of bag-of-words methods. Similar to logistic regression, we concatenate the structured variables with the average embedding of words in notes to incorporate structured information.
GRU-D [3]. The key innovation of GRU-D is to account for missing data in EHRs. It imputes the missing value by considering all the information available so far, including how much time it elapses since the last observation and all the previous history. Similar to DAN, we use the average embedding of tokens to represent notes. See details of GRU-D in the supplementary material. Although it is difficult to apply the family of BERT models to this dataset due to their input length limitation compared to the large number of tokens from all medical notes, we experiment with Clinical BERT based on the selected valuable information.
Value of medical notes. Boag et al. [4] finds that notes are useful for some classification tasks., admission type and gender, and reveals that the choice of note representation is crucial for the downstream task. Prior work also shows that some important phenotypic characteristics can only be inferred from text reports [5].
For example, Escudi ́e et al. [6] observed that92.5% of information regarding autoimmune thyroiditis is only presented in text. Despite the potential valuable information in medical notes, prior work also points out the redundancy in EHRs.
Shivade et al. [5] proposed methods to reduce redundant content for the same patient with a summarization-like fingerprinting algorithm, and show improvements in topic modelling. We also discuss the problem of redundancy in notes, but provide a different perspective by probing what type of information is more valuable than others using our framework for medical notes.
The NLP community has worked extensively on medical notes to alleviate information overload, ranging from summarization to information extraction [7, 9, 10].
For instance, information ex-traction aims to automatically extract valuable in-formation from existing medical notes. While our operationalization seems similar, our ultimate goal is to facilitate information solicitation so that medical notes contain more valuable information.
Recently, generating medical notes ha at-traced substantial interest that might help caregivers record information [11, 13], although they do not take into account the value of information. Predictive tasks with EHRs. Readmission prediction and mortality prediction are important tasks that have been examined in a battery of studies [14];
In MIMIC-III, to the best of our knowledge, we have experimented with the most extensive structured variables and as a result, achieved better performance even with simple models [15]. Other critical tasks include predicting diagnosis codes [16] and length of stay [17]. We expect information in medical notes to be valued differently in these tasks as well.
XGBoost (XGB) [18] is an ensemble learning library that uses gradient boosting decision tree algorithm. Gradient boosting technique uses ensemble of weak learners to model a strong learner. Models are built sequentially rather than in parallel, in such a way that new models created are used to reduce error from previous models. This process is repeated until error is minimized as much as possible. In such boosting technique, overfitting can be controlled by choosing right number of trees. Output of a boosting model is weighted average of all the models.
EHRs are temporally ordered high dimensional data with sequential relationship between each visit made by a patient, demographic information, clinical notes, lab results, clinical diagnosis and medications. Data representation plays an important role in the performance of a predictive model [4]. A patient can be represented in multiple ways with help of EHR data. For example, each patient may be represented as one feature vector or a patient may be represented as multiple feature vectors where each vector gives information about a visit. Data representation plays a vital role in converting medical data or text to a form which is understandable (numbers) for machines to process and learn from the data. The main purpose of data representation lies in mapping high dimensional medical data to lower dimensional space and learning latent relationship in the data. By latent relationship, we mean the relationship between domain concepts. Deep learning approaches that have been proposed recently capture this relationship between data in an efficient way [5]. As said earlier, temporal nature of the data should also be taken into consideration when creating a representation for EHR data, that is, order in which diagnoses has been made or order in which patient’s visits occurred should be taken into account. Apart from the temporal nature of EHR data and its high dimensionality, there are also other challenges with EHR data. Some of them are biases, missing values, irregularities in the data like visit level irregularity, feature level irregularity and many more. Visit level irregularity refers to varying time gap between each visit made by a patient. Feature level irregularity refers to progression of different diseases at varying time intervals. But why is this irregularity important to consider in healthcare? According to authors of the book [6], time is one of the important factors in diagnostic process. Diseases progress through time and there can be time elapse between onset of disease and symptoms showing up in a patient. Or, there may be delay in recognizing actual symptoms as diagnosis. When handling medical data, the rate at which a disease progresses, that is, irregularity between visits may give more information about a patient’s condition. Here in this paper we mainly focus on CHF.
EHRs possess clinical profiles for every visit which is a list of clinical events. Now the analogy between free text and structured clinical profiles is simple: a clinical profile is considered as a sentence or context and clinical codes as the words in it. And the goal is to construct mathematical vectors for every word (or clinical code) based on its co-occurrences in a given context (or clinical profile). Traditional word Using a set sliding pane, embedding techniques are designed for language text and take into consideration the order of terms. On the other side, therapeutic codes are unordered for visits and there will be a varying number of codes for each visit. We also endorse adjustable window scale as regards the clinical pro-file size, slightly modifiedword2vecto. In comparison, the word 'antonyms' would not apply for medicinal documents, as compared to language messages. Learned relationships between ICD-9 codes usingword2veconthe MIMIC-III dataset can be visualised online11https://awaisashfaq.com/scatterplot/21.
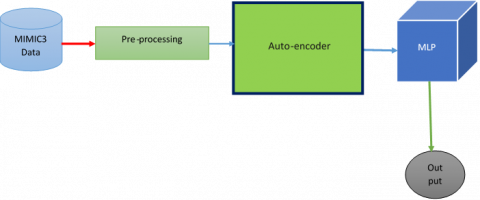
So far, the representations learned from the aforementioned word embed-ding techniques are those of clinical concepts (individual codes) and not the complete clinical profile. Figure 2 detailly describes the how the proposed model is performed.
Figure 2. Proposed model
For that task, we leveraged the Word2vec model for each profile to store the representation of the complete profile. A main restriction of NLP-inspired embedding strategies is that uncommon terms are not used in the vocabulary. Rare clinical codes such as cancer or HIV, if present in the patient profile, may be significant. Thus, we add some human derived features like severity scores to capture the rare events. Other human derived features are considered in this proposed model include the number of prior patient visits to emergency department, inpatient care and outpatient care and medication compliance. And these things are handled by word2vec initially. After words the outcomes are given to the MLP should process and results the classification outcomes.
3.1 Auto-encoder
"Autoencoders" are a machine learning task in semi-supervised learning in which we use neural networks to do representation learning. Specifically we can construct the neural network architecture so that the network compresses the data in such a way that a compressed information representation of the initial input can be generated. If each function in the input was its own undirected unconnected, this reconstruction would be really complicated since the reconstruction would have to break up the connections However, if the structure in the data can be obtained by any structure in the data (i.e. by connections of input features), the structure in the data may be leveraged by pressing the input through the network's bottleneck
Word2Vec
algorithm create_word2vec
input: d: dataset
output: Matrix Wos6,50) of one-hot vectors for
each possible byte value (0-255)
let f be a list of tuples (byte_value, frequency)
for i= 0 to 255 do
freq <0
for each item j in d do
freq — freq + frequency Of Occurrence, j)
end for
append (i, freq) tuple to f
end for
f< sort f based on frequencies
W <— word2vec(f,50)
return W
3.2 Multi-layer perceptron
As classifier, Multi-Layer Perceptron is used. The multi-layer Perceptron (MLP) architecture used in this work consists of input, output and secret layer. In several pattern recognition applications, the single concealed layer of Perceptron provides uniform approximation. The performance vector for a single Percepttron layer is defined
$f(x)=G\left(b^{(2)}+W^{(2)}\left(s\left(b^{(1)}+W^{(1)} x\right)\right)\right)$ (1)
where, b(1) b(2) are the secret and output layer bias vectors, W(1), W(2) are the corresponding node weight and s, G are the activation functions. For a question of classification where (x(i), y(i)) is a vector of training where x(i) has to R_ the d-dimensional vector and y(i) has to {a1,......, H}. H}. For the f(x) function given in Eq. (1), the zero-one failure function
$\ell_{0,1}=\sum_{i=0}^{|\mathcal{D}|} I_{f\left(x^{(i)} \neq y^{(i)}\right)}$ (2)
where, I is the indicator function given by
$I_{x}=\left\{\begin{array}{cc}1 & \text { if } x \text { is true } \\ 0 & \text { otherwise }\end{array}\right.$ (3)
$f(x)=\operatorname{argmax}_{k} P(Y=k \mid x, \theta)$ (4)
where, i is the set of all the specified model parameters. The teaching is targeted at minimising the loss feature. Negative log-like lowered loss function minimization is also not distinguishable as the intent of the training.
$N L L(\theta, \mathcal{D})=-\sum_{i=0}^{|\mathcal{D}|} P\left(Y=y^{(i)} \mid x^{(i)}, \theta\right)$ (5)
Weights are modified with a loss function specified error surface gradient. Gradient from training data is calculated. In this analysis, a learning method based on stochastic gradient decrease is extended to MLP. In the ordinary gradient descent algorithm, minor steps on an error surface are continuously taken downwards, which is the mean square error. Mean square error is a weight function. Stochastic gradient descent (SGD) operates on the same premises as the ordinary gradient descent, but continues easier by testing the gradient from only a few examples at a time instead. In its purest type, the gradient is calculated from just one illustration at a time. We update a set of weights iteratively for both gradient descent (GD) and stochastic gradient descent (SGD) to reduce an error function. In normal GD, all training samples must be processed before upgrading the training collection
Weight for a given iteration, although in SGD only a single sample of the whole training package is used to update the weight for a certain iteration. So for large data, if the number of training samples is very large, it might take too long for us to descend gradiently, so any time we change parameter values, we go through the entire training collection. In the other side, SGD is easier, since you only need one sample and it changes automatically from the first sample. SGD also converges even quicker than GD, but the error feature is not as reduced as in GD. Sometimes the near approximation in SGD of the parameter values is adequate in most situations, since they hit the optimum values and stay oscillating there. The gradient descent from Stochastic has a convergence rate that is independent of our dataset scale, and is therefore adapted for broad or even infinite datasets. There are also two downsides to that: due to the sluggish pace of convergence, it does not profit to provide a higher rate of convergence in training because it would not result in a stronger rate of convergence in the test set [15]. Its sensitivity to both parameters, the learning rate and the steady decline.
3.3 ReLU activation function
A(x) = max(0,x) is a statement which tells us that a part or the whole of a picture is A whenever A exceeds its constant (0,x). It prints x if x is nonzero and nothing if it is negative.
4.1 Overview of MIMIC-III
The dataset provided for this master thesis project is Medical Information Mart for Intensive Care-III (MIMIC-III) [7]. MIMIC-III is a freely accessible critical care database. This database contains information of patients collected from Beth Israel Deaconess Medical Canter in Boston, Massachusetts. This database has 26 tables such as admissions, chart events, diagnoses, Intensive Care Unit (ICU) stays, lab events, patients, transfers and so on. Each patient has a unique subject ID and also unique admission ID for each admission. There are around 56000 unique admissions and 46000 unique patients in this database. MIMIC-III contains demographic information about a patient such as their date of birth, date of death, ethnicity, marital status, gender. There is also other information in MIMIC-III such as an expiry flag to indicate death of a patient in a hospital, clinical measurements taken from patients, procedures done on a patient, diagnosis made for each patient for all the admissions, hospital length of stay and so on [18]. MIMIC-III is a collection of information from critical care information systems, hospital database and Social Security Administration Death Master File. Information from two critical care information systems, namely Care Vue and Meta Vision, were merged in this database. According to the standards of Health Insurance Portability and Accountability Act (HIPAA), data deidentification process was carried out before forming MIMIC-III database. Information such as patient’s name, address was removed. The date related information was shifted to sometime in future (between the year 2100 and 2200) with a random offset but without disturbing the actual intervals available in original information. Date of birth of patients who were aged above 89 were shifted to sometime in order to range their date of birth to 300 years according to HIPAA standards. The tables ADMISSIONS, PATIENTS, ICUSTAYS, SERVICES and TRANSFERS can be used to track patients. There are tables prefixed with D_to find out the definitions of codes such as procedures, diagnoses and items which were used to take measurements from a patient. Other tables in MIMIC-III gives information about measurements, observations and billing information for each patient. Diagnosis is represented in International Classification of Diseases (ICD-9) format in the database. The top three ICD-9 code from MIMICIII database can be seen in Table 1.
Table 1. Top-3 ICD codes contain CHF
|
UCD-9 CODE |
DISEASE |
% OF ADMISSIONS |
|
401.9 |
Hypertension |
31.8 |
|
428.0 |
Congestive Heart Failure |
2.01 |
|
427.31 |
Atrial fibrillation |
1.98 |
4.2 Handling irregular values in data
Null values will be deleted if the corresponding rows or columns do not exist. If there are some rows with no values, so all of the values in the column can be deleted. You will drop rows that have one or more null values in their columns.
Data columns in which have non-numeric values may be substituted with the average, or the most frequently occurring value Better than any other approach I've used, this will eliminate data loss. We shall replace the missing values with a statistical method (mean, median).
Figure 3 represents the graph between training and validation losses happening during the training of a proposed model. Proposed model is run from 1 to 100 epochs. Initially the training and validation loss is high. But when the training increases loss is decreases to minimum. That means it indicates the model training is gaining in an effective way.
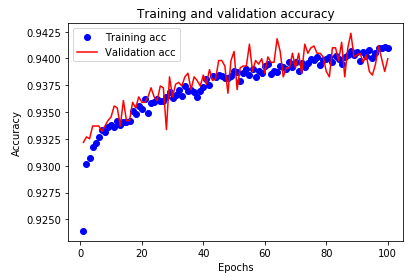
Figure 4 represents the graph between number of epochs vs accuracy of model with respect to training and validation processes. Proposed model is run from 1 to 100 epochs. Initially the training and validation accuracy is low because of huge loss happening because of initially no knowledge with model. Later it increases continuously and almost reaches to more than 90%.
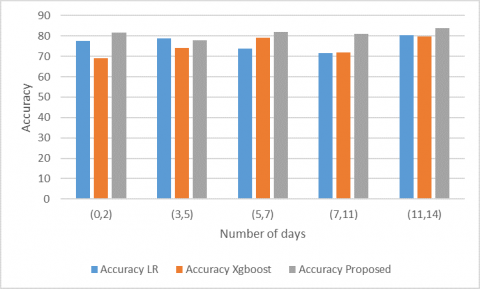
Readmission prediction outcome, if a patient has second visit after a long time, for instance, 300 days, it cannot be considered as readmission and it should be accounted as a new admission since reason behind current admission may not be same as previous admission. Hence, introducing a time window for readmission seems to be necessary. We have used time windows 30, 60 and 90 days and output labels are created accordingly. In case of readmission with time window of 60 days, patients readmitted within 0-60 days of previous discharge has been considered. Similarly, 90 day readmissions consists of visits made within 0-90 days from previous discharge time. Here Figure 5 represents accurate prediction readmission of CHF patient with respect to time slice. Proposed model is compared with existing models. Clearly, proposed model gives better accuracy than existing models.
Here Figure 6 represents the probability of mortality with actual mortality of CHF patients admitted in hospitals. Proposed model is mostly matching to the actual results and also compared with the existing models. Existing models clearly not near to the actual as well as proposed model.
Figure 3. Training and validation loss
Figure 4. Training and validation accuracy
Figure 5. Re-admission accuracy
Figure 6. Probability of mortality
Figure 7. Length of stay
Length of stay is the duration between admit time and discharge time of a patient for a particular visit in number of days. The statistics of length of stay for CHF patient’s prediction can be shown in Figure 7. The figure represents the comparison of existing models Krishna et al., 2020 to the proposed model. Proposed model is better compared to the existing models.
In this article, with the use of chart incidents, demographics and ICD-9 embedding features, we explored the unplanned ICU readmission prediction, length of stay and mortality due to CHF. Chart event characteristics are greatly vulnerable to time series and cannot be accurately captured by traditional machine learning models among the data we used (e.g., logistic regression). We suggest a model based on Woed2Vec-MLP, which can integrate time series data correctly without loss of knowledge.
Compared to the current solution, our machine learning solution for ICU readmission, length of stay and mortality prediction provides greater precision and improved efficiency. In addition, in the predictive model, we demonstrated the relevance of each input function and its variations. This simple and interpretable approach has the potential for meaningful clinical effects by improving clinical decision-making for ICU specialists.
[1] Pedregosa, F., Varoquaux, G., Gramfort, A., Michel, V., Thirion, B., Grisel, O., Blondel, M., Pretten-hofer, P., Weiss, R., Dubourg, V., Vanderplas, J., Passos, A., Cournapeau, D., Brucher, M., Perrot, M., Cournapeau, D., Brucher, M., Duchesnay, E. (2011). Scikit-learn: Machine learning in python. Journal of Machine Learning Research, 12: 2825-2830. http://scikit-learn.sourceforge.net.
[2] Iyyer, M., Manjunatha, V., Boyd-Graber, J., Daumé III, H. (2015). Deep unordered composition rivals syntactic methods for text classification. In Proceedings of the 53rd Annual Meeting of the Association for Computational Linguistics and the 7th International Joint Conference on Natural Language Processing, pp. 1681-1691. https://doi.org/10.3115/v1/P15-1162
[3] Che, Z.P., Purushotham, S., Cho, K., Sontag, D., Liu, Y. (2018). Recurrent neural networks for multivariate time series with missing values. Scientific Reports, 8(1): 6085. https://doi.org/10.1038/s41598-018-24271-9
[4] Boag, W., Doss, D., Naumann, T., Szolovits, P. (2018). What's in a note? unpacking predictive value in clinical note representations. AMIA Summits on Translational Science Proceedings, 2018: 26-34.
[5] Shivade, C., Raghavan, P., Fosler-Lussier, E.F., Embi, P.J., Elhadad, N., Johnson, S.B., Lai, A.M. (2013). A review of approaches to identifying patient phenotype cohorts using electronic health records. Journal of the American Medical Informatics Association, 21(2): 221-230. https://doi.org/10.1136/amiajnl-2013-001935
[6] Escudi ́e, J.B., Rance, B., Malamut, G., Khater, S., Burgun, A., Cellier, C., Jannot, A.S. (2017). A novel data-driven workflow combining literature and electronic health records to estimate comorbidities bur-den for a specific disease: a case study on autoimmune comorbidities in patients with celiac dis-ease. BMC Medical Informatics and Decision Making, 17(1): 140. https://doi.org/10.1186/s12911-017-0537-y
[7] Cohen, R., Elhadad, M., El-hadad, N. (2013). Redundancy in electronic health record corpora: Analysis, impact on text mining performance and mitigation strategies. BMC Bioinformatics, 14(1): 10. https://doi.org/10.1186/1471-2105-14-10
[8] Denis Jered McInerney, Borna Dabiri, Anne-Sophie Touret, Geoffrey Young, Jan-Willem van de Meent, and Byron C Wallace. 2020. Query-focused her summarization to aid imaging diagnosis. arXivpreprint arXiv:2004.04645
[9] Liang, J.F., Tsou, C.H., Poddar, A. (2019). A novel system for extractive clinical note summarization using EHR data. Association for Computational Linguistics, 46-54. https://doi.org/10.18653/v1/W19-1906
[10] Alsentzer, E., Kim, A. (2018). Extractive summarization of ehr discharge notes. arXiv preprint arXiv:1810.12085.
[11] Wang, Y.S., Wang, K.W., Rastegar-Mojarad, M., Moon, S., Shen, F.C., Afzal, N., Liu, S., Zeng, Y.Q., Mehrabi, S., Sohn, S., Liu, H.F. (2018). Clinical information extraction applications: A literature review. Journal of Biomedical Informatics, 77: 34-49. https://doi.org/10.1016/j.jbi.2017.11.011
[12] Purushotham, S., Meng, C.Z., Che, Z.P., Liu, Y. (2018). Benchmarking deep learning models on large healthcare datasets. Journal of Biomedical Informatics, 83: 112-134. https://doi.org/10.1016/j.jbi.2018.04.007
[13] Krishna, K., Khosla, S., Bigham, J.P., Lipton, Z.C. (2020). Generating soap notes from doctor-patient conversations. Computation and Language, v1.
[14] Johnson, A.E.W., Pollard, T.J., Mark, R.G. (2017). Reproducibility in critical care: A mortality prediction case study. In Machine Learning for Healthcare Conference, 68: 61-376.
[15] Che, Z.P., Purushotham, S., Cho, K., Sontag, D., Liu, Y. (2018). Recurrent neural networks for multivariate time series with missing values. Scientific Reports, 8(1): 6085. https://doi.org/10.1038/s41598-018-24271-9
[16] Arepalli, G., Erukula. S.B. (2016). Secure multicast routing protocol in MANETs using efficient ECGDH algorithm. International Journal of Electrical and Computer Engineering, 6(4): 1857-1865. https://doi.org/10.11591/ijece.v6i4.9941
[17] Ford, E., Carroll, J.A., Smith, H.E., Scott, D., Cassell, J.A. (2016). Extracting information from the text of electronic medical records to improve case detection: A systematic review. Journal of the American Medical Informatics Association, 23(5): 1007-1015. https://doi.org/10.1093/jamia/ocv180
[18] Rajkomar, A., Oren, E., Chen, K., Dai, A.M., Hajaj, N., Hardt, M., Liu, P.J., Liu, X.B., Marcus, J., Sun, M. (2018). Scalable and accurate deep learning with electronic health records. NPJ Digital Medicine, 1(1): 18. https://doi.org/10.1038/s41746-018-0029-1