Ashish Tripathi* | Arush Jain | Krishna K. Mishra | Anand Bhushan Pandey | Prem Chand Vashist
© 2020 IIETA. This article is published by IIETA and is licensed under the CC BY 4.0 license (http://creativecommons.org/licenses/by/4.0/).
OPEN ACCESS
Due to the rapidly spreading nature of coronavirus, a pandemic situation has emerged around the world. It is affecting society at large that includes the global economy and public health too. It was found in recent studies that the novel and unknown nature of this virus makes it more difficult to identify and treat the affected patient in the early stage. In this context, a time-consuming method named reverse transcription-polymerase chain reaction (RT-PCR) is being used to detect the positive cases of COVID-19, which requires blood samples of the suspects to diagnose the disease. This paper presents a new deep learning-based method to detect COVID-19 cases using chest X-ray images as the recent studies show that the radiology images have relevant features that can be used to predict the COVID-19. The proposed method is developed for binary classification to identify that a person is infected with COVID-19 or not. A total of 2400 X-ray images are taken for the experimental work. It includes 1000, COVID-19, and 1000, non-COVID-19 images, 200, COVID-19, and 200, non-COVID-19 testing images. The proposed method has been compared with the existing state-of-the-art methods on various statistical parameters which give better results with higher accuracy in diagnosing the COVID-19 cases. The proposed method has obtained 98.25% accuracy, 98.49% precision, 98% sensitivity, 98.50% specificity, and 98.25% F1 score.
Convolutional Neural Network (ConvNet or CNN), RT-PCR, COVID-19, X-ray images, MCNN
As of yet reported, at the end of December 2019, an unusual and unidentified case of pneumonia originated from Wuhan city, Hubli Province of China. Initially, the symptoms of this disease were very similar to the known pneumonia. But, “Chinese Centre for Disease Control and Prevention (China CDC)” experts reported based on the analysis of various respiratory samples (throat swab samples) that this is a new kind of virus-infected disease. It spreads through a novel coronavirus and looks very similar to the native family of SARS-CoV and MERS-CoV [1]. Later on, the World Health Organization (WHO) officially announced the name of this disease as COVID-19 (coronavirus disease). As per the reports of WHO, till 23rd July 2020, the pandemic had covered 205 countries, 10,719,946 confirmed cases, and 517,337 confirmed deaths [2] were reported. COVID-19 has become a global threat to humanity. According to the research so far the coronavirus spreads among humans through facilitation via direct contact or inhalation of infected droplets and touching contaminated hand/places/objects/surface [1]. However, in some cases, the presence of gastrointestinal symptoms or live infectious virus in faecal might be another possible route of spread of infections in humans through faecal-oral transmission [3]. Droplets have two categories based on their sizes, known as respiratory droplets and nuclei droplets If the size of the droplet is >5-10 μm, then it is named to as respiratory droplet, and if the size is <5 μm, then it is named as nuclei [4] droplet. As per the current research, respiratory droplets are primarily responsible for the transmission of coronavirus in humans [5]. It has been proved by Phylogenetic analysis that the SARS-CoV-2, SARS-CoV, and MERS-CoV belong to Orthocoronavirinae, which further belongs to the Coronaviridae family [6]. But, both the viruses SARS-CoV and MERS-CoV are distinct from SARS-CoV-2 [7].
Generally, the symptoms of COVID-19 are dry cough, respiratory signs (like flu), acute fever, tiredness, and headache. The appearance of the disease may range from negative symptoms to positive symptoms. Here, positive symptom means the presence of the disease outbreak. In a recent study done over 41 patients who initially diagnosed with COVID-19, the most common symptoms available in the majority of the patients were cough, fever, and fatigue, while in some cases a severe and even fatal symptoms were noticed like difficulty in breathing, headache, hemoptysis, dyspnoea, diarrhea, and lymphopenia [8]. All patients were found to be affected by pneumonia after a chest CT scan. About 29% of the cases were of acute respiratory distress syndrome, 12% of cases of an acute heart injury, and 10% of cases of other infections were identified [8].
In recent studies, it is found that the automatic diagnosis of COVID-19 may help to implement different safety measures such as putting the patients in the quarantine centre on time, using specialized hospitals for incubation on time for the critical patients, and real-time monitoring of COVID-19 cases. In the current time, a real-time reverse transcription-polymerase chain reaction (RT-PCR) is being commonly used that takes respiratory specimens of the patients to diagnose the COVID-19 cases [9]. Thus, RT-PCR requires repetition in the test to make a confirm report [10]. Also, the sensitivity rate of RT-PCR is commonly between 60% -70% that can affect the diagnosis [11]. So, a valid environment needs to be developed, where proper medical care and quick treatment be available to take care of the patients against the COVID-19. Also, considering the fast-spreading nature of the COVID-19, it requires a diagnostic method that gives a quick response to the presence of disease in a human body. In this context, radiological images such as X-ray and Computed Tomography (CT) could be a better and faster way to diagnose COVID-19 cases [12]. It motivates us to work on radiological images through the identification of potential patterns that may help to diagnose the disease automatically. However, it requires some expert methods for automatic feature extraction and image classification. Diagnostic techniques based on Artificial Intelligence (AI) are being observed as a better alternative to provide expected results over the radiological images in terms of detecting the COVID-19 cases. Especially, deep learning, a sub-field of machine learning has gained acceptance in the field of artificial intelligence for mining, analyzing, and recognizing distinct data patterns. Deep learning creates an end to end model, which takes data as input and gives desired results, with automatic feature extraction and no manual intervention. The increased number of hidden layers of deep learning models help to potentially enhance the performance of the network as compared to the traditional models. Major application areas of deep learning are speech recognition [12], computer vision [12], and natural language processing [11]. In literature, we can see the significance of deep learning techniques in many applications such as breast cancer detection [13], segmentation of lung [14], X-ray images for pneumonia detection [15], and classification of skin cancer [16]. Recently, several deep learning models have been used on radiological images to detect DOVID-19. A deep learning model named COVIDX-net was proposed by Hemdan et al. [17] to diagnose the COVID-19 on X-ray images. Narin et al. [18] have proposed a deep learning model for the detection of COVID-19 cases on chest X-ray images. They found a 98% detection accuracy in the results.
Convolutional Neural Network (ConvNet or CNN), which is known as a class of deep neural networks in deep learning, uses convolution to perform feature extraction automatically. Learning of complex information is based on going deeper into the network and each layer is responsible for transforming and getting the abstract level of the data. CNN is widely applicable in computer vision. CNN has a significant role in image segmentation and classification in image processing. In recent years, CNN has been applied on chest X-ray images to diagnose pneumonia with high accuracy. COVID-Net was developed by Wang and Wong [19] for the classification of COVID-19, pneumonia, and normal images with an accuracy rate of 92.4%. Rajpurkar et al. [20] have proposed a CNN model named CheXNet. This model includes 121 layers of CNN for training over X-ray images to detect pneumonia. Another CNN method DenseNet-121 is proposed by Antin et al. [21] to detect pneumonia from the chest X-ray images. Recently, various models based on deep learning have been developed to analyze the COVID-19 from chest X-ray images, but, most of the methods are found to be less efficient in classifying the difference between COVID-19 and non-COVID-19 patients accurately and also take much time to analyze the cases in early stages. Also, in a study, it was observed that the recovered cases of COVID-19 were found positive again, during the re-diagnosis done after 5-13 days [22].
Some disadvantages of the conventional RT-PCR method are like the first, the unavailability of a sufficient number of RT-PCR test kits, and second, it includes the manual process for collecting respiratory specimens creating a chance of malfunctioning in diagnosis done by the experts. The third one is that it is a time-consuming process for getting test results, and fourth the detection rate of the test is very low, it commonly lies between 30% -50% so RT-PCR requires repetition of tests to confirm a positive or negative test result.
Artificial Intelligence (AI) based diagnostic techniques are a better alternative and provide expected results in terms of detecting the COVID-19 cases using radiological images. The deep learning model named COVIDX-net diagnoses the COVID-19 on X-ray images and another detects COVID-19 cases on chest X-ray images. They show 98% accuracy in the results while detecting COVID-19 cases. However, in most of the cases, these methods performed less efficiently in classifying the positive and negative tested patients accurately in the early stages.
Hence, it is required to propose such a method that can give an earlier diagnosis of COVID-19 with zero tolerance and higher accuracy. In the paper, a modified CNN named Modified Convolutional Neural Network (MCNN) is proposed for the earlier detection of COVID-19 from the X-ray images. The proposed method shows better results as compared to other existing state-of-the-art deep learning models that helped in earlier diagnosis of COVID-19 through X-ray image classification & observation, together under the clinical support.
2.1 Severe acute respiratory syndrome coronavirus-2 (SARS-CoV-2)
Orthocoronavirinae is the subfamily of the Coronaviridae family and Coronaviruses (CoVs) comes under Orthocoronavirinae. Coronaviruses (CoVs) are a group of four families such as Coronaviridae, Arteriviridae, Mesoniviridae, and Roniviridae and they belong to the Nidovirales order. Four genera respectively alphacoronavirus (αCoV), betacoronavirus (βCoV), deltacoronavirus (δCoV), and gamacoronavirus (γ-CoV) come under the Orthocoronavirinae subfamily [18, 19]. SARS-CoV-2 is a novel virus that belongs to the betacoronavirus (βCoV) lineage. Coronaviridae family members are positive single-stranded, enveloped, and very large Ribonucleic Acid (RNA) viruses. In comparison to other known RNA viruses, the genome size of Coronaviridae family viruses is comparatively large [20, 23]. The genome size lies between 25000 bp (25 kb) to 32000 bp (32 kb), and the size in diameter of virion can vary from 118 to 136 nm.
2.2 Transmission of coronavirus
A number of investigations have already been made but the potential host of the SARS-CoV-2 [24] is not known yet. Based on some studies, it was suggested recently that the bats might be the host of this virus [25]. The genetic sequence of coronavirus is 95% similar to bat coronavirus, and 70% similar to SARS-CoV [26]. Figure 1 shows the origin of coronavirus and spread into humans through potential mediums. Eating the meat of the animal (primary host) or close contact with an intermediate host is the major cause of the transfer of infection from animal to human. Then an infected person transmits the virus to other healthy people. Next, the virus is transmitted to the public through human-to-human interaction.
2.3 Convolutional Neural Network (CNN)
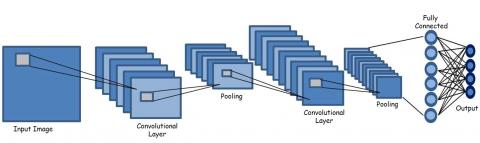
Convolutional Neural Network (CNN or ConvNet) is a deep learning algorithm that extracts vital features from the input images. It is a better algorithm in comparison to the traditional algorithms as it can learn the features of the images and save the weights of the features extracted for future reusability [27]. CNN architecture looks the same as the connectivity of the neurons of the brain of a human body, where each neuron performs its function in a restricted area. CNN can capture the spatial and temporal dependencies of each image in the dataset by applying the appropriate filtering techniques for the images. The basic functionality of CNN is to extract the features of the image. It reduces the dimension of the image without affecting the characteristics of the image and also gives the prediction with high accuracy [28]. Figure 2 represents the basic architecture of CNN where the basic layers that are the Convolutional layer and pooling layer are applied to the input image. After that, the matrix so obtained by applying these layers is then converted into a single column matrix, and then image features are extracted successfully.
Figure 1. Spreading of corona virus
Figure 2. Basic architecture of Convolutional Neural Networks (CNNs)
3.1 Details of X-ray image dataset
In the study, chest X-ray images have been collected from various sources [29-35]. It includes images of basically two categories that are COVID-19 and Non-COVID-19. It consists of images of varying dimensions and various age groups. The dataset is categorized into two sets, which includes a training set and a testing set. There are 2000 images in the training set and 400 images in the testing set. All the images are in the JPEG format and occupy 622 MB of the system space. The dataset is a structured dataset consisting of an equal number of images of each category for training and testing intents. The train and test datasets are in the proportion of 10:2 (1000:200).
The distribution of image datasets for training and testing is shown in Table 1. For a particular class (COVID-19 or non-COVID-19), 1000 images have been used for training, and 200 images for testing. Since there are 2 classes i.e., class 1 (COVID-19) and class 2 (non-COVID-19), it can be seen that out of 2400 images, 2000 images are available in the training set, and 400 images are part of the testing set.
Table 1. Distribution of the dataset
|
Image Category |
Train |
Test |
|
COVID-19 |
1000 |
200 |
|
Non COVID-19 |
1000 |
200 |
|
Total |
2000 |
400 |
In Table 2, the varying dimensions of the input images are shown in pixels where the minimum width of the class of COVID-19 images is 255, and the maximum width is 4248. The minimum and maximum height of these images are 249 and 3480, respectively. For the class of Non-COVID-19 images, the minimum and maximum width of the image is 976 &, 2890 respectively, and the minimum and the maximum height of the image is 616 & 2534.
Table 2. Distribution of the dataset
|
Image Category |
Minimum Width |
Maximum Width |
Minimum Height |
Maximum Height |
|
COVID-19 |
255 |
4248 |
249 |
3480 |
|
Non COVID-19 |
976 |
2890 |
616 |
2534 |
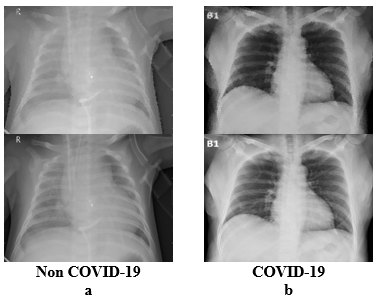
Figure 3 shows a sample of chest X-ray images of COVID-19 and non-COVID-19. Such type of images has been taken from the dataset used for the proposed model. Figure 3.a shows the chest X-ray images of Non-COVID-19 people, and Figure 3.b shows the chest X-ray images of COVID-19 infected people.
Figure 3. Sample Images of Non COVID-19 and COVID-19 patients [23-29]
3.2 Proposed method
The parameters are tuned in such a way that the proposed method, modified Convolutional neural network (MCNN) attains high accuracy with less time. The basic CNNs model is tuned by removing un-wanted layers that take more time. Some additional layers are added that can extract more vital and accurate features efficiently without putting the model into the overfitting condition. For that Rectified Linear Unit (ReLU) and Sigmoid activation functions are used. To optimize the proposed method, pool and dropout have been tuned enough that helps to achieve a 98.25% accuracy by the proposed algorithm. The number of layers and dropout layers have been evaluated during multiple times of training to record the loss and accuracy of the model. This record is used as feedback to train the model. Activation functions, drop out layers, convolutional layers, max-pooling layers, and dense layers are tuned enough such that the loss in training would be minimum. Also, the unnecessary layers and functions are removed so that the overall time is reduced, and the accuracy is not affected. Hence, by using the proposed MCNN an accurate diagnosis result of whether a person is COVID-19 positive or not can be achieved. The MCNN will save money and time, so the efficiency of the whole diagnosing procedure will increase by adopting this method.
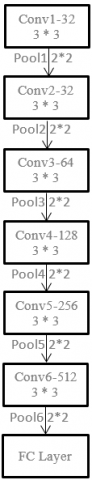
Figure 4 shows the sequence in which the layers are used in the model. Conv is used to represent the Convolutional layers which are used in the training. Here x represents the number of the layer, e.g., Conv1, Pool2, etc. The Pool represents the pooling operation. Here, the Fully Connected (FC) layer represents that flatten, dense, and dropout operations have been performed and x represents the number of layers, e.g., Conv1, Pool2, etc.
Figure 4. Layer wise layout of the proposed model
3.2.1 Proposed algorithm
Algorithm 1: Training the model
Input: Image dataset
Output: Weights of the proposed model
Method: Model Training
Begin
Step 1. Load the training and testing images and convert them into the training set and validation set.
Step 2. Construct a model with 6 convolutional layers where the kernel size is increased in each layer. After each convolutional layer apply pooling layer to maintain dimensionality. After the 6th convolutional layer flattens the output and pass it to fully connected layer.
Step 3. Apply sigmoid activation function at last to distinguish the images.
Step 4. Save the weight file to use it separately to distinguish the input image class.
End
Algorithm 2: Classification
Input: Input Image
Output: Label of input image
Method: Classification of input image
Begin
Step 1. Feed the input image to the neural network.
Step 2. Obtain output vector by matching the weight file and input image.
Step 3. Use the output vector to perform image annotations.
End
3.2.2 Architecture of the MCNN
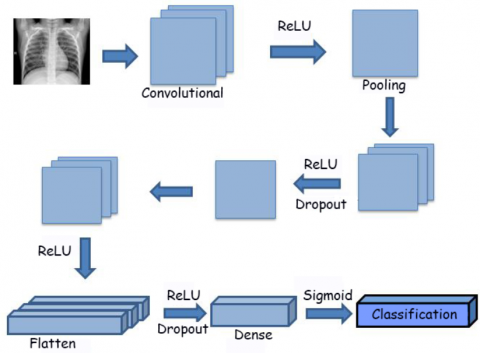
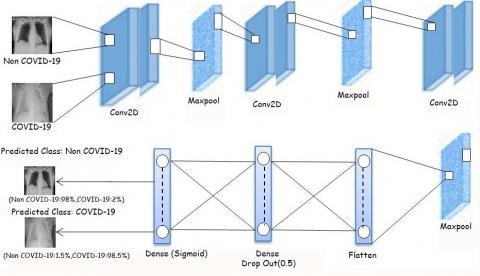
The input image is given to the Convolutional layer. The image is split into different layers. Each layer contains different features of the image. Then the ReLU activation function is performed where all the negative values are replaced by zero. Pooling is done to reduce the size of the image matrix. Then again the image matrix is passed through the Convolutional layer. Then ReLU function is performed on the matrix generated. Pooling has been done after performing the ReLU activation function. The image matrix obtained now is passed through the Convolutional layer again for feature extraction. Now after performing ReLU function the dropout layer is performed. In the dropout layer, some neurons of the previous layer have not been connected. The dropout layer decreases the overfitting. Now a combination of the Convolutional layer, ReLU function, Dropout layer, and pooling layer are performed 3 more times. Then the flatten layer is used for a fully connected layer. The flatten layer has converted the image matrix into a vector form. Now ReLU function is used which removes any negative value. After that, the dense layer is applied four times which is followed by the ReLU function. The dense layer checks whether each neuron is connected with the previous layer or not. After applying a dense layer dropout layer is performed. This dropout layer has decreased the overfitting curve by reducing the training loss. At last sigmoid function is used for classification of the image into the categories. This procedure is shown in Figure 5.
Figure 5. Layer operations in the proposed method
The sequence in which layers have been used in the purposed model is given below. In the sequence, C is used for the Convolutional layer, R for the ReLU activation function and P denotes the pooling layer. DR indicates the dropout layer, F represents the flattening layer, D symbolizes dense and S is used for the sigmoid activation function. It is shown that there are 6 Convolutional layers in the model.
C1 – R – P1 – C2 – R – P2 – C3 – R – P3 – DR – C4 – R – P4 – DR – C5 – R – P5 – DR – C6 – R – P6 – DR – F – D – R – D – R – D – R – D – R – DR – D – S
The architecture of the MCNN is shown in Figure 6, where first the input image is passed through the Convolutional layer denoted as Conv2D where feature extraction is being done at various levels and layers of the image are split. Then the extracted features are given to the pooling layer denoted by MaxPool because at this layer the features extracted from the Convolutional layer are stored in a smaller matrix which is obtained by marking the matrix cell with the highest value of the kernel matrix when imposed over the Convolutional layer matrix. This process is performed several times with only a change in the number of features to be extracted from the previous layer. After that, when the feature extraction has been done and an increased loss was observed even by applying MaxPool then dropout is used. Now the two-dimensional MaxPool layer is flattened into a single column matrix form and a dense layer is applied to the flatten layer. Sigmoid activation function has been used in the last layer for classification, the highest percentage, in which the image is matching, is calculated, and the image is predicted to be belonging to that class.
Figure 6. Architecture of MCNN
4.1 Simulation setup
Table 3 shows the system specifications used to build the MCNN. The hardware configuration includes an Intel Core i5 processor having RAM of 4 GB with a 64-bit operating system. The codes are written in Python 3.7 version (64 bit) programming language and have been executed on Google Colab for GPU. Windows 10 Home is used as an operating system.
Table 3. Specification of the system and software
|
Name |
Specification |
|
Processor |
Intel Core i3, 64 |
|
RAM |
4 GB |
|
System Type |
64 bit Operating System |
|
Software |
Python 3.7 (64 bit) |
|
Setup |
Google Colab |
|
Operating System |
Windows 10 Home |
4.2 Layers and layer parameters
The number of Convolutional layers and dense layers are shown in Table 4. The corresponding features and kernel matrix size is shown in the second column as the output shape. In the output shape of the convolutional layer, the first two numbers are the new height and width of the image. The third number of output shape is the number of output filters in the convolution. The output shape corresponding to the dense row denotes the unit of the layer. The parameters column indicates the number of trainable parameters that are trained using that layer.
Table 4. Layer architecture of MCNN
|
Layer |
Output Shape |
Parameters |
|
Conv2d |
(198,198,32) |
896 |
|
Conv2d |
(97,97,32) |
9248 |
|
Conv2d |
(46,46,64) |
18496 |
|
Conv2d |
(21,21,128) |
73856 |
|
Conv2d |
(8,8,256) |
295168 |
|
Conv2d |
(2,2,512) |
1180160 |
|
Dense |
(512) |
262656 |
|
Dense |
(256) |
131328 |
|
Dense |
(128) |
32896 |
|
Dense |
(64) |
8256 |
|
Dense |
(1) |
65 |
4.3 Confusion matrix
In Table 5 the format of the confusion matrix is mentioned. It shows that vertical columns of class A and class B are the actual images of the classes and the horizontal columns contain the predicted class of class A and class B. From this, we get the following four values of the confusion matrix that are true positive (TP), true negative (TN), false-negative (FN), and false-positive (FP). TP and TN indicate that the actual class and the predicted class are the same and hence correct prediction was made. While FN and FP mean, the actual class differs from the predicted class and hence an incorrect prediction was observed.
Table 5. Confusion matrix format
|
|
|
Predicted Class |
|
|
|
|
Class A |
Class B |
|
Actual Class |
Class A |
TP |
FN |
|
Class B |
FP |
TN |
|
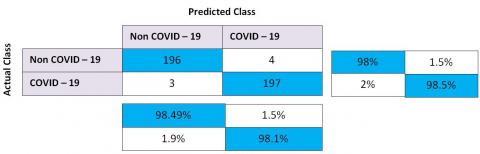
Table 6 shows the confusion matrix obtained by building the proposed model and gives the value of true positive (TP), false positive (FP), true negative (TN), false negative (FN) for the classes Non-COVID-19 and COVID-19. According to the matrix, the diagonal cells represent that a correct prediction of that particular class has been done. While the rest of the cells of the row represents a wrong prediction has been done. From Table 6 it can be seen that when 200 images of Non-COVID-19 are given for testing then 196 images have been categorized as Non-COVID-19 images, while 4 images were predicted as being COVID-19 images. Thus, the accuracy of the Non-COVID-19 class is 98%. While if 200 test images of COVID-19 class are given then 3 images are classified as Non-COVID-19 images and 197 images were classified as COVID-19 images. Hence, COVID-19 class has an accuracy of 98.25%.
Table 6. Confusion matrix
4.4 Evaluation technique
Accuracy has been defined as the ratio value of the sum of correct predictions done for each class to the total number of predictions done.
Precision is the ratio value of the true class and correct predictions to all the predictions of the true class.
Sensitivity has been defined as the ratio value correct prediction of actual true class to the sum of all the predictions done on predicted true class.
Specificity is the value of the ratio of all correct predictions of a negative event to the sum of all the predictions done on the actual negative event class.
F1 Score is the value that denotes the harmonic mean of sensitivity and precision.
Table 7 shows the value of the five parameters such as accuracy, sensitivity, specificity, precision, and F1 score of the MCNN. The values have been obtained mathematically with the help of the formula and the value of TP, FP, TN, and FN obtained from the matrix as shown in Table 6.
Table 7. Result on different parameters
|
Parameters |
Value |
|
Sensitivity |
98.00 |
|
Precision |
98.49 |
|
Accuracy |
98.25 |
|
Specificity |
98.50 |
|
F1 Score |
98.25 |
4.5 Experimental results
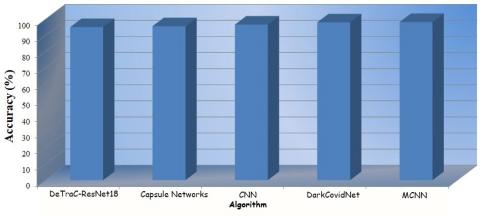
For the experimental work, only the COVID-19 and non-COVID-19 images are taken excluding the Pneumonia images which decrease the time complexity. Since now the input image is needed to be categorized into two categories instead of three categories. In Table 8 results on the basis of accuracy have been given. It is shown that MCNN is the most accurate algorithm and gives better results in comparison to other state-of-the-art algorithms such as DarkCovidNet [36], DeTraC-ResNet18 [37], Capsule Networks [38], and CNN [39].
Table 8. Accuracy
|
S. No. |
Algorithm |
Accuracy (%) |
|
1. |
DeTraC-ResNet18 |
95.12 |
|
2. |
Capsule Networks |
95.70 |
|
3. |
CNN |
96.67 |
|
4. |
DarkCovidNet |
98.08 |
|
5. |
Proposed Work (MCNN) |
98.25 |
In Figure 7 the graphical representation of the accuracy analysis is shown. On the X-axis the algorithm name is plotted and on the Y-axis the accuracy value is plotted.
Figure 7. Accuracy
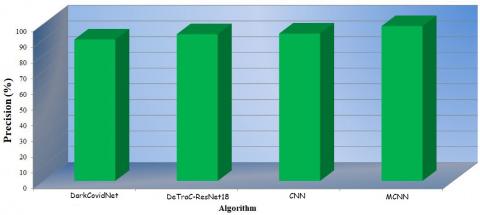
In Table 9 the precision analysis is shown. The proposed work has the highest precision value in comparison to the other algorithms. It denotes that the proposed MCNN is the most précised algorithm when compared to the other algorithms.
Table 9. Precision
|
S. No. |
Algorithm |
Precision (%) |
|
1. |
DarkCovidNet |
89.96 |
|
2. |
DeTraC-ResNet18 |
93.36 |
|
3. |
CNN |
93.75 |
|
4. |
Proposed Work (MCNN) |
98.49 |
In Figure 8 the graphical representation is shown where the X-axis is plotted with the name of the algorithm and the Y-axis represents the accuracy value in terms of the percentage of the algorithms.
Figure 8. Precision
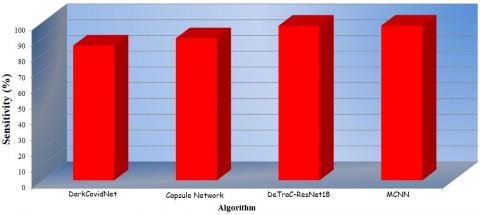
Sensitivity analysis is shown in Table 10. The proposed work has the highest sensitivity value in comparison to the other algorithms. It signifies that the proposed MCNN is the most sensitive algorithm in comparison to the other algorithms.
Table 10. Sensitivity
|
S. No. |
Algorithm |
Sensitivity (%) |
|
1. |
DarkCovidNet |
85.35 |
|
2. |
Capsule Networks |
90.00 |
|
3. |
DeTraC-ResNet18 |
97.91 |
|
4. |
Proposed Work (MCNN) |
98.00 |
In Figure 9 a graph is shown where the X-axis is plotted with the algorithm’s name given in Table 10. The Y-axis symbolizes the sensitivity value in the percentage value of the algorithms.
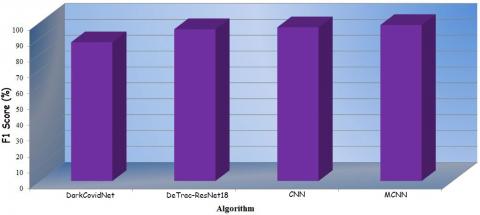
The F1 score of all algorithms is shown in Table 11. The proposed work shows a better F1 score in comparison to other algorithms.
Figure 9. Sensitivity
Table 11. F1 score
|
S. No. |
Algorithm |
F1-Score (%) |
|
1. |
DarkCovidNet |
87.37 |
|
2. |
DeTraC-ResNet18 |
95.58 |
|
3. |
CNN |
96.77 |
|
4. |
Proposed Work (MCNN) |
98.25 |
In Figure 10 a graph is plotted where the X-axis is plotted with the name of the algorithms in Table 11. The Y-axis represents the F1 score value of all algorithms in terms of percentage.
Figure 10. F1 score
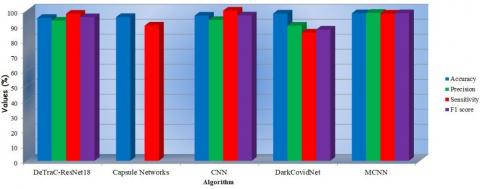
4.6 Comparative analyses
There are various algorithms for binary classification that have been proposed for the diagnosis of the COVID-19 as shown in Table 12. Table 12 indicates the comparison of different algorithms on distinct parameters. A comparative result is shown in Figure 11 based on the data given in Table 12. The various parameters such as accuracy, precision, sensitivity, and F1 score of these algorithms are compared. It is observed that the overall performance of the MCNN is better than other algorithms. Thus, the MCNN can be considered as an effective diagnosis algorithm for COVID-19 in comparison to the other state-of-the-art algorithms on all parameters.
Table 12. Comparative results of different parameters
|
Algorithm |
Accuracy (%) |
Precision (%) |
Sensitivity (%) |
F1 score (%) |
|
DeTraC-ResNet18 [31] |
95.12 |
93.36 |
97.91 |
95.58 |
|
Capsule Networks [34] |
95.70 |
- |
90.00 |
- |
|
CNN [34] |
96.67 |
93.75 |
100 |
96.77 |
|
DarkCovidNet [30] |
98.08 |
89.96 |
85.35 |
87.37 |
|
Proposed Work (MCNN) |
98.25 |
98.49 |
98.00 |
98.25 |
Figure 11. Comparative analysis of the results obtained for different parameters
DarkCovidNet proposed by Ozturk et al. [36] where a regular darknet network is used without any dropout layer within the network due to which it has an accuracy of 98.08%, the precision of 89.96%, the sensitivity of 85.35%, and an F1 score value is 87.37%. Abbas et al. [37] proposed the DeTraC-ResNet18 for the diagnosis of the COVID-19 disease as it can easily handle the irregularities present in the image dataset. The DeTraC-ResNet18 network has an accuracy of 95.12%, a precision of 93.36%, a sensitivity of 97.91%, and an F1 Score is 95.58%. Covid-Caps algorithm known as Capsule Network proposed by Afshar et al. [38]. In this model capsule network is used to diagnose the symptoms of COVID-19 in a person. It has an accuracy of 95.7% and sensitivity is 90%. Trehan [39] proposed the Convolutional neural network for the diagnosis of COVID-19. The dataset is classified into two classes Normal and COVID. The model has an accuracy of 96.67%, precision is 93.75%, sensitivity is 100% and the F1 value is 96.77%.
The proposed MCNN has the highest accuracy, precision, and F1 Score. But the CNN model proposed by Trehan for COVID-19 has the highest sensitivity value of 100%. Even though the MCNN shows less sensitivity in comparison to the model proposed by Tehran but the overall performance of the MCNN is comparatively better than the existing models for all parameters. In the MCNN, the number of network layers has been optimized to get the optimal result in terms of accuracy and time. Because fewer layers led to a less accurate model and more layers take time to train and make predictions too. Hence by adopting MCNN for diagnosing COVID-19 infections an accurate diagnosis can be achieved. It will save money and time thus the efficiency of the whole diagnosing procedure will increase by adopting the proposed algorithm.
MCNN is a fine-tuned neural network. As CNN has varying parameters for each layer. While in MCNN the parameters to be passed are fixed. As MCNN contains six convolutional layers. In CNN there is no limit on the number of convolutional layers. In MCNN every convolutional layer has been followed by a max-pooling layer to maintain the dimensionality of the image. In CNN pooling layer can be either a max-pooling layer or an average pooling layer. MCNN consists of seven dense layers with fix sequence of parameters to be passed. In CNN there is no limit on the number of dense layers. The dense layer can have different values of parameters. In MCNN dropout layers have also been applied to prevent the graph from going into an overfitting region. The dropout layer is not mandatory on CNN. In CNN there are various activation functions such as leaky ReLU, ELU, softmax, softsign, etc. In MCNN only ReLU and sigmoid activation function had been used. Every layer has been parameterized properly. The sequence in which layers should be applied is fixed. Parameters are so tuned that the graph goes neither in the under- fitting region nor in the overfitting region. MCNN graph curve falls in the good fit curve category. In this way, MCNN has a minimum number of layers and gives good accuracy.
After the declaration of COVID-19 as global pandemic disease, its earlier diagnosis has become a solution to prevent its further spread. To perform the diagnosis of COVID-19, a blood specimen of a person is used in the traditional laboratory tests like RT-PCR. Most of the time to get the accuracy of the result, repeated testing of the specimen is required that takes a lot of time. There are some other limitations of RT-PCR which creates a lot of problems in diagnosis such as the chances of interchange of the blood specimens of two persons, less accurate results, and the wrong diagnosis due to human mistake cannot be ignored. It has also been noted that RT-PCR for the diagnosis of COVID-19 is not available everywhere, and is limited in quantity. Due to this, it is required to search for an alternative that would be more reliable, fast, and is easily available. Deep Learning is a solution for the diagnosis of COVID-19 where different neural networks can be used to classify the chest X-ray images whether they are COVID-19 or not, more accurately and in less time. This approach is effective as all hospitals contain at least one machine for capturing the radiological images. Neural network algorithms are capable of learning how to distinguish between images and predict which image falls in which category. Hence it makes an accurate prediction in less time.
The proposed algorithm MCNN is a modified deep Convolutional neural network, where changes are applied to the parameters and layers of a deep convolutional neural network. Hence a modified algorithm has been developed in which a structured dataset is used giving an accurate and precise result in less time. When considering the time with respect to the layers are limited that means the layers up to which the distinguishing features can be extracted have been applied. When any loss in feature extraction is observed then a dropout layer is added to reduce the loss and maintain an optimal feature extraction. ReLU and Sigmoid activation functions are used in this model. By applying such changes an accuracy level of 98.25% is achieved with a precision of 98.49% and an F1 score of 98.25%. When compared with the different algorithms it is observed that the proposed work is having the highest accuracy, precision, and F1 score value. As image classification is found to be a way to diagnose other medical diseases too with more accuracy and in less time in comparison to the persisting diagnosis methodology and hence in future deep learning and image classification can be robust in the field of medical science to diagnose several diseases
[1] Huang, C., Wang, Y., Li, X., et al. (2020). Clinical features of patients infected with 2019 novel coronavirus in Wuhan, China. The Lancet, 395(10223): 497-506. https://doi.org/10.1016/S0140-6736(20)30183-5
[2] WHO (World Health Organization), 2020, https://experience.arcgis.com/experience/685d0ace521648f8a5beeeee1b9125cd, accessed on 20 July 2020.
[3] Gu, J., Han, B., Wang, J. (2020). COVID-19: Gastrointestinal manifestations and potential fecal-oral transmission. Gastroenterology, 158(6): 1518-1519. https://doi.org/10.1053/j.gastro.2020.02.054
[4] WHO Guidelines (World Health Organization) Guidelines. Infection prevention and control of epidemic- and pandemic-prone acute respiratory infections in health care. Geneva: World Health Organization; 2014 Available from: https://apps.who.int/iris/bitstream/handle/10665/112656/9789241507134_eng.pdf?sequence=1, accessed on 20 July 2020.
[5] Liu, J., Liao, X., Qian, S., Yuan, J., Wang, F., Liu, Y., Wang, Z., Wang, F., Liu, L., Zhang, Z. (2020). Community transmission of severe acute respiratory syndrome coronavirus 2, Shenzhen, China, 2020. Emerg Infect Dis., 26(6): 1320-1323. https://doi.org/10.3201/eid2606.200239
[6] Li, H., Liu, S.M., Yu, X.H., Tang, S.L., Tang, C.K. (2020). Coronavirus disease 2019 (COVID-19): Current status and future perspective. International Journal of Antimicrobial Agents, 55(5): 105951. https://doi.org/10.1016/j.ijantimicag.2020.105951
[7] Zhu, N., Zhang, D., Wang, W., et al. (2020). A novel coronavirus from patients with pneumonia in China, 2019. N Engl J Med., 382: 727-33. https://doi.org/10.1056/NEJMoa2001017
[8] Cao, M., Zhang, D., Wang, Y., Lu, Y., Zhu, X., Li, Y., Xue, H., Lin, Y., Zhang, M., Sun, Y., Yang, Z. (2020). Clinical features of patients infected with the 2019 novel coronavirus (COVID-19) in Shanghai, China. MedRxiv.
[9] Liu, R., Han, H., Liu, F., Lv, Z., Wu, K., Liu, Y., Feng, Y., Zhu, C. (2020). Positive rate of RT-PCR detection of SARSCoV-2 infection in 4880 cases from one hospital in Wuhan, China, from Jan to Feb 2020. Clinica Chimica Acta, 505: 172-175. https://doi.org/10.1016/j.cca.2020.03.009
[10] Xie, X., Zhong, Z., Zhao, W., Zheng, C., Wang, F., Liu, J. (2020). Chest CT for typical 2019-nCoV pneumonia: Relationship to negative RT-PCR testing. Radiology, 296(2): 200343. https://doi.org/10.1148/radiol.2020200343
[11] Chu, D.K.W., Pan, Y., Cheng, S.M.S., Hui, K.P.Y., Krishnan, P., Liu, Y., Ng, D.Y.M., Wan, C.K.C., Yang, P., Wang, Q., Peiris, M., Poon, L.L.M. (2020). Molecular diagnosis of a novel coronavirus (2019-nCoV) causing an outbreak of pneumonia. Clinical Chemistry, 66(4): 549-555. https://doi.org/10.1093/clinchem/hvaa029
[12] Li, Y., Xia, L. (2020). Coronavirus disease 2019 (COVID-19): Role of chest CT in diagnosis and management. American Journal of Roentgenology, 214: 1280-1286. https://doi.org/10.2214/ajr.20.22954
[13] Celik, Y., Talo, M., Yildirim, O., Karabatak, M., Acharya, U.R. (2020). Automated invasive ductal carcinoma detection based using deep transfer learning with whole-slide images. Pattern Recognition Letters, 133: 232-239. https://doi.org/10.1016/j.patrec.2020.03.011
[14] Gaál, G., Maga, B., Lukács, A. (2020). Attention U-Net based adversarial architectures for chest X-ray lung segmentation. arXiv preprint arXiv:2003.10304.
[15] Rajpurkar, P., Irvin, J., Zhu, K., Yang, B., Mehta, H., Duan, T., Ding, D., Bagul, A., Langlotz, C., Shpanskaya, K., Lungren, M.P., Ng, A.Y. (2017). Chexnet: Radiologist-level pneumonia detection on chest x-rays with deep learning. arXiv preprint arXiv:1711.05225.
[16] Esteva, A., Kuprel, B., Novoa, R.A., Ko, J., Swetter, S.M., Blau, H.M., Thrun, S. (2017). Dermatologist-level classification of skin cancer with deep neural networks. Nature, 542(7639): 115-118. https://doi.org/10.1038/nature21056
[17] Hemdan, E.E.D., Shouman, M.A., Karar, M.E. (2020). COVIDX-Net: A framework of deep learning classifiers to diagnose COVID-19 in x-ray images. arXiv preprint arXiv:2003.11055.
[18] Narin, A., Kaya, C., Pamuk, Z. (2020). Automatic detection of coronavirus disease (COVID-19) using X-ray images and deep convolutional neural networks. arXiv preprint arXiv:2003.10849.
[19] Wang, L., Wong, A. (2020). COVID-Net: A tailored deep convolutional neural network design for detection of COVID-19 cases from chest radiography images. arXiv preprint arXiv:2003.09871.
[20] Rajpurkar, P., Irvin, J., Zhu, K., Yang, B., Mehta, H., Duan, T., Ding, D., Bagul, A., Langlotz, C., Shpanskaya, K., Lungren, M.P. (2017). Chexnet: Radiologist-level pneumonia detection on chest x-rays with deep learning. arXiv preprint arXiv:1711.05225.
[21] Antin, B., Kravitz, J., Martayan, E. (2017). Detecting pneumonia in chest X-Rays with supervised learning. Semanticscholar. org.
[22] Lan, L., Xu, D., Ye, G., Xia, C., Wang, S., Li, Y., Xu, H. (2020). Positive RT-PCR test results in patients recovered from COVID-19. JAMA, 323(15): 1502-1503. https://doi.org/10.1001/jama.2020.2783
[23] Ramaiah, A., Arumugaswami, V. (2020). Insights into cross-species evolution of novel human coronavirus 2019-nCoV and defining immune determinants for vaccine development. bioRxiv.
[24] Wu, A., Peng, Y., Huang, B., Ding, X., Wang, X., Niu, P., Meng, J., Zhu, Z., Zhang, Z., Wang, J., Sheng, J. (2020). Genome composition and divergence of the novel coronavirus (2019-nCoV) originating in China. Cell host & Microbe.
[25] Bárcena, M., Oostergetel, G.T., Bartelink, W., Faas, F.G.A., Verkleij, A., Rottier, P.J.M., Koster, A.J., Bosch, B.J. (2009). Cryo-electron tomography of mouse hepatitis virus: Insights into the structure of the coronavirion. PNAS Journal, 106(2): 582-587. https://doi.org/10.1073/pnas.0805270106
[26] Neuman, B.W., Adair, B.D., Yoshioka, C., Quispe, J.D., Orca, G., Kuhn, P., Milligan, R.A., Yeager, M., Buchmeier, M.J. (2006) Supramolecular architecture of severe acute respiratory syndrome coronavirus revealed by electron cryomicroscopy. Journal of Virology, 80(16): 7918-7928. https://doi.org/10.1128/JVI.00645-06
[27] Yamashita, R., Nishio, M., Do, R.K.G., Togashi, K. (2018). Convolutional neural networks: An overview and application in radiology. Insights Imaging, 9(4): 611-629. https://doi.org/10.1007/s13244-018-0639-9
[28] Kim, Y. (2014). Convolutional neural networks for sentence classification. arXiv preprint arXiv:1408.5882.
[29] Dataset_1:xray_dataset_covid19_1: https://drive.google.com/file/d/1AfC8emc3mGCfIYo1jK-R6suK7a2Kv2m2/view, accessed on 20 July 2020.
[30] Dataset_2:xray_dataset_covid19_2:Kaggle: https://www.kaggle.com/paultimothymooney/chest-xray-pneumonia, accessed on 20 July 2020.
[31] Dataset_3:xray_dataset_covid19_3: https://github.com/mlmed/torchxrayvision/tree/master/torchxrayvision, accessed on 20 July 2020.
[32] Dataset_4:xray_dataset_covid19_4: https://github.com/ieee8023/covid-chestxray-dataset, accessed on 20 July 2020.
[33] Dataset_5:xray_dataset_covid19_5: https://www.kaggle.com/gbellport/pneumonia-detection-96-recall-91-accuracy/output, accessed on 20 July 2020.
[34] Dataset_6:xray_dataset_covid19_6: https://www.kaggle.com/yoshifumimiya/covid-19-chest-xray-classification-by-beginner/input, accessed on 20 July 2020.
[35] Dataset_7:xray_dataset_covid19_7:Kaggle: https://www.kaggle.com/bachrr/covid-chest-xray, accessed on 20 July 2020.
[36] Ozturk, T., Talo, M., Yildirim, E.A., Baloglu, U.B., Yildirim, O., Acharya, U.R. (2020). Automated detection of COVID-19 cases using deep neural networks with X-ray images. Computers in Biology and Medicine, 1212: 103792. https://doi.org/10.1016/j.compbiomed.2020.103792
[37] Abbas, A., Abdelsamea, M.M. AND Gaber, M.M., (2020). Classification of COVID-19 in chest X-ray images using DeTraC deep convolutional neural network. arXiv preprint arXiv:2003, 13815.
[38] Afshar, P., Heidarian, S., Naderkhani, F., Oikonomou, A., Plataniotis, K.N., Mohammadi, A. (2020). COVID-caps: A capsule network-based framework for identification of covid-19 cases from x-ray images. arXiv preprint arXiv:2004.02696.
[39] Daksh Trehan. Detecting COVID-19 using Deep Learning. https://towardsdatascience.com/detecting-covid-19-using-deep-learning-262956b6f981, accessed on 20 July 2020.