Jianfeng Cheng
© 2020 IIETA. This article is published by IIETA and is licensed under the CC BY 4.0 license (http://creativecommons.org/licenses/by/4.0/).
OPEN ACCESS
With the proliferation of the Internet and smart mobile terminals, great progress has been made in the precision placement and benefit-sharing mechanism of commercial advertisements. Meanwhile, media marketing has become increasingly in-depth and precise. So far, mature theories have been proposed on consumer value and precision marketing. But further research is needed to mine the value from the big data on commercial precision marketing. To improve the accuracy of commercial precision marketing, this paper presents an evaluation index system (EIS) for commercial precision marketing based on improved attention-interest-desire-memory-action (ADIMA) model, and determines the principal evaluation indices through principal component analysis (PCA). Next, an artificial neural network (ANN) was established to evaluate commercial precision marketing, and optimized through k-means clustering (KMC). Finally, the optimized model was realized on MATLAB. The proposed EIS and ANN were proved scientific and effectiveness through simulations. The research results provide a reference for the application of the ANN in other fields of marketing.
artificial neural network (ANN), k-means clustering (KMC), precision marketing, attention-interest-desire-memory-action (ADIMA) model
With the dawn of the Internet era, there is an explosive growth in smart mobile terminals. The China Statistical Report on Internet Development points out that the number of netizens in China surpassed 730 million by the end of 2019, among which 696 million are mobile Internet users. Emerging modern media has overtaken traditional media (e.g. television and newspapers) in the absolute number of viewers and the exposure time [1, 2].
Thanks to the new communication technology of Web 2.0, consumption behaviors have generated a huge amount of data online [3, 4]. Digging deep into the big data on consumption behaviors, enterprises can reasonably predict consumption intentions, pinpoint potential consumers timely, and organize pertinent marketing activities [5-8]. To improve marketing efficiency and conversion rate, enterprises need to effectively explore the consumption demand, and build a complete hierarchical strategy for consumer management [9-12].
Precision marketing refers to the marketing targeted at consumers with strong willingness to consume. To realize precision marketing, it is necessary to create a complete consumer database, identify the enthusiastic consumers, and implement consumer-centered marketing activities [13-15]. Lin et al. [16] mentioned that, during precision marketing, enterprises could establish a precise and controllable mechanism for marketing and communication based on consumption actions and results. Kanmani and Jayapradha [17] considered precise consumer positioning the key to maintain long-term consumer relationships, suggested improving consumer loyalty and stickiness by preparing targeted personalized plans, and advised enterprises to maximize consumer value through the provision of enriched and refined services. Alkhatib and Abualigah [18] constructed consumer migration and retention models to measure consumer value by the net cash flow. After proposing a new concept called consumer lifetime value, Xiong and Gao [19] expounded the key components of consumer value, classified consumers by purchase behaviors and statistical features, and put forward targeted marketing plans.
The rapid development of computer technology has promoted the application of artificial neural network (ANN) in various industries [20, 21]. Anitha and Patil [22] combined the Logit model and neural network to classify consumers, and achieved a classification accuracy of 86.5%. To evaluate consumer credit, Monalisa et al. [23] established a backpropagation neural network (BPNN), and demonstrated the high accuracy of the network in handling massive data and predicting potential purchase intentions of consumers. Haghighatnia et al. [5] applied the optimized fuzzy neural network (FNN) to evaluate e-commerce consumers and predict their purchase intentions, and proved that the optimized FNN is a scientific and accurate network with good nonlinearity, self-learning ability, self-organization.
So far, mature theories have been proposed on consumer value and precision marketing. But further research is needed to mine the consumer demand and its value generated in commercial precision marketing. The ANN has achieved good effects in data classification and screening. However, there is little report that evaluates the effect of precision marketing based on evaluation index system (EIS). Therefore, this paper puts forward an evaluation strategy for commercial precision marketing based on the ANN.
The remainder of this paper is organized as follows: Section 2 presents an EIS for commercial precision marketing based on improved attention-interest-desire-memory-action (ADIMA) model, and determines the principal evaluation indices through principal component analysis (PCA); Section 3 establishes an ANN evaluation model for commercial precision marketing, optimizes the model through k-means clustering (KMC), and realizes the optimized model on MATLAB; Section 4 verifies the reasonability of the proposed EIS and the effectiveness of the proposed model; Section 5 puts forward the conclusions.
2.1 EIS construction
Web 2.0 offers a consumer-centered model of information dissemination. The maturation of Web 2.0 allows consumers to acquire useful information via the Internet, and share information with other consumers. The rise of Internet tools, such as Weibo, WeChat, and Taobao, has brought fundamental changes to consumer behavior pattern and media marketing model. With the growing accuracy of search websites, great progress has been made in the precision placement and benefit-sharing mechanism of commercial advertisements. Meanwhile, media marketing has become increasingly in-depth and precise.
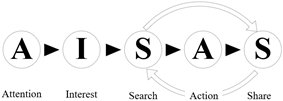
Against this background, the core functions of we media have extended from releasing personal information and sharing group information to the comparison and discussion of news and commercial advertisements. In addition, the information release has also changed from the traditional merchant-to-consumer model into the modern merchant-to-consumer plus consumer-to-consumer model. Considering the changing model of information release, the consumption process of attention-interest-desire-memory-action (AIDMA) was adjusted into attention-interest-search-action-share (AISAS). As shown in Figure 1, two Internet-based actions, namely, the search for the information on products of interest, and the post-purchase information sharing with other consumers, are the key links in the consumption process.
Figure 1. The consumption process in the improved AIDMA model
To improve the accuracy of commercial marketing strategy in the context of big data, the first step is to make scientific and reasonable evaluation of commercial precision marketing. Based on the improved AIDMA model, this paper sets up a three-layer hierarchical EIS for the effect of commercial precision marketing. Taking the different phases of the consumption process as primary indices, the established EIS is comprehensive and concise, and composed of both quantitative and qualitative indices.
Layer 1 (goal): B={effect of commercial precision marketing};
Layer 2 (primary indices): B={B1, B2, B3, B4, B5}={attention, interest, search, action, share};
Layer 3 (secondary indices):
B1={B11, B12}={online ad impression, brand recognition};
B2={B21, B22}={page view, product favorite ratio};
B3={B31, B32, B33, B34}={keyword search times, keyword search index, related word search times, related word search index};
B4={B41, B42, B43, B44, B45}={conversion rate, growth rate of online orders, growth rate of purchasers, growth rate of consumption frequency meeting merchant standard, growth rate of consumption amount};
B5={B51, B52, B53, B54}={number of topics posted, number of topic replies, number of product reviews, number of product reposts}.
In the attention phase B1, brand recognition B12 is positively correlated with the effect of commercial precision marketing. Let N be the total number of consumers, and NI be the number of consumers that effectively recognize a brand. Then, the value of B12 can be calculated by:
$B_{12}=\frac{N_{I}}{N}$ (1)
After a product catches the attention in B1, its favorite ratio (the ratio of those adding the product to the favorite list to those attracted by the product) in interest phase B2 is positively correlated with the effect of commercial precision marketing. Let NA be the number of consumers interested in the product, and NF be the number of consumers adding the product to the favorite list. Then, the value of B22 can be calculated by:
$B_{22}=\frac{N_{F}}{N_{A}}$ (2)
Every potential consumer will search for more information about the product of interest online. In the search phase B3, the keyword search times and related word search times can be denoted as NSK and NSR, respectively. Then, B32 and B34 can be respectively calculated by:
$B_{32}=\frac{B_{31}}{N_{S K}}$ (3)
$B_{34}=\frac{B_{33}}{N_{S R}}$ (4)
In phase B3, the consumers gain more understanding about the product, and receive advertisements released by the merchant. In the following action phase B4, the consumers are very likely to directly purchase the product by clicking the link or place an order for the product. Let NB be the number of consumers that purchase or order the product, and NVT be the page view of the product. Then, the value of B41 can be calculated by:
$B_{41}=\frac{N_{B}}{N_{V T}}$ (5)
Let Oi, Pi, Fi, and Ci be the growth rates of online orders, purchasers, consumption frequency meeting merchant standard, and consumption amount of the i-th month after the commercial precision marketing, respectively. Then, the values of B42-45 in that month can be respectively calculated by:
$B_{42}=\frac{O_{i-1}}{O_{i}}$ (6)
$B_{43}=\frac{P_{i-1}}{P_{i}}$ (7)
$B_{44}=\frac{F_{i-1}}{F_{i}}$ (8)
$B_{45}=\frac{C_{i-1}}{C_{i}}$ (9)
2.2 PCA-based index screening
The PCA can reduce the dimensionality of multidimensional indices into a few comprehensive principal indices. Each principal index can reflect the actual information of the object, and reduce the overlap with the information reflected by other indices. Therefore, the PCA can simplify the evaluation of commercial precision marketing. In this paper, the PCA is introduced to screen the evaluation indices for the effect of commercial precision marketing in the following steps:
Step 1. Collect sample data and initialize the set B of evaluation indices, which differ in dimensionality and value range. To minimize the impact of the difference on evaluation result, normalize the positive indies by:
$B_{i j}^{\prime}=\frac{B_{i j}-B_{i j-\min }}{B_{i j-\max }-B_{i j-\min }}$ (10)
Normalize the negative indices by:
$B_{i j}^{\prime \prime}=\frac{B_{i j-\max }-B_{i j}}{B_{i j-\max }-B_{i j-\min }}$ (11)
Complete the translation by:
$B_{i j}^{\prime \prime}=B_{i j}^{\prime}+10^{-3}$ (12)
Step 2. Compute the correlation coefficient rjk between two indices Bij and Bik on the same layer by
$r_{j k}=\frac{\sum_{j=1}^{n} \sum_{k=1}^{n}\left(B_{i j}-\hat{B}_{i j}\right)\left(B_{i k}-\hat{B}_{i j}\right)}{\sqrt{\sum_{j=1}^{n}\left(B_{i j}-\hat{B}_{i j}\right)^{2} \sum_{k=1}^{n}\left(B_{i k}-\hat{B}_{i j}\right)^{2}}}, j \neq k$ (13)
On this basis, formulate a correlation coefficient matrix for the indies on the same layer.
Step 3. Solve the covariance matrix BBT/n of B, and obtain m eigenvalues λr and corresponding eigenvectors br of the matrix.
Step 4. Determine the principal components l corresponding to the eigenvalues, whose cumulative contribution rate is greater than 85%:
$\frac{\sum_{r=1}^{l} \lambda_{r}}{\sum_{r=1}^{m} \lambda_{r}} \geq 85 \%$ (14)
The l principal indices explain most information of all indices. Then, compute the contribution rate of each principal index by:
$\omega_{r}=\frac{\lambda_{r}}{\sum_{r=1}^{m} \lambda_{r}}$ (15)
Step 5. Let N be the index samples. Determine the entropy of each index by:
$e_{r}=-\frac{1}{\ln N} \sum_{r=1}^{m} \omega_{r} \ln \omega_{r}$ (16)
Step 6. Compute the coefficient of variation of each index:
$c_{r}=1-e_{r}$ (17)
Step 7. Compute the weight of each index (Table 1):
$W_{r}=\frac{c_{r}}{\sum_{r=1}^{m} c_{r}}$ (18)
Step 8. Determine the composite score of commercial precision marketing by:
$B_{i r}^{*}=\sum_{r=1}^{m} W_{r} B_{i r}^{\prime}$ (19)
Table 1. The weight of each secondary index
|
Index |
Weight |
Index |
Weight |
|
B11 |
0.0622 |
B42 |
0.1068 |
|
B12 |
0.1370 |
B43 |
0.0316 |
|
B21 |
0.0216 |
B44 |
0.0154 |
|
B22 |
0.1468 |
B45 |
0.0049 |
|
B31 |
0.0693 |
B51 |
0.0054 |
|
B32 |
0.1650 |
B52 |
0.2031 |
|
B33 |
0.0891 |
B53 |
0.6390 |
|
B34 |
0.0301 |
B54 |
0.6561 |
|
B41 |
0.1135 |
|
|
3.1 Model construction
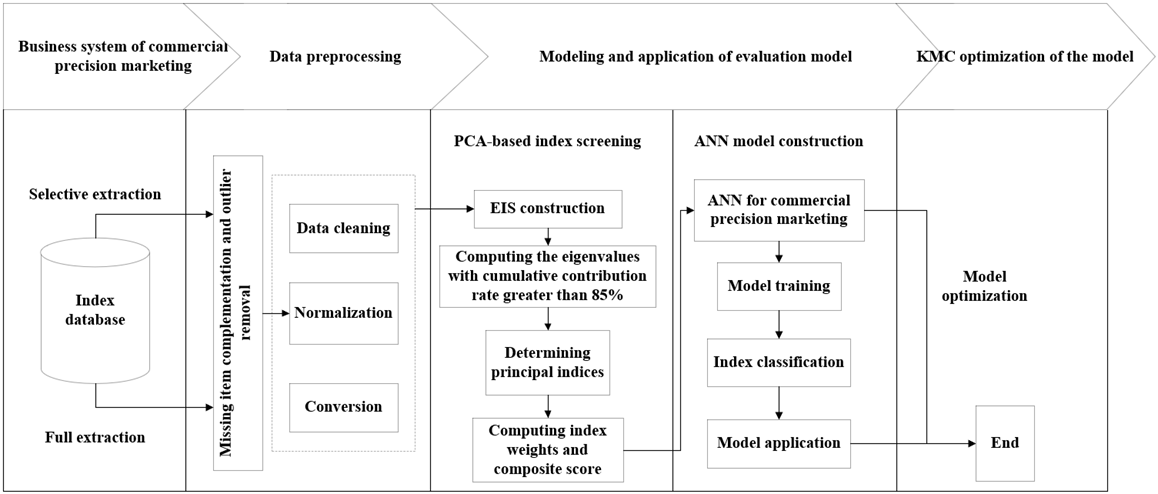
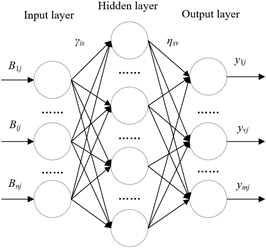
Considering their numerous attributes and correlations, the evaluation indices for commercial precision marketing cannot be directly used in cluster analysis. Otherwise, the information will overflow, and undermine the clustering effect. To solve the problem, this paper builds up an ANN evaluation model for commercial precision marketing. The ANN was adopted for the cluster analysis of the principal indices identified in PCA, providing a reference for decision-makers on commercial marketing and consumer relationship management. Figure 2 explains the workflow of model construction and application. The structure of the model is illustrated in Figure 3. It can be seen that the model is a BPNN, consisting of an input layer, a hidden layer, and an output layer.
Figure 2. The construction and application of the ANN model
Figure 3. The structure of the ANN model
The composite score of commercial precision marketing was imported to the ANN. Let j be the serial number of index sample, Bij be the input matrix on the input layer, and γis be the connection weight between the i-th input layer node and the s-th hidden layer node. Then, the activation function of the hidden layer can be expressed as:
$h_{s j}=\frac{1}{1+\left[\left(\sum_{i=1}^{m} \gamma_{i s} B_{i j}\right)^{-1}-1\right]^{2}}$ (20)
where, hsj is the input matrix of the hidden layer; ηsv is the connection weight between the s-th hidden layer node and the v-th output layer node; yvj is the output of the v-th output layer node:
$y_{v j}=\frac{1}{1+\left[\left(\sum_{s=1}^{P} \eta_{s v} h_{s j}\right)^{-1}-1\right]^{2}}$ (21)
3.2 Model optimization
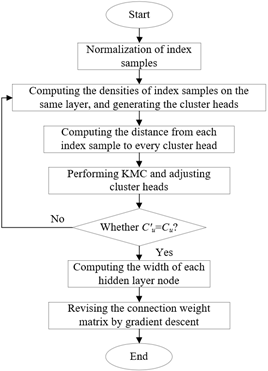
In this sub-section, the BPNN is optimized through KMC. In addition, the number and width of hidden layer nodes was determined, as well as the position of cluster heads. Furthermore, the output weights of the BPNN were adjusted by gradient descent. The entire optimization process is shown in Figure 4.
Figure 4. The workflow of KMC optimization of BPNN
Step 1. Normalize the sample data by formulas (10)-(12). Then, compute the densities of N data samples on the same layer by:
$C_{1}=\sum_{i=1}^{n} \exp \left[-\frac{\left\|B_{i j}-B_{i k}\right\|^{2}}{r^{2}}\right]$ (22)
where, r is a constant about the radius of the neighborhood of index Bij. Then, choose the sample with the highest density as the first cluster head C1.
Further solve and revise the densities of the remaining N-1 samples by:
$C_{u}=C_{u}-C_{u-1} \exp \left[-\frac{\left\|B_{i j}-B_{u-1}\right\|^{2}}{r^{2}}\right]$ (23)
where, Ḃu-1 is the sample data corresponding to the u-1-th cluster head. Then, choose the sample with the highest density as the u-th cluster head Cu.
Step 2. Keep repeating Step 1 until finding K cluster heads C1, C2, …, CK. Compute the distance from each index sample to each cluster head by:
$d_{u}=\left\|B_{i j}-C_{u}\right\|$ (24)
Step 3. Classify the index samples by:
$\Gamma\left(B_{i j}\right)=\min d_{u}=\min \left\|B_{i j}-C_{u}\right\|$ (25)
Optimize and finetune the cluster head of each class by:
$C_{u}^{\prime}=\frac{1}{N} \sum_{j=1}^{N_{t}} B_{i j}$ (26)
where, Ni is the number of index samples of class t. If the finetuned cluster heads are not consistent with the original ones, re-calculate the distance from each index sample to each cluster head; otherwise, go to Step 4.
Step 4. Compute the width of each hidden layer node by:
$\varphi_{u}=\varepsilon \min d_{u}$ (27)
where, ε=1 is the overlap coefficient. The width of a hidden layer node is the shortest distance between the u-th cluster head and other cluster heads.
Step 5. Calculate the deviation of expected output from the actual output:
error $=\sum_{i=1}^{N}$ error $_{i}=\frac{1}{2} \sum_{i=1}^{N}\left[y^{*}\left(B_{i j}\right)-y\left(B_{i j}\right)\right]^{2}$ (28)
where, y*(Bij) and y(Bij) are the expected output and actual output of the BPNN based on the input of Bij.
To minimize the deviation, revise the connection weight matrix between hidden layer and output layer by gradient descent:
$\eta_{s v}^{\prime}=\eta_{s v}-\delta\left(\frac{1}{2} \sum_{s=1}^{P} \frac{\partial E}{\partial \eta_{s v}}\right)$ (29)
where, δ=0.001 is the learning rate.
3.3 Model implementation
The BPNN evaluation model for commercial precision marketing mainly involves three parts: index samples, data normalization algorithm, and online model. Specifically, the index database for commercial precision marketing was connected with the database in MATLAB, so that the data can be directly read. The connection command can be expressed as:
Conn=database('','root','','com.mysql.jdbc.Driver','jdbc:mysql://localhost/db_name?characterEncoding=Data In-10')
The statement of the samples of each index can be read by:
t=exec(conn,’select*from data’);
The data normalization algorithm was realized by calling the premnmx function of MATLAB:
$\left[B_{i j}^{\prime}, B_{i j-\min }^{\prime}, B_{j-\max }^{\prime}, B_{i j}^{\prime \prime}, B_{i j-\min }^{\prime \prime}, B_{j-\max }^{\prime \prime}\right]$$=\operatorname{premnmx}\left(B_{i j}^{\prime}, B_{i j}^{\prime \prime}\right)$ (30)
The ANN algorithm was realized by calling the nwerb function of MATLAB:
$[\mathrm{Net}, \mathrm{Tr}]=\operatorname{newr} b\left(B_{i j}, y^{*}\left(B_{i j}\right), M S E, E S, P_{\max }\right)$ (31)
where, MSE is the preset mean squared error of training; ES is the expansion speed of the ANN; Pmax is the maximum number of input layer nodes; Net is the established BPNN; Tr is the training record of the BPNN.
The KMC algorithm was realized by calling the kmeans function in MATLAB:
$\left[I d x, N_{t}, C\right]=k \operatorname{means}\left(B_{i j}, K, I C\right)$ (32)
where, IC is the initial cluster head; Idx is the class of an index sample; Nt is the number of index samples in each class.
The simulations were conducted on a computer operating on Windows 10, with a 3.8GHz central processing unit (CPU), 8G memory, and 256GB hard disk. Oracle Database and MATLAB were both adopted for the simulations.
For simplicity, the 17 indices in the EIS were subject to PCA and composite score calculation based on RStudio. Table 2 presents the contribution rate of each index to the variance of principal components. It can be seen that the cumulative contribution rates of B12, B21, B31, B32, B33, B34, B42, B44, B52, and B54 were above 85%. The ten indices can represent most of the information of the 17 original indices. The composite scores of five of the principal indices are listed in Table 3.
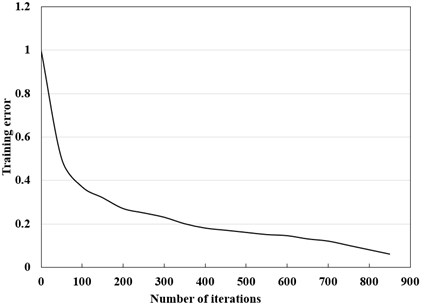
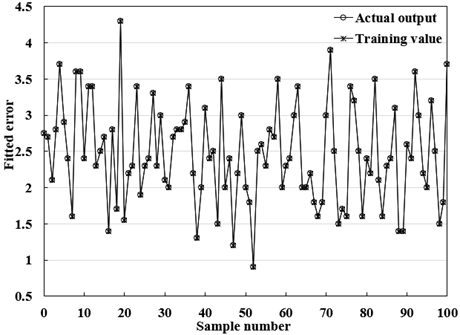
The BPNN model was trained by 800 sets of index samples in Oracle Database, which are about commercial precision marketing in 2017-2019. Figure 5 displays the training error curve of the BPNN, and Figure 6 gives the fitted curve of BPNN error. It can be seen that the BPNN training terminated after 850 iterations, and the expected error tended to be stable; the BPNN fitted the error of each index accurately, and controlled the deviation of expected output from the actual output within an ideal range.
Table 2. The contribution rates of evaluation indices
|
Index |
Standard deviation |
Contribution rate |
Cumulative contribution rate |
Index |
Standard deviation |
Contribution rate |
Cumulative contribution rate |
|
B11 |
2.362 |
0.367 |
0.522 |
B43 |
2.362 |
0.367 |
0.522 |
|
B12 |
1.533 |
0.325 |
0.853 |
B44 |
1.533 |
0.325 |
0.923 |
|
B21 |
1.742 |
0.068 |
0.936 |
B45 |
1.742 |
0.068 |
0.636 |
|
B22 |
0.943 |
0.167 |
0.738 |
B51 |
0.943 |
0.167 |
0.738 |
|
B31 |
0.843 |
0.135 |
0.917 |
B52 |
0.843 |
0.135 |
0.917 |
|
B32 |
0.727 |
0.096 |
1.000 |
B53 |
0.727 |
0.096 |
1.000 |
|
B33 |
0.524 |
0.035 |
0.974 |
B54 |
0.524 |
0.035 |
0.974 |
|
B34 |
0.275 |
0.076 |
0.924 |
|
|
|
|
|
B41 |
0.735 |
0.024 |
0.838 |
|
|
|
|
|
B42 |
0.367 |
0.063 |
1.000 |
|
|
|
|
Table 3. The composite scores of five principal indices
|
Serial number of secondary indices |
B1 |
B2 |
B3 |
B4 |
B5 |
|
1 |
89.7 |
0.674 |
18756 |
0.046 |
2109 |
|
2 |
0.752 |
0.245 |
0.159 |
0.214 |
1783 |
|
3 |
0 |
0 |
36895 |
0.236 |
769 |
|
4 |
0 |
0 |
0.266 |
0.197 |
4973 |
|
5 |
0 |
0 |
0 |
0.279 |
0 |
Figure 5. The training error curve
Figure 6. The fitted curve of BPNN error
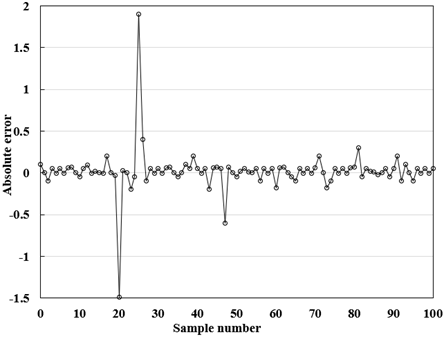
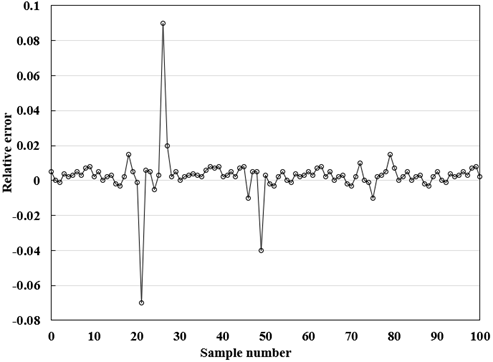
Figures 7 and 8 present the absolute error curve and relative error curve of the BPNN. The results show that our BPNN achieved good simulation performance in expected output and evaluation indices, and displayed good fitting ability.
Figure 7. The absolute error curve
Figure 8. The relative error curve
Table 4. The SSEs and MSEs through model application
|
Type |
SSE |
MSE |
|
Model training |
0.0235 |
2.235e-005 |
|
Model testing |
0.0177 |
6.246e-004 |
|
KMC |
0.0835 |
4.733e-004 |
Another set of 800 index samples for commercial precision marketing were taken to verify the effectiveness of the proposed BPNN. Table 4 compares the model training, model testing, and KMC in the sum of squared errors (SSE) and mean squared error (MSE). It can be seen that the MSEs in model application had a small gap, suggesting that our BPNN is effective in evaluating the effect of commercial precision marketing. Due to the sheer number of index samples, the SSE of KMC algorithm was relatively large. But the SSE < 0.1 is still controllable.
This paper mainly proposes an ANN-based evaluation strategy for commercial precision marketing. Firstly, an EIS for commercial precision marketing was established based on improved AIDMA model, and the principal indices were determined by PCA. Specifically, the contribution rates of all indices were computed through experiments, and 10 principal indices were selected to represent most of the information of the original 17 indices. The composite score of each principal component was calculated in turn. On this basis, a BPNN model was constructed to evaluate the effect of commercial precision marketing. The BPNN model was optimized through KMC, and realized on MATLAB. Simulation results show that our BPNN model fitted the predicted error of each index well, and controlled the deviation of desired output in training result from the actual result within the ideal range.
[1] Miklosik, A., Kuchta, M., Evans, N., Zak, S. (2019). Towards the adoption of machine learning-based analytical tools in digital marketing. IEEE Access, 7: 85705-85718. https://doi.org/10.1109/ACCESS.2019.2924425
[2] Kim, J., Kang, S., Lee, K.H. (2019). Evolution of digital marketing communication: Bibliometric analysis and network visualization from key articles. Journal of Business Research. https://doi.org/10.1016/j.jbusres.2019.09.043
[3] Mackey, T., Kalyanam, J., Klugman, J., Kuzmenko, E., Gupta, R. (2018). Solution to detect, classify, and report illicit online marketing and sales of controlled substances via Twitter: using machine learning and web forensics to combat digital opioid access. Journal of Medical Internet Research, 20(4): e10029. https://doi.org/10.2196/10029
[4] Vieira, V.A., de Almeida, M.I.S., Agnihotri, R., Arunachalam, S. (2019). In pursuit of an effective B2B digital marketing strategy in an emerging market. Journal of the Academy of Marketing Science, 47(6): 1085-1108. https://doi.org/10.1007/s11747-019-00687-1
[5] Haghighatnia, S., Abdolvand, N., Rajaee Harandi, S. (2018). Evaluating discounts as a dimension of customer behavior analysis. Journal of Marketing Communications, 24(4): 321-336. https://doi.org/10.1080/13527266.2017.1410210
[6] Müller, J.M., Pommeranz, B., Weisser, J., Voigt, K.I. (2018). Digital, social media, and mobile marketing in industrial buying: Still in need of customer segmentation? Empirical evidence from Poland and Germany. Industrial Marketing Management, 73: 70-83. https://doi.org/10.1016/j.indmarman.2018.01.033
[7] Nishi, R., Takaguchi, T., Oka, K., Maehara, T., Toyoda, M., Kawarabayashi, K.I., Masuda, N. (2016). Reply trees in twitter: data analysis and branching process models. Social Network Analysis and Mining, 6(1): 26. https://doi.org/10.1007/s13278-016-0334-0
[8] Toh, Z., Su, J. (2016). Nlangp at semeval-2016 task 5: Improving aspect based sentiment analysis using neural network features. Proceedings of the 10th International Workshop on Semantic Evaluation (SemEval-2016), California, pp. 282-288. https://doi.org/10.18653/v1/S16-1045
[9] Khalil, T., El-Beltagy, S.R. (2016). Niletmrg at semeval-2016 task 5: Deep convolutional neural networks for aspect category and sentiment extraction. Proceedings of the 10th International Workshop on Semantic Evaluation (SEMEVAL-2016), California, pp. 271-276. https://doi.org/10.18653/v1/S16-1043
[10] Andrychowicz, M., Denil, M., Gomez, S., Hoffman, M. W., Pfau, D., Schaul, T., Shillingford, B., de Freitas, N. (2016). Learning to learn by gradient descent by gradient descent. NIPS'16: Proceedings of the 30th International Conference on Neural Information Processing Systems, NY, US, pp. 3988-3996.
[11] Hou, R., Wu, J., Du, H.S. (2017). Customer social network affects marketing strategy: A simulation analysis based on competitive diffusion model. Physica A: Statistical Mechanics and its Applications, 469: 644-653. https://doi.org/10.1016/j.physa.2016.11.110
[12] Ducange, P., Pecori, R., Mezzina, P. (2018). A glimpse on big data analytics in the framework of marketing strategies. Soft Computing, 22(1): 325-342. https://doi.org/10.1007/s00500-017-2536-4
[13] Liang, C.C., Nguyen, N. L. (2018). Marketing strategy of internet-banking service based on perceptions of service quality in Vietnam. Electronic Commerce Research, 18(3): 629-646. https://doi.org/10.1007/s10660-017-9261-z
[14] Yang, Z., Yang, D., Dyer, C., He, X., Smola, A., Hovy, E. (2016). Hierarchical attention networks for document classification. Proceedings of the 2016 conference of the North American chapter of the Association for Computational Linguistics: Human Language Technologies, pp. 1480-1489. https://doi.org/10.18653/v1/N16-1174
[15] Kaneko, Y., Miyazaki, S., Yada, K. (2017). The influence of customer movement between sales areas on sales amount: A dynamic Bayesian model of the in-store customer movement and sales relationship. Procedia Computer Science, 112: 1845-1854. https://doi.org/10.1016/j.procs.2017.08.225
[16] Lin, T., Guo, T., Aberer, K. (2017). Hybrid neural networks for learning the trend in time series. Proceedings of the Twenty-Sixth International Joint Conference on Artificial Intelligence, Melbourne, Australia, pp. 2273-2279. https://doi.org/10.24963/ijcai.2017/316
[17] Kanmani, W.S., Jayapradha, B. (2017). Prediction of default customer in banking sector using artificial neural network. International Journal on Recent and Innovation Trends in Computing and Communication, 5(7): 293-296.
[18] Alkhatib, K., Abualigah, S. (2020). Predictive model for cutting customers migration from banks: Based on machine learning classification algorithms. 2020 11th International Conference on Information and Communication Systems (ICICS), Irbid, Jordan, pp. 303-307. https://doi.org/10.1109/ICICS49469.2020.239544
[19] Xiong, L., Gao, B. (2017). Research on customer segmentation based on RFM multi-level customer value model. Business Era, 5: 55-57.
[20] Motlagh, O., Berry, A., O'Neil, L. (2019). Clustering of residential electricity customers using load time series. Applied Energy, 237: 11-24. https://doi.org/10.1016/j.apenergy.2018.12.063
[21] Urkup, C., Bozkaya, B., Salman, F.S. (2018). Customer mobility signatures and financial indicators as predictors in product recommendation. PloS One, 13(7): e0201197. https://doi.org/10.1371/journal.pone.0201197
[22] Anitha, P., Patil, M.M. (2019). RFM model for customer purchase behavior using K-Means algorithm. Journal of King Saud University-Computer and Information Sciences. https://doi.org/10.1016/j.jksuci.2019.12.011
[23] Monalisa, S., Nadya, P., Novita, R. (2019). Analysis for customer lifetime value categorization with RFM model. Procedia Computer Science, 161: 834-840. https://doi.org/10.1016/j.procs.2019.11.190