Sama Ranjeeth | Thamarai Pugazhendhi Latchoumi*
© 2020 IIETA. This article is published by IIETA and is licensed under the CC BY 4.0 license (http://creativecommons.org/licenses/by/4.0/).
OPEN ACCESS
The capability of predicting malnutrition kids is highly beneficial to take remedial actions on kids who are under 5 year’s age. In this article, Kid’s malnutrition predictive model is created and tested with our own collected dataset. We find the issues of kids malnutrition by the use of Machine Learning (ML) models. From ML-models, a multi-layer perceptron is used to classify the data neatly. Optimizing technique stochastic gradient descent (SGD) and Multilayer Perceptron (MLP) classifier methods are integrated to classify the data more effectively. To select the best features, from the feature selection (FS) technique filter-based method used. After selecting the best features, selected features are pass to the classifier model then the model will classify the data. Results with the MLP-SGD classifier were good than the other classifiers but after feature selection, the performance of the model was increased more. It will help in improving the analysis of malnutrition kid’s data. The sample data are collected from parents who are having kids less than five years of age at Repalle town, Andhra Pradesh, India.
malnutrition, predictive model, classifier, stochastic gradient descent, feature selection, normalization
Nowadays, most of the kids under the age of five in rural areas are mainly suffering from malnutrition and it was a significant general medical issue in India [1]. In addition to that, the lack of healthy sustenance issue in India is highly concentrated on a generally modest number of states, local, and towns that represents an enormous portion of the unhealthiness trouble. In 2016, it was estimated that about 155 million children who are under the age of 5 were suffering from stunting and over 41 million children were recorded to be overweight or obese. Malnutrition in all its forms includes under-nutrition (wasting, stunting, and underweight), inadequate vitamins or minerals, overweight, obesity, and resulting diet-related no communicable diseases [2].
The malnutrition deficiency among the children who reside in the slum areas of Mumbai by using Logistic Regression (LR) and reported that lack of financial crisis in the family leads to having under nutrition to those children [3-5]. Earlier studies are performed by the American Alliance for Health, Physical Education, and Recreation & Dance (AAHPERD) test through the Descriptive-correlation method to analyze the correlation between the heights and weights among 9-18 years children's in Iran concerning malnutrition [6]. The proposed Boosting Additive Quantile Regression (BAQR) method was used to determine the risk factor of severe childhood malnutrition of children in India based on demographic and health surveys for the year 2005-2006. A recent article [7] analyzed that disease burden attributable to maternal and child malnutrition, this literature took the data from 1990 to 2017 in every state of India utilizing total availability data from more than one source. Mohammad Mohseni [8, 9] and the team analyzed present policies of malnutrition prevention in kids less than framework policy study was conducted to analyze the policies of malnutrition. One of the recent articles [10] shown the impact of COVID-19 on kids' malnutrition and mortality nutrition-related. In Saharan Africa and South Asia before the COVID-19 pandemic, an estimated 47 million children less than 5 years were normally or severely diseased.
From the whole literature study, we can understand that only analysis and some correlations are found but this article created a malnutrition predictive model. The capability to predict the kid's malnutrition is highly beneficial to take remedial actions in the present context of kids' malnutrition in the form of recommending healthy food to children and their parents physically [11, 12].
The upcoming portions are arranged as follows section 2 contains Data and its visualization, section 3 is about our proposed model, section 4 describes the result analysis of the proposed model, and finally, section 5 contains the conclusion.
For the year 2019, to measure the malnutrition ratio among the children's health conditions from Repalle town, Andhra Pradesh, India s conducted based on some set of queries posted to the parents who have kids less than five years of age [13]. This study design out one-year data of Malnutrition children among the age group of (0-5) years. The total data set size is 2956 records with 12 parameters and 3 class labels named as Low/Normal/High as shown in Table 1.
In this article from the dataset, parameter values consideration as follows, children age considered as years with months, children's gender values are considered as 0 (male), and 1 (female). Children and children's’ parents’ height, weight, are considered as Low (0) / Normal (1) / High (2), children's’ parents’ overall health status is considered as good (1) or bad (0), and children parents marriage relation consanguineous is considered as yes (1) / no (0) finally children's’ overall health status values (Low/Normal/High) are considered as class labels [14, 15].
Table 1. Parameters and its values
|
Parameters and its values represented in the data set |
|
Children Age (Years with months) |
|
Children Gender (male/Female) |
|
Children Height (Low/Normal/High) |
|
Children Weight (Low/Normal/High) |
|
Children Mother Height (Low/Normal/High) |
|
Children Mother Weight (Low/Normal/High) |
|
Children Mother Overall Health Status (good or bad) |
|
Children Father Height (Low/Normal/High) |
|
Children Father Weight (Low/Normal/High) |
|
Children Father Overall Health Status (good or bad) |
|
Marriage relation Consanguineous (yes or no) |
|
Children Overall Health status (Low/Normal/High) |
2.1 Data visualization
The graphical representation of data format leads to understanding the complex data in a simple way. Kid’s data were collected from Repalle town is categorized into three categories.
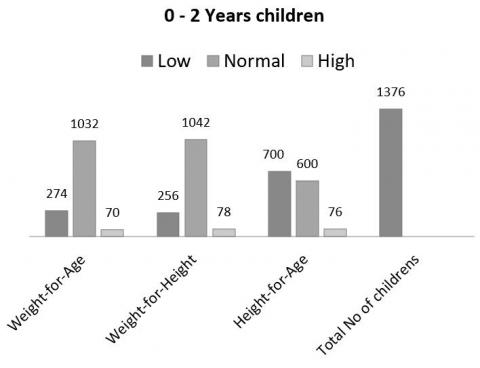
Figure 1. 0 to 2 years age of children malnutrition analysis according to weight, height, age
Figure 2. 2.1 to 4 years age of children malnutrition analysis according to weight, height, age
Figure 3. 4.1 to 5 years age of children malnutrition analysis according to weight, height, age
Data visualization mainly focused on the analysis of malnutrition in 3 parameters such as weight with age, weight with height, and age with height. From the considered parameters, it is easy to monitor whether the kids had reached the actual height according to their age and their weight in the respective categories. The analysis of children's malnutrition based on 3 parameters: weight with age, weight with height, and height with age. The number of children belongs to each category such as 0 to 2 years, 2.1 to 4 years, and 4.1 to 5 years are shown in Figures 1-3 respectively. These parameters are measured with low (underweight), normal (correct weight), and high (more weight).
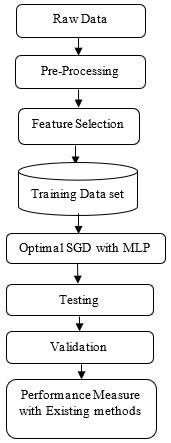
The overall process involved in the proposed model is shown in Figure 4. It operates at various stages namely; raw data, pre-processing, and normalization that used to reduce the attribute values to a small range [0.0 to 1.0], FS is used for selecting the best features with higher ranks using filter-based methods. MLP with SGD classifier techniques is used for removing the misclassified instances after pre-processing and normalizing the data. Once the classification process is done, a set of experiments will be carried out to measure the results of the developed model. Accuracy made by the proposed model is higher than the existing traditional classifiers namely; Naïve Bayes (NB), Support Vector Machine (SVM), and Decision Tree (DT).
3.1 Pre-processing
Before applying the algorithms of ML on the data set, the pre-processing of data is required [9]. It contains the cleaning of data, best feature selection, the transformation of data [10].
3.2 Feature selection
In the pre-processing section, selecting the features is the primary task. An information gain selection algorithm is applied to evaluate the feature rank filter method. Every feature will get rank according to features influence on the classification of data during the selection of best features are shown in Figure 5. the reason for choosing filter-based methods compared to other methods in feature selection is, selection of feature in filter-based method technique based on scores in various statistical tests for their correlation with the outcome variable and it is computationally very simple and flexible but other methods are computationally very expansive. Here top 8 rank features are selected as the best features such as children's age, weight, height, children's parents (mother and father) weight and height, the overall health of children mother these features are playing a key role in building an effective prediction model for kids malnutrition. Marriage Consanguineous, the overall health of father and kids gender position to the last 3 ranks.
Figure 4. Proposed model for predicting the malnutrition kids
Figure 5. Evaluation of feature selection using filter-based
3.3 Multi-layer perceptron with stochastic gradient descent
MLP with one hidden layer called a discriminant nonlinear function shown in Eq. (1).
$y=f_{\theta}(x)=\sigma(b+B . \sigma(A+A . x))$ (1)
where, A, B are two matrices, θ denote two vectors a, b, and vector element-wise sigmoid function is σ (...).
Reducing the few main functions including y, these attributes are optimized always through SGD and real classification data. C(θ) is the objective function. There is more effort to effectively carry out SGD optimization. Commonly, function $f_{\theta}$ comprises numerous local minima. By training the small Neural Network (NN), local minima are observed frequently over issues such as parity, spiral, and XOR. More effort is exhausted during training irrespective of such local minima. Due to the $f_{\theta}$ symmetry additionally single local minimum offers higher local minima within the parameter vector. At various scales, C(θ) might comprise minimal hierarchy generally. During NN training, many schemes are gained through these assumptions. At smaller scales, momentum is subjected to mold out the local minima and the schedules of learning rate are probably ready at various scales as same as simulated annealing. In weighted space, the MLPs convergence observation and the various weight settings offer an equal output. Besides, it is composite to discover the MLP in high dimensional weight space. For various starting points, C(θ) is the optimization tracing. It employs a $\left\{\xi_{1}, \ldots \xi_{N}\right\}$ as sample test set collection despite θ parameters comparing and estimating the respective vector as shown in Eq. (2).
$\tau(\theta)=\left(f_{\theta}\left(\xi_{1}\right), \ldots, f_{\theta}\left(\xi_{N}\right)\right)$ (2)
It is needed for $\tau(\theta) \approx \tau\left(\theta^{\prime}\right)$ for θ and $\theta^{\prime}$ as two weight vectors. In the NN-SGD optimization method, when the standard view is correct that is below predictions might be given as true where there exist many local minima. SGD will pursue an applied learning rate till the learning rate becomes large and the search moves over an arbitrary walk around the local minimum. θ parameter space must be separated from the areas for an applied learning rate i.e. everyone belongs to basin over a local minimum respective towards the learning rate.
Defining the SGD in the proposed work is to tackle the problem of massive data classification over MLP. With examples $S=\left\{\left(x_{i}, y_{i}\right), i=1, \ldots, N\right\}$, assume the problem of binary classification, wherever d-dimensional input vector in the form of sample $x_{i} \in R^{d}$ and the label is denoted through $y_{i} \in\{+1,-1\}$. MLP classifier training is represented in Eq. (3).
$f(x)=\operatorname{sgn}\left(w^{T} x\right)$ (3)
By employing S, with every input, weights vector w is linked that is formed as in Eq. (4) optimization problem solving
$\min p_{t}(w)=\frac{\lambda}{2}\|w\|^{2}+l\left(w ;\left(x_{t}, y_{t}\right)\right)$ (4)
where, hinge loss function is denoted by $l\left(w ;\left(x_{t}, y_{t}\right)\right)=$$\max \left(0,1-y_{t} w^{T} x_{t}\right)$ and the regularization parameter is denoted through $\lambda \geq 0$ that is employed to the complexity control model. Iteratively, the SGD works. It begins with primary model weight assume $w_{1}$ and present weight $w_{t}$. Updation is done at tth round as shown in Eq. (5) and (6).
$w_{t+1}=w_{t}-\eta_{t} \nabla_{t} p_{t}\left(w_{t}\right)\left(1-\eta_{t} \lambda\right) w_{t}+\eta_{t} 1\left[y_{t}\left\langle w_{t}\right\rangle\right.$ (5)
$1\left[y_{t}\left\langle w_{t}, x_{t}\right\rangle<\emptyset\right]\left\{\begin{array}{ll}1, & \text { if } y_{t}\left\langle w_{t}, x_{t}\right\rangle \\ 0, & \text {otherwise}\end{array}\right.$ (6)
If the threshold value is less than 0.5 then it treats as 0 and if it is greater than it is 1. It will iterate the steps until the model fit to the respective data set. The indicator function denotes the value when the argument is true and over example (x, y)), the non-zero loss is gained or zero. By employing $\eta_{t}=1 /(\lambda t)$ in stepwise function and update it. The final output provides $w_{t+1}$ iteration after the predetermination of T iterations.
3.4 Validation
In this paper, 10 fold cross-validation data is used to train the classifier models. Dataset is divided into 10 subparts of similar size by using a cross-validation method, for training nine subsets data and testing one subset of data. This methodology is executed 10 times on test samples to estimate the average error rate as a final result. The validation process starts when the classification model is trained. The validation method is the last phase to develop the predictive model. Testing the performance of the predictive model on real-time data is called validation
To evaluate the proposed model for the prediction of kids’ malnutrition, the dataset is collected from a total of 2956 kid's parents. The number of instances collected is 2956, the total number of features contained in the dataset is 12, and the classes count included in the kid's malnutrition prediction is 3 such as low, normal, high. The total percentage obtained through each category is 19%, 75%, 6% through the categories respectively based on the description of the dataset is provided in Table 2.
Table 2. Data set description
|
Data Set Description |
|
|
Description |
Overall Health status of kids |
|
No of Instances |
2956 |
|
No Of Features |
12 |
|
No of Class |
3 |
|
Percentage of Low samples |
19% |
|
Percentage of Normal samples |
75% |
|
Percentage of High samples |
6% |
4.1 Measures for classifier performance evaluation
The metrics such as accuracy, precision, recall, and F-measure evaluation measures were used for evaluating the quality of classification. Measures are calculated using Figure 6, and the classification confusion matrix equations for measures as shown in Table 3.
Figure 6. Confusion matrix table
Table 3. Equations for evaluation measures
|
Precision = $\frac{T P}{T P+F P}$ |
|
Recall = $\frac{T P}{T P+F N}$ |
|
Accuracy = $\frac{T P+T N}{T P+F N+T N+F P}$ |
|
F1-Measure = $\frac{2 * \text {precision} * \text {recall}}{\text {precision}+\text {recall}}$ |
4.2 Evaluation results before and after feature selection
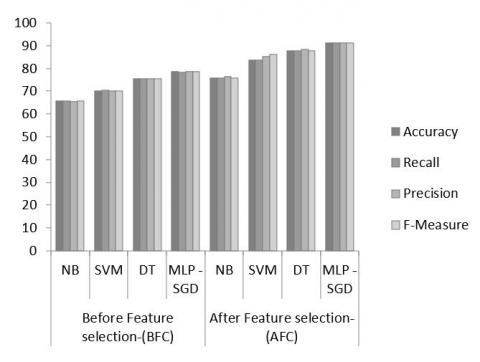
Table 4 infers that after feature selection classifiers the performance was increased by 10% more compared to before feature selection. The proposed model performance was increased 13% after applying feature selection methods, 8 features that were selected as best features from the total of 11 features as shown in Figure 5. The best features played a key role in building an effective predictive model of kids’ malnutrition, performance of model shown in Figure 8 before and after feature selection.
4.3 Proposed model evaluation results
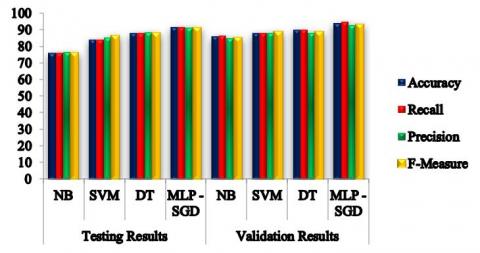
In Table 5, all classifiers have shown a good performance when compared to existing models. MLP with SGD provided good performance during testing and validation of the malnutrition data process over the three classifiers NB, SVM, and DT. Better performance is more than 85% accuracy shown by DT than the other two classifiers is achieved from 44 new kids data. Form the new data, 37 data are correctly classified and the proposed model classified significantly 41 out of 44 with an accuracy of 93.6%. The consistent of the proposed model is proved by the validation process evaluation. Figure 7 and Figure 8 is showing the results in the form of visualization for a better understanding.
Figure 7. Classifier results comparison before and after feature selection
Table 4. Classifier model results before and after feature selection
|
Evaluation Measure |
Before Feature selection-(BFC) |
After Feature selection-(AFC) |
||||||
|
Classifiers Type |
NB |
SVM |
DT |
MLP - SGD |
NB |
SVM |
DT |
MLP - SGD |
|
Accuracy |
65.8 |
70.3 |
75.5 |
78.6 |
75.8 |
83.7 |
87.8 |
91.2 |
|
Recall |
65.6 |
70.4 |
75.4 |
78.4 |
75.8 |
83.7 |
87.8 |
91.3 |
|
Precision |
65.5 |
70.3 |
75.6 |
78.5 |
76.4 |
85.2 |
88.4 |
91.1 |
|
F-Measure |
65.7 |
70.2 |
75.4 |
78.5 |
75.9 |
86.2 |
87.9 |
91.1 |
Table 5. Comparison of different classifiers testing and validation results with the proposed model in terms of evaluation measure
|
Evaluation Measure |
Testing Results |
Validation Results |
||||||
|
Classifiers Type |
NB |
SVM |
DT |
MLP -SGD |
NB |
SVM |
DT |
MLP-SGD |
|
Accuracy |
75.8 |
83.7 |
87.8 |
91.2 |
85.9 |
87.8 |
89.8 |
93.6 |
|
Recall |
75.8 |
83.7 |
87.8 |
91.3 |
86 |
87.9 |
89.8 |
94.5 |
|
Precision |
76.4 |
85.2 |
88.4 |
91.1 |
84.7 |
88 |
88 |
92.8 |
|
F-Measure |
75.9 |
86.2 |
87.9 |
91.1 |
84.8 |
88.7 |
88.7 |
92.9 |
Figure 8. Comparison of different classifiers testing and validation results with the proposed model in terms of evaluation measure
In this paper, a new ML-based classification model for assessing the kid's malnutrition is successfully developed and validated. The presented work operates at various stages namely preprocessing, normalization feature selection. MLP with SGD is used as a classifier. To evaluate the model build for the prediction of kids’ malnutrition, a dataset is collected from 2596 kid’s parents. The presented model achieves good accuracy, recall, and precision, in testing and validation results than the existing classifiers. Compare to testing, validation showed good performance with the maximum precision of 92.8, recall of 94.5, the accuracy of 93.6, F-score of 92.9 respectively. The simulation outcome exhibited that the MLP-SGD model offers better results over the other classifiers. However, the usage of feature selection using filter-based methods takes the classifier results to the next level. The present work will be useful to improve the reduction of malnutrition deficiency among kids below the age of five.
[1] Latchoumi, T.P., Ezhilarasi, T.P., Balamurugan, K. (2019). Bio-inspired weighed quantum particle swarm optimization and smooth support vector machine ensembles for identification of abnormalities in medical data. SN Applied Sciences, 1: 1-12. https://doi.org/10.1007/s42452-019-1179-8
[2] Rode, S. (2011). Economic growth and increasing trends of child malnutrition in Mumbai City. Journal of Economics and International Finance, 2(7): 713-726. https://doi.org/10.5897/JEIF11.115
[3] Fenske, N., Kneib, T., Hothorn, T. (2011). Identifying risk factors for severe childhood malnutrition by boosting additive quantile regression. Journal of the American Statistical Association, 106(494): 494-510. https://doi.org/10.1198/jasa.2011.ap09272
[4] Das, S., Rahman, R.M. (2011). Application of ordinal logistic regression analysis in determining risk factors of child malnutrition in Bangladesh. Nutrition Journal, 10(1): 1-12. https://doi.org/10.1186/1475-2891-10-124
[5] Cortez, P., Silva, A. (2008). Using data mining to predict secondary school student performance. In A. Brito, & J. Teixeira (Eds.), Proceedings of 5th Annual Future Business Technology Conference, Porto, pp. 5-12.
[6] Griffith, J. (2010). Relation of parental involvement, empowerment, and school traits to student academic performance. The Journal of Educational Research, 90(1): 33-41. https://www.jstor.org/stable/27542066
[7] Latchoumi, T.P., Parthiban, L. (2017). Abnormality detection using weighted particle swarm optimization and smooth support vector machine. Biomedical Research, 28(11): 4749-47151.
[8] Kaur, G., Chhabra, A. (2014). Improved J48 classification algorithm for the prediction of diabetes. International Journal of Computer Applications, 98(22): 13-17. https://doi.org/10.5120/17314-7433
[9] Ranjeeth, S., Latchoumi, T.P., Victer Paul, P. (2020). A survey on predictive models of learning analytics. Procedia Computer Science, 167: 37-46. https://doi.org/10.1016/j.procs.2020.03.180
[10] Romero, C., Romero, J.R., Ventura, S. (2014). A survey on pre-processing educational data. In: Peña-Ayala A. (eds) Educational Data Mining. Studies in Computational Intelligence, 524: 29-64. https://doi.org/10.1007/978-3-319-02738-8_2
[11] Ranjeeth, S., Latchoumi, T.P., Victer Paul, P. (2020). Optimal stochastic gradient descent with multilayer perceptron based student's academic performance prediction model. Recent Advances in Computer Science and Communications, 13: 1. https://doi.org/10.2174/2666255813666191116150319
[12] Powers, D.M.W. (2011). Evaluation: From precision, recall, and F-measure to ROC, informedness, markedness, and correlation. International Journal of Machine Learning Technology, 2(1): 37-63. arXiv:2010.16061.
[13] Swaminathan, S. (2019). The burden of child and maternal malnutrition and trends in its indicators in the states of India: The global burden of disease study 1990-2017. The Lancet Child & Adolescent, 3(12): 855-870. https://doi.org/10.1016/S2352-4642 (19)30273-1
[14] Mohseni, M., Aryankhesal, A., Kalantari, N. (2019). Prevention of malnutrition among children under 5 years old in Iran: A policy analysis. PLoS One, 14(3): e0213136. https://doi.org/10.1371/journal.pone.0213136
[15] Headey, D., Heidkamp, R., Osendarp, S., Ruel, M., Scott, N., Black, R., Shekar, M., Bouis, H., Flory, A., Haddad, L., Walker, N. (2020). Impacts of COVID-19 on childhood malnutrition and nutrition-related mortality. The Lancet, 396(10250): 519-521. https://doi.org/10.1016/S0140-6736(20)31647-0