Medjeded Merati* | Saïd Mahmoudi | Abdelkader Chenine | Mohamed A. Chikh
OPEN ACCESS
Mammography provides a useful tool for breast cancer detection. However, many doctors have difficulty in making the right decision based on mammograms. This paper aims to set up a deep learning (DL) architecture that can effectively differentiate between benign and malignant tumors. Specifically, a new triplet convolutional neural network (CNN) was established with three subnetworks, each of which contains a succession of layer blocks. Each block consists of two convolutional layers, a dropout layer and a max-pooling layer. During operation, the region of interest (ROI) extracted from the mammogram is imputed to the first subnetwork, and processed by the Canny filter. The filtered results become the input of the second subnetwork, while the third subnetwork takes the whole image as input. To verify the effectiveness of our architecture, a set of 500 images from 301 patients was extracted from the DDSM database and augmented to 4,000 images, and divided into a training set (80 %) and a testing set (20 %). The results show that our architecture achieved an accuracy of 93.13 %, a sensitivity of 96 % and a specificity of 90.25 %. This research provides a desirable way to identify breast cancer based on mammography.
breast cancer, mammography, deep learning (DL), subnetwork, classification, malignant, benign
With nearly 1.7 million new cases diagnosed in 2012, according to World Cancer Research Fund [1], Breast cancer is the most commonly occurring cancer in women and the second most common cancer overall. It is the fifth most common cause of death for women [2].
Facing this challenge, millions of mammographic exams are carried out each year mainly through screening programs implemented to detect breast cancer at an early stage. The imaging such as mammography is an important part of the breast cancer screening assessment process [3].
Although, mammography is by far the most common modality and has consequently enjoyed the most attention, the vast amount of data generated in screening programs using mammography has to be inspected for signs of cancer by experts, which is a hard task in time and in budget.
Therefore, there is a clear need for a system providing automatic diagnostic [4]. In order to assist radiologist’s interpretation Computer Aided Diagnosis (CAD) systems have been developed to improving clinician’s accuracy [5-6].
So, especially after the recent advances in deep neural networks (DNN), improvements in biomedical images analysis could be exploited to enhance the performance of CAD [7-8]. In following we will cite some recent studies:
Li et al. [9], proposed an improved DenseNet neural network model by replacing the first convolutional layer with the Inception structure. They experiment their model on a set of images counting a 2042 case (i.e. 1011 malignant and 1031 benign) provided by the First Hospital of Shanxi Medical University.
Wang et al. developed context-sensitive deep neural networks (DNN) where a simplified version of AlexNet based on deep CNN with five convolutional layers and two FC layers is used in the classification of the segmented masses as benign or malignant [10].
AL-antari et al. [11] developed a completely integrated CAD system involving detection, segmentation and classification of breast masses. Applied to INbreast database, their proposed deep convolutional neural network classification including masses segmentation.
Al-masni et al. [12] proposed a CAD system with YOLO convolutional neuronal network model which offers the possibility to learn ROIs and their background at the same time. Thus, their system can achieve breast masses detection and classification in a single framework. They used an original database of 600 cases and an augmented dataset of 2400 images.
Gao et al. [13] proposed to use emerging technology in the field of contrast-enhanced digital mammography (CEDM), which includes a low energy (LE) image similar to full field digital mammography (FFDM), and a recombined image leveraging tumor neoangiogenesis similar to breast magnetic resonance imaging (MRI). Their contribution lies in addressing the limited accessibility of CEDM and developing SD-CNN to improve the breast cancer diagnosis using FFDM in general. They develop a 4-layer shallow CNN to discover the nonlinear association between LE and recombined images from CEDM. To evaluate the validity of their approach the authors used 89 FFDM cases from INbreast.
The CheXNet model was acquired as pre-trained deep learning model [14]. CheXNet is a 121-layers DenseNet model, which layers are grouped into 4 dense blocks [18]. As mammograms data in DDSM database consists of four images per case, the authors proposed a new model with four parallel input paths. Several configurations for the new model were tested.
Al-antari et al., [15] proposed a CAD system utilizing one of the deep learning algorithms namely Deep Belief Network (DBN), to classify breast masses into normal, benign, or malignant. They train their proposed DBN-based CAD system using the DDSM database.
Swiderski et al. [16], proposed CNN architecture with three convolution layers and two Fully Connected layers on the output. As input, they extracted ROIs from DDSM images created on the basis of the non-negative matrix factorization (NMF) and statistical self-similarity. The total number of ROI images used in experiments was 11218.
Levy et al. [17], fine-tuned the AlexNet and GoogLeNet model to classify lesions in mammograms extracted from DDSM database. For both the AlexNet and GoogLeNet, they use the same base architecture but replace the last fully-connected (FC) layer to output 2 classes. They also remove the two auxiliary classifiers from the GoogLeNet.
Therefore, in this paper, we propose a new scratch-based CNN model with three inputs to distinguish between malignant or benign lesions in mammograms. The data augmentation methods are applied on a DDSM sample to avoid the overfitting of the model caused by small data set.
The remainder of this paper is organized as follows: section 2 describes our proposed CNN model with the explanation of the motivation that led to this proposal. Section 3 presents the experiments performed and the results obtained by evaluating the performance of the proposed CNN in identifying the lesions. Finally, the conclusion is given in section 4.
2.1 Motivation
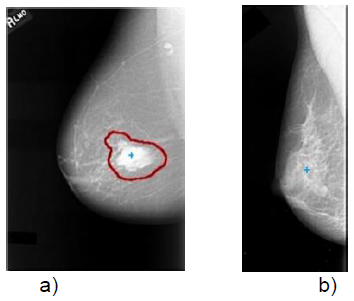
Observation of mammographic images and comparing those representing abnormal cases to those that represent normal cases, has led us to conclude that the regions of interest detected in images of pathological cases are often more intense than the other selected regions in the images of normal cases. This finding is clearly visible in Figure 1 where the image (a) shows an example from the DDSM database that contains a pathological area marked in red by a domain expert while the image (b) shows another example from the same database representing a normal case with less intense regions.
Figure 1. Examples of a) a pathological region and b) a normal case
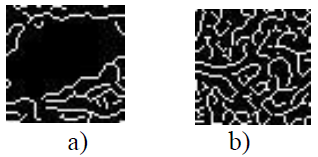
To confirm this finding, we applied the canny filter to a region containing abnormalities (Figure 2.a) and on another region in the center of the normal cases of mammography (Figure 2.b).
Figure 2. Application of canny filter on a) the pathological region and b) a center region of a normal case
As illustrated in the Figure 2, since the area of the Figure 2.a representing a pathological case has a higher intensity, so it has less of detected edges by canny filter. Inversely, as the area of the Figure 2.b representing a normal case, has less intensity so it has more contours detected by Canny.
But exploiting only the filtered region of interest (ROI) yielded insufficient results. So, we have proposed to add the context rounding the ROI. Thus, we have associated the ROI and the whole mammographic image to the filtered ROI.
2.2 Our proposed model
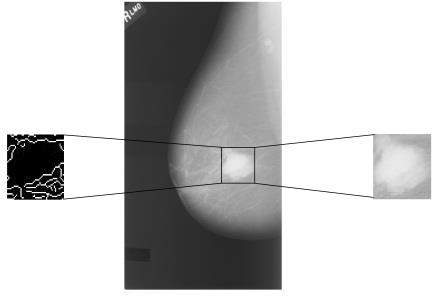
In this study, we propose a classifier which differentiates between benign case and malignant case in mammograms. The model takes into account simultaneously three data sources as inputs (Figure 3). (1) An image window covering the region of interest. (2) The canny filter applied to the same image window used in first input and we pass it as input. (3) The whole image considered as context surrounding the region of interest.
Figure 3. An area of image is extract from the region of interest and the same area is extract and filtered by canny
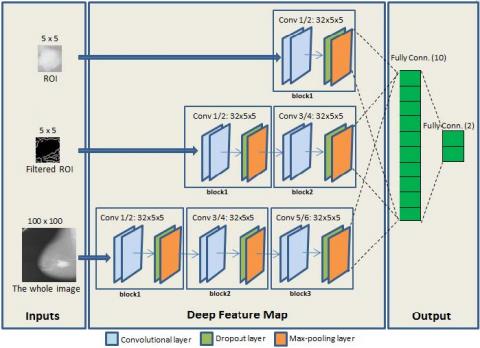
Accordingly, the classifier that we propose is formed by three subnetworks, the first one for the ROI, the second one for the filtered ROI and the third one is consecrated to the whole image, as illustrated in Figure 4.
The architecture of each subnetwork consists on a succession of layer blocks containing two conventional (Conv) layers, one dropout layer and one max-pooling (Pooling) layer.
The first subnetwork in the CNN model is formed by only one block, the second subnetwork is formed by two blocks and the third one is formed by three blocks.
Afterwards, the three subnetworks are concatenated and followed by two fully connected layers (FC). In the following, the description of these layers is detailed.
Conventional layer extracts the features from the input and produces as output a features map of pixels. The number of these output pixels depends on the value (either ‘valid’ or ‘same’) affected to the padding parameter of the layer. With the value of ‘valid’ the input volume is not zero-padded and the spatial dimensions are reduced. In our case, we opted to preserve the spatial dimensions by choosing the value of ‘same’. The impact of this option on the performance will be discussed later in the section 3.5.
So, in the first subnetwork, the features are generated by convolving its input ROI with 32 conventional kernels. A feature map of 5×5 pixels is preserved and produced. In the same way, the second subnetwork convolves its input filtered ROI with 32 conventional kernels for producing a feature map of 5×5 pixels. For the third subnetwork, a feature map of 100×100 pixels are produced by convolving its input whole image with 32 conventional kernels.
The size of the convolutional kernel is decreased from 3×3 to 1x1 in the case of the first and second subnetwork due to the small size of input (i.e. 5×5 pixels). However, all the convolutional kernels are set to be 3×3 in size in the third subnetwork.
The dropout layer is used to prevent overfitting by randomly selecting nodes to be dropped-out with a probability of 50 % each weight update cycle.
The max-pooling layer achieves a non-linear down-sampling of the features maps by partitioning the input features into a set of non-overlapping rectangles and for each sub-region, (i.e. with stride 2) outputs the maximum value. With 10 neurons and a “Relu” activation function, the first fully connected takes as input all the features from the concatenated three subnetworks.
Figure 4. The proposed triplet CNN architecture
Finally, a second fully connected with two neurons and a sigmoid activation function gives the probability if an input is belonging to one of the two classes (i.e. malign or benign).
3.1 Primary database
In this study, we used a set of 500 images taken from 301 cases (i.e. 151 malignant cases and 150 benign cases) that we selected randomly from Digital Database for Screening Mammography (DDSM) [19] to train and test our proposed CNN model. After being created by the University of South Florida, the DDSM database has been widely used in research work related to breast cancer diseases. It consists of 2620 cases of 4 mammograms taken in two views: mediolateral oblique (MLO) and craniocaudal (CC). In each mammogram, suspicious lesions are marked by domain experts and explained by information of ground truth.
3.2 Normalization
In order to prepare the mammographic images for exploitation by our CNN model, we resize the whole images to 100×100 pixels. Concerning the ROIs (i.e. ROIs and Filtered ROIs), we used the boundaries of the lesions marked by the domain experts to crop regions of 5×5 pixels from the resized images [19-20].
3.3 Augmented database
To train deep learning models and avoid overfitting problems, the use of a biggest database is recommended. It has been proven in the literature [21] that mammographic mass classification can be tackled effectively by employing an extended augmentation scheme. That is why; we have opted to use the technique of data augmentation to increase the training data.
Since we use the whole image as input to our CNN model and to avoid producing unrealistic images, we avoid rotating images in the data augmentation as used in the literature [9-12, 17].
Indeed, we have augmented our original database eight times by applying a zoom two times: 1.3, 1.5 and an elastic transformation to images. These transformed images were also flipped horizontally. So, we obtained an augmented database of 4000 images (i.e., the 500 original plus augmented data).
3.4 Evaluation metrics
In order to evaluate the proposed method, we need objective evaluation metrics to determine the system’s capability. Effectively, in our study we need to be careful with our false negative, in other words we don’t want to classify a patient as no malignant when he is in fact cancer positive. The false positive is equally important in our study that we don’t want to mistakenly classify any patient as malignant and uselessly subject him to painful and expensive treatments.
For that, we choses additionally to the accuracy metric to uses the sensitivity and specificity metrics which are defined as follows [11-12]:
Accuracy$=\frac{T P+T N}{T P+T N+F P+F N}$ (1)
Sensitivity $=\frac{T P}{T P+F N}$ (2)
Specificity $=\frac{T N}{T N+F P}$ (3)
TP (True Positive) is the number of images accurately identified as malignant. FP (False Positive) gives the number of images mistakenly classified as malignant. TN (True Negative) refers to the number of images accurately identified as benign. FN (False Negative) is the number of images mistakenly classified as benign.
3.5 Results
In Table 1, we summarize the validation results obtained by our proposed CNN classifier with various model structures. Each model represents the combination among of combinations blocks with which the subnetwork 1, subnetwork 2 and subnetwork 3 can be formed.
Table 1. Results obtained by our proposed CNN classifier with various model structures
|
Model structure |
Accuracy |
Sensitivity |
Specificity |
|
111 |
86.63 |
93.00 |
80.25 |
|
112 |
89.25 |
92.25 |
86.25 |
|
113 |
88.50 |
85.50 |
0.915 |
|
121 |
86.38 |
89.50 |
83.25 |
|
122 |
90.75 |
90.50 |
91.00 |
|
123* |
93.13 |
96.00 |
90.25 |
|
131 |
86.63 |
95.75 |
77.50 |
|
132 |
89.88 |
86.00 |
93.75 |
|
133 |
90.13 |
88.50 |
91.75 |
|
211 |
88.38 |
90.00 |
86.75 |
|
212 |
89.75 |
86.25 |
93.25 |
|
213 |
87.38 |
99.00 |
75.75 |
|
221 |
86.25 |
92.00 |
80.50 |
|
222 |
89.25 |
92.75 |
85.75 |
|
223 |
89.5 |
95.75 |
83.25 |
|
231 |
85.36 |
98.00 |
72.75 |
|
232 |
89.75 |
88.00 |
91.50 |
|
233 |
89.75 |
85.25 |
94.25 |
|
311 |
82.75 |
84.75 |
80.75 |
|
312 |
89.75 |
91.25 |
88.25 |
|
313 |
85.63 |
98.75 |
72.50 |
|
321 |
86.13 |
87.25 |
85.00 |
|
322 |
86.63 |
99.00 |
74.25 |
|
323 |
92.38 |
96.75 |
88.00 |
|
331 |
87.25 |
93.50 |
81.00 |
|
332 |
90.88 |
90.50 |
91.25 |
|
333 |
89.88 |
96.25 |
83.50 |
(*123: means 1 layer block for subnetwork1, 2 layer blocks for subnetwork2 and 3 layer blocks for subnetwork3).
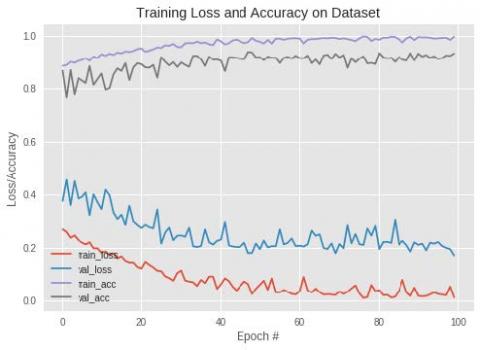
Figure 5. Training loss and accuracy on dataset
As we can see in Table 1, the best model structure was the one formed with one layer block for the subnetwork1, two layer blocks for subnetwork2 and three layer blocks for the subnetwork3 (i.e. model structure: 123), achieving an accuracy of 93.13 %. This raw accuracy is confirmed by the fact that a sensitivity of 96 % and a specificity of 90.25 % are reached.
These results (Table 1) obtained by our proposed CNN model by using a convolution layers with padding parameter tuned at ‘same’ which mean that the spatial dimensions of data at the input of the layer are preserved at its output. Against that, a less good results (an accuracy of 91.37 %, a sensitivity of 92.25 % and a specificity of 90.5 %) are obtained by the similar model but with using the padding parameter of the convolution layer tuned on ‘valid’ which mean that the spatial dimensions of the data at the input of the convolution layer are allowed to be reduced at its output.
In addition, the Figure 5 shows the loss curves of both the deep learning training and testing in continuous decrease. This finding proves that our proposed CNN model does not overfit, which guarantees it to keep the same prediction performance with new data.
We have also explored the state-of-art methods using Deep Learning in breast cancer diagnosis system and compared our method with four methods from the literature (Table 2) that used DDSM database as training and testing dataset. As we can see, our proposed model is ranged against the others models as the better one.
Table 2. Comparison between the performances of our proposed CNN model against others in the latest studies using DDSM database
|
Reference |
Base Architecture |
Accuracy (%) |
|
Pardameana et al. [14] |
CheXNet |
90.38 |
|
M.A. Al-antari et al. [15] |
DBN |
90.48 |
|
Swiderski et al. [16] |
Scratch based |
84.75 |
|
Levy et al. [17] |
AlexNet GoogLeNet |
90 92.29 |
|
Our proposed model |
Scratch based |
93.13 |
In this paper, a system based on deep learning for classification of lesions in mammograms is presented by proposing a CNN model which achieves benign and malignant classification of mammograms. In summary, according to the good results obtained by our proposed CNN model, we can conclude that developing a system based deep learning from scratch can gives improvement as well as the systems which use the transfer learning technique.
Our future work includes using others features as inputs and others images databases.
[1] World Cancer Research Fund/American Institute for Cancer Research. (2018). Diet, nutrition, physical activity and cancer: A global perspective. Continuous Update Project Expert Report 2018. dietandcancerreport.org, accessed on March 1, 2019.
[2] Ferlay, J., Soerjomataram, I., Ervik, M., Dikshit, R., Eser, S., Mathers, C., Rebelo, M., Parkin, D.M., Forman, D., Bray, F. (2012). GLOBOCAN 2012 v1.0, Cancer Incidence and Mortality Worldwide: IARC Cancer Base No. 11.2015.
[3] Hamidinekoo, A., Denton, E., Rampun, A., Honnor, K., Zwiggelaar, R. (2018). Deep learning in mammography and breast histology, an overview and future trends, Medical Image Analysis, 47: 45-67. http://dx.doi.org/10.1016/j.media.2018.03.006
[4] Petrick, N., Sahiner, B., Armato III, S.G., Bert, A., Correale, L., Delsanto, S., Freedman, M.T., Fryd, D., Gur, D., Hadjiiski, L., Huo, Z.M., Jiang, Y.L., Morra, L., Paquerault, S., Raykar, V., Samuelson, F., Summers, R.M., Tourassi, G., Yoshida, H., Zheng, B., Zhou, C., Chan, H.P. (2013). Evaluation of computer-aided detection and diagnosis systems. Med. Phys., 40(8). http://dx.doi.org/10.1118/1.4816310
[5] Jalalian, A., Mashohor, S., Mahmud, R., Karasfi, B., Saripan, M.I.B.S., Ramli, A.R.B. (2017). Foundation and methodologies in computer-aided diagnosis systems for breast cancer detection. EXCLI Journal, 16: 113-137. http://dx.doi.org/10.17179/excli2016-701
[6] Doi, K. (2007). Computer-aided diagnosis in medical imaging: Historical review, current status and future potential. Computerized Medical Imaging and Graphics, 31(4-5): 198-211. https://doi.org/10.1016/j.compmedimag.2007.02.002
[7] Gardezi, S.J.S., Elazab, A., Lei, B., Wang, T. (2019). Breast cancer detection and diagnosis using mammographic data: Systematic review. Journal of Medical Internet Research, 21(7): e14464. https://doi.org/10.2196/14464
[8] Tsochatzidis, L., Costaridou, L., Pratikakis, I. (2019). Deep learning for breast cancer diagnosis from mammograms-A comparative study. J. Imaging 2019, 5(3): 37. https://doi.org/10.3390/jimaging5030037
[9] Li, H., Zhuang, S., Li, D., Zhao, J., Ma, Y. (2019). Benign and malignant classification of mammogram images based on deep learning. Biomedical Signal Processing and Control, 51: 347-354. https://doi.org/10.1016/j.bspc.2019.02.017
[10] Wang, J., Yang, Y. (2018). A context-sensitive deep learning approach for microcalcification detection in mammograms. Pattern Recognition, 78: 12-22. https://doi.org/10.1016/j.patcog.2018.01.009
[11] Al-antari, M.A., Al-masni, M.A., Choi, M.T., Han, S.M., Kim, T.S. (2018). A fully integrated computer- aided diagnosis system for digital X-ray mammograms via deep learning detection, segmentation, and classification. International Journal of Medical Informatics, 117: 44-54. http://dx.doi.org/10.1016/j.ijmedinf.2018.06.003
[12] Al-masni, M.A., Al-antari, M.A., Park, J.M., Gi, G., Kim, T.Y., Rivera, P., Valarezo, E., Choi, M.T., Han, S.M., Kim, T.S. (2018). Simultaneous detection and classification of breast masses in digital mammograms via a deep learning YOLO-based CAD system. Computer Methods and Programs in Biomedicine, 157: 85-94. http://dx.doi.org/10.1016/j.cmpb.2018.01.017
[13] Gao, F., Wu, T., Li, J., Zheng, B., Ruan, L., Shang, D., Patel, B. (2018). SD-CNN: A shallow-deep CNN for improved breast cancer diagnosis. Comp. Med. Imag. and Graph., 70: 53-62. https://doi.org/10.1016/j.compmedimag.2018.09.004
[14] Pardameana, B., Wawan Cenggorob, T., Rahutomoc, R., Budiartob, A., Karuppiahd, E.K. (2018). Transfer learning from chest X-ray pre-trained convolutional neural network for learning mammogram data. Procedia Computer Science, 135: 400-407. http://dx.doi.org/10.1016/j.procs.2018.08.190
[15] Al-antari, M.A., Al-masni, M.A., Park, S.U., Park, J.H., Metwally, M.K., Kadah, Y.M., Han, S.M., Kim, T.S. (2017). An automatic computer-aided diagnosis system for breast cancer in digital mammograms via deep belief network. J. Med. Biol. Eng., 38(3): 443-456. http://dx.doi.org/10.1007/s40846-017-0321-6
[16] Swiderski, B., Kurek, J., Osowski, S., Kruk, M., Barhoumi, W. (2016). Deep learning and non-negative matrix factorization in recognition of mammograms. in Proc. SPIE 10225B, Eighth Int. Conf. Graphic and Image Processing. https://doi.org/10.1117/12.2266335
[17] Levy, D., Jain, A. (2016). Breast mass classification from mammograms using deep convolutional neural networks. 30th Conference on Neural Information Processing Systems (NIPS 2016), Barcelona, Spain.
[18] Huang, G., Liu, Z., van der Maaten, L., Weinberger, K.Q. (2017). Densely connected convolutional networks. In: 2017 IEEE Conference on Computer Vision and Pattern Recognition (CVPR), pp. 2261-2269. http://dx.doi.org/10.1109/CVPR.2017.243
[19] Heath, M., Bowyer, K., Kopans, D., Moore, R. Kegelmeyer, W.P. (2000). The digital database for screening mammography. in: Proc. 5th Int. Workshop Digit. Mam- mogr., Medical Physics Publishing, pp. 212-218.
[20] University of South Florida, http://marathon.csee.usf.edu/Mammography/Database.html, accessed on 23/03/2019.
[21] Hamidinekoo, A., Denton, E., Rampun, A., Honnor, K., Zwiggelaa, R. (2017). Investigating the effect of various augmentations on the input data fed to a convolutional neural network for the task of mammographic mass classification. In: Annual Conference on Medical Image Understanding and Analysis, pp. 398-409. http://dx.doi.org/10.1007/978-3-319-60964-5_35