Isaac F. Odesola | Ebenezer O. Ige* | Akeem A. Adesokan | IfeOluwatayo A. Ige
OPEN ACCESS
Thermal comfort is an important consideration in architetctural design of modern building because of the implication on phgysiological impact of inhabitants. This study presents a near-nature learning strategy using Artificial Neural Networks (ANN) platform predicated on feed-forward back propagation model to predict variation in air distribution on building’s component to its thermal performance with consideration for energy management. Leverberg-Marquardt (LM) Algorithm was utilized to train the required location-specific geographical data in ANN module. Correlation coefficient and mean square error were used to validate the model. The results obtained with the trained data in neural network computing on thermal performance agreed very closely with those obtained in the analytical model used in the analysis with high correlation coefficient and minimal error metric was recorded for the mean square error. We study established the suitability of ANN-based prediction of thermal comfort and energy profiling in HVAC systems for near-nature effectiveness and performance of ventilation devices which may be applicable to residential and commercial buildings. The benefit of the ANN-based strategy presented in this study could be utilized for design of ventilation machines in eco-friendly buildings.
thermal comfort, leverberg-marquardt, neural networks, correlation coefficient, mean square error
For years, buildings have been the basic shelter for man from the extremes of the outdoor environmental conditions. In order for the primary objective of building to its occupants not to be defeated, high thermal performance of the buildings should be guaranteed. With raising effects of climate change, the subject of thermal comfort and energy performance is an important consideration in building design in the recent years [1]. Pre-informed knowledge of thermal regime in building for varying categories of building under a wide range of environmental conditions is presently a critical consideration in building planning and construction. Some studies have estimated for exterior envelope, interior environmental analysis with simplifying assumptions may have showed to be ill-defined because the model is time dependent, multi-dimensional and non-linear [2]. For certain buildings, indoor thermal ambience is affected by various weather components, such as the solar irradiance, daylight, wind, and outdoor temperature. These components are critical to the energy transfer between the indoor and outdoor environments under fluctuating weather conditions [3].
Proper ventilation required adequate supply outdoor air to an enclosed space removing stale air from the space and it is significant in maintaining thermal performance in build environment [4]. Natural ventilation in building relies on wind and thermal buoyancy as driving forces while driving pressure derived from wind and thermal buoyancy are low compared to those produced by fans in mechanical ventilation system [5, 6]. Whether ventilation is natural or mechanical, it is necessary to maintain acceptable indoor air quality (IAQ). Weather buildings are heated or cooled; ventilation often constitutes a relatively large component of the heating or cooling load [7]. Poor ventilation can cause a build-up in indoor air pollutants like dust, pollen, mould, and household chemicals [8]. Numerous standards quantify the amount of ventilation that is required for acceptable IAQ. The indoor air quality procedure is an alternative to a prescribed rate of airflow in ASHRAE 62. The ventilation rate procedure of ANSI/ASHRAE Standard 62 can also be used to determine required outdoor air quantities based on occupancy information provided as evident in Ref. [9].
The selection of heating, ventilation and air-conditioning (HVAC) is a critical consideration for building owners, architects, engineers, and contractors during the design and construction phases of a building. Ghattas, et al. [10] developed a survey that outlined different type of buildings system and materials decisions that need to be made during the design and construction process. The HVAC should be selected in such a way it will not have negative impact on the total thermal performance of the building. Several factors are taken into consideration during the selection of HVAC for a building which includes preference of the building owner, available construction budget; size and shape of the building; function of the building; architectural limitations; life-cycle cost; ease of operation and maintenance; time available for construction [11].
A fundamental way to support design decisions for energy-efficient buildings is the use of building performance simulation tools (BPS) [12]. Since the inception of the building simulation discipline it has been evolving constantly as a vibrant discipline that produced a variety of Building Performance Simulation (BPS) tools that are scientifically and internationally validated. The foundation work for building simulation was done in the 60s and 70s focusing on building thermal performance addressing load calculation and energy analysis [13]. Towards late 70s and early 80s, efforts were geared into analytically validating and experimental testing methods for codes for simulation tools. This foundation work was developed mainly within the research community of the mechanical engineering domain. Simulation tools were developed by technical researchers and building scientist aiming to address the needs of engineer.
Building simulation models can accurately quantify building energy loads but are not part of what is considered in the initial stage of building development by designer. The Building sector has a substantial shared of the primary energy supply being a major contributor to conventional fuels consumption. The main simulation tools for energy analysis are TRNSYS, DOE-2, Energyplus, BLAST, ESP-r and selection of these tool depends on type of criteria, the required accuracy, easiness, availability of required data, buildings phase [14]. Apart from simulated tools, computer based decision tool is also applicable in HVAC design process in building. Revit-MEP is a common decision making tools utilized by Architects in designing for buildings and it imports information from AUTOCAD. The building information modeling (BIM) workflow offered by Revit-MEP not only maximizes productivity but also helps to streamline design and documentation workflows. The demerit of Revit-MEP as a tool to achieve BIM is that information defined in the 3D model has to be redefined in the energy analysis feature [15]. Another strategic decision making tools utilized is a spreadsheet decision making tool. The design team have to consider many different parameters and design options from an early stage which can ultimately have a significant impact on the final performance of the building [16-18].
In view of theafore-mentioned, this study is aimed at determining the thermal performance of a residential building using four parameters namely; ambient temperature, solar radiation, relative humidity and wind speed using Artificial Neural Network (ANN). The inventor of the first neurocomputer, Dr. Robert Hecht-Nielsen, defines a neural network as a computing system made up of a number of simple, highly interconnected processing elements, which process information by their dynamic state response to external inputs. ANN is part of Artificial Intelligence (AI), while it is capable of learning to recognize non-linear input–output relationship [19]. ANN learns the relationship between input and output parameters by means of historical data. Another advantage is the ability to manage large complex systems with many parameters interrelated between themselves [20]. The artificial neural network (ANN), which is one type of the various artificial intelligence theories, can successfully operate non-linear systems or systems with unclear dynamics without the experts’ intervention [21]. ANN technique has the advantages of high speed of calculation; useful in solving the non-linear problems; do not required any previous knowledge of system model; simplicity; provide good search and capability of network to learn from example. Nowadays, ANNs are widely used as an alternative technology to faced highly complex, incomplete data sets, fuzzy or incomplete information and ill-defined problems. ANN technique has disadvantaged also, because of its inability to distinguish which parameter may causing a low reading. ANNs have been implemented to problems related to the fields of optimization, pattern recognition, image processing and forecasting etc. [22].
Several works have been done in the application of artificial neural network to building modelling. Moon, et al. [23] used ANN models to examine the thermal performance of double-skin enveloped buildings under different opening conditions. In this work, they used four ANN algorithms to predict future indoor temperatures under different opening conditions of internal and external envelope. Performance test with preliminary conventional non-ANN based method in terms of thermal control and efficiency showed that ANN models can be used to predict future indoor temperature conditions. Kumar, et al. [24] used neural fitting (nftool) of neural network of Matlab to calculate total conduction losses of a six-storey building. The result showed that data was best fit for regression coefficient of 0.9955 with however a low validation performance estimated as 0.41 was obtained. To address the lean opertional performance, Suraya [25] employed ANN technique to predict model to forecast indoor environmental parameters. Performance of the developed model was evaluated using R2 and MSE and accuracy measured using mean absolute percentage error (MAPE). Kemajou, et al. [26] applied ANN for predicting indoor air temperature in modern building, with experimental data. They used Leverberg-Marquardt inputs algorithm on MATLAB with optimal structure of multilayer perceptron (MLP) having seven input variables, thirty hidden and one neuron in the output layer. Their result testified that ANN can be valuable tool for hourly indoor air temperature prediction. In their work, Agarwa [27] predicted cooling loads in buildings in tropical countries using ANN with back propagation algorithm having four neurons in the input layer, twenty-five in the hidden layer and one in the output. Activation function used in the input is pure linear while for others, logarithmic sigmoid was used. Results showed an accuracy of 0.9857 in the predicting samples. This study lends credence to the suitability of neural algothrim in prediction of thermal conduction in building.
The present study was designed to further investigate indoor thermal performance in connection to dwellers health and comfort. Numerical observation of the variation of thermal performance determinants under steady-state approach of a residential building using neural network was undertaken. This evaluation is tested with algorithm of artificial neural network intended to inform design decision for HVAC system to be used in the building. Its envisaged that this procedure would ensure high indoor air quality of the building’s occupants with minimal energy usage while preventing sick building syndrome in the built environment. This report is organized as: section 1 introduces background and literatures. The methodology and procedure for executing this study emancipated in section while results obtained and discussion on its implications is contained in section 3. The conclusions of the findings are discussed in section 4 and references are contained in section 5 of this report.
In this study, a three-bedroom apartment depicted below is used as the computational study for the prediction with five family members as occupants. The building components considered in this study for each room are wall, window and door in which Table 1 is generated.
Table 1. Dimensioning of components of the building under study
|
WALL |
WINDOW |
DOOR |
|||||
|
S/No |
Location |
Dimension |
Qty |
Dimension |
Qty |
Dimension |
Qty |
|
1 |
Bedroom 1 |
3550*4400 |
1 |
1350*1200 |
1 |
2200*900 |
1 |
|
2 |
Bedroom 2 |
3000*4400 |
2 |
1350*1200 |
2 |
2200*900 |
1 |
|
3 |
Bedroom 3 |
3850*3000 |
1 |
1350*1200 |
1 |
2200*900 |
1 |
|
4 |
Family Lounge |
4975*4675 |
1 |
1350*1200 |
1 |
2200*900 |
1 |
|
5 |
Main Lounge |
6110*4500 |
1 |
1350*1200 |
1 |
2200*900 |
1 |
|
6 |
Presit |
2400*4750 |
1 |
1350*1200 |
1 |
2200*900 |
1 |
|
7 |
Dining |
3200*3300 |
1 |
1350*1200 |
1 |
2200*900 |
1 |
|
8 |
Kitchen |
3200*2850 |
1 |
1350*1200 |
1 |
2200*900 |
1 |
|
9 |
Store |
975*2850 |
1 |
800*600 |
1 |
2200*900 |
1 |
Figure 1. Computational space for the study
2.1 Thermal performance model
In estimating the thermal performance of the building, steady state approach is employed. Under steady state, the heat capacity of materials in the building is not considered. The heat balance balanced equation is given as:
$Q_{T}=Q_{c}+Q_{v}+Q_{s}+Q i$ (1)
where, $Q_{T}$ is the total heat flow in the building; $Q_{c}$ is the heat flow through conduction; $Q_{v}$ is the heat flow through ventilation; $Q_{s}$ is heat flow through solar heat gain and $Q_{i}$ is the internal heat gain within the building. Based on the computational space (the building) as shown in figure above, the following assumptions are made: the layout is two-dimensional; the difference between the long wavelength radiation incident on the surface from the sky and the surroundings radiation emitted by a blackbody at ambient temperature is vertical throughout i.e. $\Delta R$ is zero.
(1) Heat flow through conduction Qc
This is given as
$Q_{c}=A U \Delta T$ (2)
where, A=Surface area (m2); U=Thermal transmittance (W/m2k); $\Delta T$=Temperature difference between the inside and outside air (k). This equation is solved for every external constituent of elements and the results summed up. Therefore, the heat flow rate through the building envelope by conduction is the sum of the area and the U-value products of all the elements of the building multiplied by the temperature difference. It is expressed as:
$Q_{c}=\sum_{i=1}^{N_{c}} A_{i} U_{i} \Delta T_{i}$ (3)
where, i = building element; $N_{C}$=Number of occupants; With solar radiation on the surface, $\Delta T=T_{s o}-T_{i}$; Where $T_{i}$=indoor temperature; $T_{so}$=sol-air temperature=$T_{s o}=T_{o}+\frac{\alpha S_{T}}{h_{o}}-\frac{\varepsilon \Delta R}{h_{o}}$; Where; $T_{o}$=daily average value of hourly ambient temperature; α=absorptance of surface for solar radiation; $S_{T}$=daily average value of hourly solar radiation incident on the surface (W/m2); $h_{o}$=outside heat transfer coefficient (W/m2k); $\boldsymbol{\varepsilon}$=emissivity of a surface; $\Delta R$=difference between the long wavelength radiation incident on the surface from the surroundings, and the radiation emitted by a black body at ambient temperature. This is evaluated for the building components wall, window and door per day. To evaluate this, environmental data sourced from International Institute of Tropical Agriculture Moniya, Ibadan Nigeria was used to get fundamental readings like dry-bulb temperature, average humidity etc. This environmental data provided basis for the analysis of this study.
(2) Heat flow through ventilation, Qv
The heat flow rate due to ventilation of air between the interior of a building and the outside depends on the rate of air exchange. It is given by:
$Q_{v}=\rho v_{r} c \Delta t$ (4)
where, $\rho$=densiity of air (kg/m3); $v_{r}$=ventilation rate (m3/s); c=specific heat of air (J/kgk); $\Delta t$=temperature difference $\left(T_{0}-T_{1}\right)(k)$. If the number of air changes is known, then
$v_{r}=N V / 3600$ (5)
where, N=number of air changes per hour; V=volume of the room or space (m3)
Thus,
$Q_{v}=\rho c N V \Delta t / 3600$ (6)
(3) Solar heat gain, Qs
The solar gain through transparent elements can be written as
$Q_{s}=\alpha_{s} \sum_{i}^{M} A_{i} S_{g i} \tau_{i}$ (7)
where, $\alpha_{S}$ = mean absorptivity of the space; $A_{i}$ = area of the ith transparent element (m2). $S_{g i}$ = daily average value of solar radiation (including the effect of shading on the transparent element (W/m2), $\tau_{i}$ = transmissivity of the transparent element, M = number of transparent elements.
(4) Internal heat gain, Qi
This is given as
Qi = (No of people* heat output rate) +Rated wattage of lamps + Appliance load (8)
From the estimated value of heat flow through conduction Qc, heat flow through ventilation Qv, solar heat gain Qs, and internal heat gain Qi, the total heat flow through the building is estimated.
2.2 ANN details
ANN contains three layers with feed-forward back propagation to train the data. The learning algorithm employed in this study was leverberg-marquardt (LM) which is faster than any other algorithm [28]. LM is used because of its widely application as optimization algorithm. It outperforms simple gradient and other conjugate gradient methods in a wide variety of problems [29]. To train the network, linear transfer functions is used in inputs, sigmoid function in hidden and output layer. A computer program was developed under MATLAB software (MATLAB User's Guide, copyright, 2009). The neural network topology is represented in Figure 2.
Table 2. Heat output rate of building occupants
|
NO OF PEOPLE |
HEATOUTPUT RATE |
NH |
|
|
6 |
100 |
600 |
|
Building Component |
Appliances |
No of Appliance Per Component |
Appliance Load (Watt) |
|
Main Lounge |
Television |
1 |
250 |
|
Home Theatre |
1 |
80 |
|
|
Water Dispenser |
1 |
120 |
|
|
Family Lounge |
Television |
1 |
250 |
|
Bedroom 1 |
Television |
1 |
250 |
|
Bedroom 2 |
Television |
1 |
250 |
|
Bedroom 3 |
Television |
1 |
250 |
|
Kitchen+Laundry |
Dishwasher |
1 |
3050 |
|
Water Heater |
1 |
3500 |
|
|
Washing Machine |
1 |
2500 |
|
|
Refrigerator |
1 |
120 |
|
|
10620 |
|||
|
Building Component |
No of Lamps |
Rated Wattage of Lamps |
Total Rated Wattage of Lamps (In Watts) |
|
Main Lounge |
4 |
100 |
400 |
|
Family Lounge |
3 |
100 |
300 |
|
Bedroom 1 |
3 |
100 |
300 |
|
Bedroom 2 |
3 |
100 |
300 |
|
Bedroom 3 |
3 |
100 |
300 |
|
Kitchen |
2 |
100 |
200 |
|
Presit |
1 |
100 |
100 |
|
Store |
1 |
100 |
100 |
|
2000 |
|||
Figure 2. Neural network for the thermal performance criterion
In the training, 50 neurons were applied in the hidden layer to obtain more accurate outputs. The neurons in the hidden layer perform two tasks: They sum the weighted inputs connected to them and pass the resulting summation through non-linear activation function to the output neuron or adjacent neurons of the corresponding hidden layer.
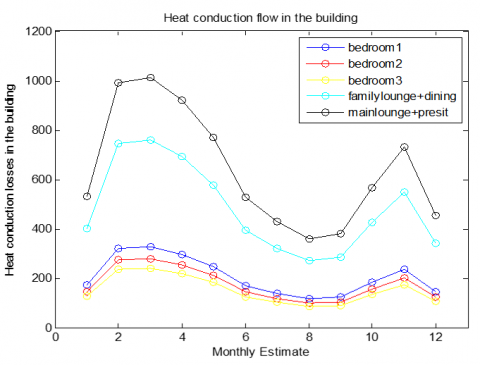
For simplistic representation of data in estimating the thermal performance of the proposed model, the annual data were reduced to monthly estimate for the heat conduction losses ($Q_C$), solar heat gain ($Q_S$), heat flow due to ventilation ($Q_V$) and internal heat gain ($Q_i$). The heat flow in the building was thus represented monthly as shown in Table 4 consists of heat flow due to conduction, heat flow due to ventilation, solar heat gain and internal heat gain. However, the monthly heat flow due to conduction in the building was represented separately in Table 4. This was done to separately show the distribution of the building components in the heat flow due to conduction.
Table 4. Monthly heat conduction losses in the building(In Watts)
|
Month |
Bedroom1 |
Bedroom2 |
Bedroom 3 |
Family Lounge+Dinning |
Mainlounge+Presit |
Total Qc |
|
Jan. |
172.24 |
147.21 |
126.75 |
400.12 |
533.1 |
1379.42 |
|
Feb. |
321.4 |
274.12 |
236.02 |
745.06 |
992.68 |
2569.28 |
|
Mar |
327.93 |
279.35 |
240.52 |
759.28 |
1011.62 |
2618.7 |
|
Apr. |
298.01 |
254.71 |
219.3 |
692.29 |
922.37 |
2386.68 |
|
May |
248.75 |
212.61 |
183.05 |
577.86 |
769.91 |
1992.18 |
|
Jun |
170.17 |
145.44 |
125.22 |
395.3 |
526.68 |
1362.81 |
|
Jul. |
138.65 |
118.5 |
102.03 |
322.08 |
429.13 |
1110.39 |
|
Aug. |
116.4 |
99.48 |
85.65 |
270.38 |
360.25 |
932.16 |
|
Sept. |
123.02 |
105.15 |
90.53 |
285.79 |
380.76 |
985.25 |
|
Oct. |
183.55 |
156.88 |
135.07 |
426.4 |
568.12 |
1470.02 |
|
Nov. |
236.58 |
202.2 |
174.09 |
549.57 |
732.23 |
1894.67 |
|
Dec. |
146.9 |
125.54 |
108.09 |
341.23 |
454.64 |
1176.4 |
Figure 3. Graph that shows the distribution of the building components in heat flow due to conduction
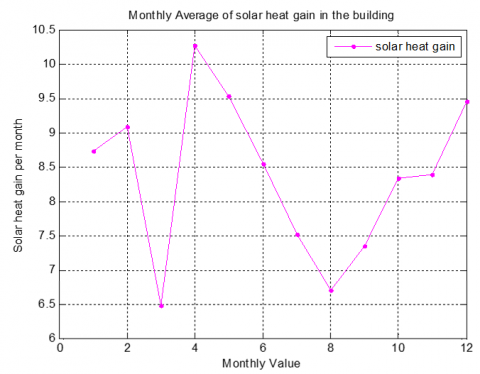
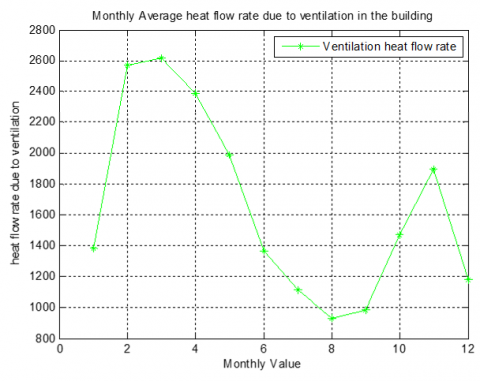
Figure 4. Graph that shows monthly solar ventilation gain in the building
From Figure 3, it can be inferred that 'the main lounge plus presit' had highest contribution of heat conduction flow in the building followed by family lounge plus dinning, bedroom1, bedroom2 and bedroom3 in that order. This variation was owed to the area of the respective component of the building and their respective envelopes like wall, window and door used in the proposed model.
Figure 4 shows the monthly distribution of heat flow due to ventilation in the building. From the graph, it could be inferred that the highest ventilation heat loss occurred in the month of March while the least occurred in the month of August. Table 5 above shows the combined heat flow in the building on monthly bases. From the table, the month that has highest degree of total heat flow March while August has lowest total heat flow in the building. This is further shown in Figure 5 below.
Figure 5. Graph that shows monthly heat loss in the building
Table 5. Monthly heat flow in the building (IN WATTS)
|
Month |
Qc |
Qv |
Qs |
Qi |
Qt |
|
January |
1379.42 |
17342.21 |
8.73 |
13220 |
31950.36 |
|
February |
2569.28 |
34313.13 |
9.09 |
13220 |
50111.5 |
|
March |
2618.7 |
35769.46 |
6.48 |
13220 |
51614.64 |
|
April |
2386.68 |
31501.84 |
10.27 |
13220 |
47118.79 |
|
May |
1992.18 |
25764.34 |
9.53 |
13220 |
40986.05 |
|
June |
1362.81 |
17018.24 |
8.54 |
13220 |
31609.59 |
|
July |
1110.39 |
13721.31 |
7.52 |
13220 |
28059.22 |
|
August |
932.16 |
11581.96 |
6.7 |
13220 |
25740.82 |
|
September |
985.25 |
12396.82 |
7.35 |
13220 |
26609.42 |
|
October |
1470.02 |
19005.12 |
8.34 |
13220 |
33703.48 |
|
November |
1894.67 |
25060.45 |
8.39 |
13220 |
40183.51 |
|
December |
1176.4 |
13656.76 |
9.46 |
13220 |
28062.62 |
|
Percentage of data |
Quantity of data |
|
|
Training |
70 % |
256 |
|
Testing |
15 % |
55 |
|
Validation |
15 % |
55 |
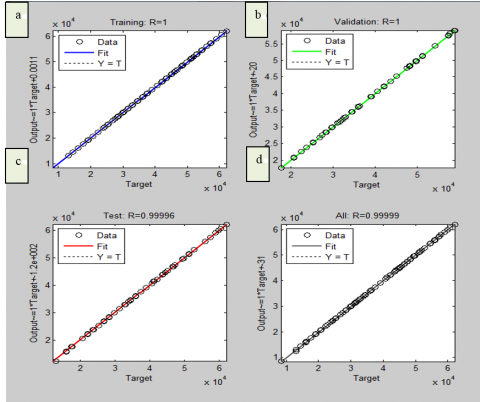
Figure 6. Results of trained data of input and output parameter under thermal performance
Table 7. Relationship between desired output and trained output under thermal performance
|
Relationship Between Desired Output and Trained Output |
||
|
Correlation |
MSE |
|
|
Training |
1.0000 |
0.0000 |
|
Testing |
1.0000 |
0.0000 |
|
Validation |
0.9996 |
0.0004 |
|
Overall |
0.9999 |
0.00001 |
Estimation of thermal performance of the building
To train the ANN trained network on MATLAB, the data was divided into three for training, testing, and validation as shown below. The first three plots (i.e. Figure 6a- Figure 6c) represent the training, validation, and testing data. The dashed line in each plot represents the perfect result-output=targets. The solid line represents the best fit linear regression line between outputs and targets. The R value is an indication of the relationship between the outputs and targets. The value R ~ 0.9998 indicates that there is an exact linear relationship between outputs and targets. If R is close to zero, then there is no linear relationship between outputs and targets. For the trained network result above, the training data indicates a good fit. The validation and test results also show R values that is greater than 0.9. The validation of is presented in Figure 5 showing the relationship between the trained output and the desired output for the specified conditions in the computational model building.
This study was conducted as a way to estimate thermal performance in a residential building using neural network of MATLAB with Leverberg-Marquardt as its algorithm. As neural network training works on data provision, and analytical data was generated with the environmental data. To test the validity of trained data under each criterion; regression curve, correlation between desired and target output and mean square error (MSE) were used. In view of the present predictive study, the following conclusions were drawn:
In a further study, it is that recommended that real-time prototype design and installation of selected HVAC devices be implemented based on thermo-physical observations obtained from neural network investigation.
[1] Liu, C., Zheng, Y., Qi, H., Liu, X. (2016). A model to determine thermal performance of a nonpventilated double glazing unit with PCM and experimental validation. Porcedia Engineering, 157: 293-300. https://doi.org/10.1016/j.proeng.2016.08.369
[2] Kusuda, T. (1977). Fundamentals of buildings heat transfer. Institute of Applied Technology, National Bureau of Standards, Washing, D.C 20234.
[3] Moon, J., Lee, J., D-Chang, J., Kim, S. (2014). Preliminary performance tests on artificial neural network models for opening strategies of double skin envelopes in winter. Energy and Buildings, 75: 301-31. https://doi.org/10.1016/j.enbuild.2014.02.007
[4] Shaw, C. (1999). Factors affecting the performance of ventilation systems in large buildings. Construction Technology Update No 33. Institute for Research in Construction Update No 33.
[5] Tommy, K. (2003). Natural ventilation in buildings –architectural concepts, consequences and possibilities. SINTEF/ Civil and Environmental Engineering Anne Grete Hestnes. PhD Thesis, NTNU/Faculty of Architecture and Fine Art.
[6] Awbi, H. (2010). Basic concept for natural ventilation of buildings. Technologies for Sustainable Built Environments Centre. University of Reading, UK. CIBSE BSG Seminar Natural and Mixed-mode Ventilation Modeling. http://www.reading.ac.uk/tsbe
[7] Barley, D. (2001). An overview of residential ventilation activities in the building American program (Phase1). NREL/TP-550-30107. Colorado 80401-3393. Contact No: DE-AC36-99-G010337.
[8] Dustin, D. (2014). Ventilation for better buildings: Natural ventilation vs mechanical ventilation. http://www.zehnderamerica.com, accessed on 28 March, 2018.
[9] Nicolas, L., Roland, C. (2005). Energy- efficient laboratory design. Journal of American Society of Heating, Refrigerating and Air-conditioning Engineers. 47(5): 58-64.
[10] Ghattas, R., Miller, T., Kirchan, R. (2015). The decision making process in the design of residential structures. cshub.mit.edu.MIT Concrete Sustainability.
[11] Christos, S. (2013). 8 keys factors that affect the Selection of HVAC system. My Engineering World. www.myengineeringworld.net/2013/11/8.
[12] Attias, S., Hengen, J., Bertran, L., Deherde, A. (2012). Selection criteria for building performance simulation tools: Contrasting architects’ and engineers’ needs. Journal of Building Performance Simulation, 5(3): 155-169.
[13] Janelle, S., Joseph, F., David, B., Ranjithan, R. (2012). Multivariate regression as an energy assessment tool in early building design. Building and Environment, 57: 165-175. https://doi.org/10.1016/j.buildenv.2012.04.021
[14] Kolokotsa, D., Diakaki, C., Grigoroudis, E., Stavrakakis, G., Kalaitzakis, K. (2009). Decision support methodologies on the energy efficiency and energy management in buildings. Advances in Building Energy Research, 3: 121-146.
[15] Sandberg, J. (2011). Computer based tool in the HVAC design process: Interface and data transfer between modelling in Revit and supporting draw and simulation tools. Dept of Energy and Environmental Building Services Engineering. Division of Energy and Environment Chalmers University of Technology. Goteberg, Sweden.
[16] Enz, C., Thompson, G. (2013). The options matrix tool (OMT): A strategic decision-making tool to evaluate decision alternatives. Cornell Hospital Tools, 4(1): 6-11.
[17] Maasen, W., DeGroot, E., Hoenen, M. (2003). Early design support tool for building services design model development. TNO- building and construction Research, Delft, The Netherlands. Eighth International IBPSA Conference Eindhoven, Netherlands.
[18] Ritter, F., Schubert, G., Geyer, P., Boorman, A., Petzold, F. (2014). Design decision support. Real-time Energy Simulation in the Early Design Stages in Proceeding of Computing in Civil and Building Engineering, pp. 2023-231. https://doi.org/10.1061/9780784413616.251
[19] Yilmaz, Y. (2009). Application of artificial neural network (ANN) method exergy analysis of thermodyamics. In Preceding of International Symposium on Heat Transfer in Gas Turbine Systems, pp. 13-15.
[20] Chaowen, H., Dong, W. (2015). Prediction on hourly cooling load of buildings based on neural networks. International Journal of Smart Home, l9(2): 35-52. https://doi.org/10.14257.9.2.04
[21] Moon, J., Chang, J., Kim, S. (2013). Determining adaptability performance of artificial neural network-based thermal control logics for envelope conditions in residential buildings. Energies, 6: 3548-3570. https://doi.org/10.3390/en6073548
[22] Naveen, S., Manish, K., Rajesh, K. (2012). Application of artificial neural network in solar thermal systems: A review proceeding of national conference on trends and advances in mechanical engineering. YMCA University of Science and Technology, Faridabad Haryana.
[23] Moon, J., Lee, J., D-Chang, J., Kim, S. (2013). Determining adaptability performance of artificial neural network-based thermal control logics for envelope conditions in residential buildings. Energies, 6: 3548-3570.
[24] Kumar, R., Aggarwal, R., Sharma, J., Pathania, S. (2012). Predicting energy requirement for cooling the building using artificial neural network. Journal of Technology Innovations in Renewable Energy, 1: 113-121.
[25] Suraya, G. (2015). Prediction of indoor environmental parameters for naturally ventilated building using artificial neural network: A reflection of outdoor parameter. Universiti Tun Hussein Onn Malaysia. Faculty of Civil and Environmental Engineering.
[26] Kemajou, A., Mba, L., Meukem, P. (2012). Application of artificial neural network for predicting the indoor air temperature in modern building in humid region. British Journal of Applied Science and Technology, 2(1): 23-24.
[27] Agarwal, S. (2013). Artificial neural networks for predicting cooling load in buildings in tropical countries. International Institute of Information Technology, Hyderabad.
[28] Shahryari, Z., Sharifi, A., Mohebbi, A. (2013). A: artificial neural network (ANN) approach for modeling and formulation of phenol adsorption onto activated carbon. Journal of Engineering Thermophysics, 22(4): 322-336.
[29] Batra, D. (2014). Comparison between leverberg-marquardt and scaled conjugate gradient training algorithms for image compression using MLP. International Journal of Image Processing(IJIP). 8(6): 412-422.