Mohamed Rezki
OPEN ACCESS
The main target of this paper is to investigate physiological signals that can interpret the existence of a lie, obtained from biomedical instrumentation and subsequently proposes a personal polygraph (a device used to detect lies according to the physiological changes). After exposing a subject to a series of critical questions, we measured some human physiological signals according to their responses. A statistical study about lies in order to detect the main differences between the two classes (men and women) is done. This approach based on experimentation can be considered as a pre-classification stage which allows on the one hand extracting the main features (discriminating characteristics) and on the other hand the designs of a smart automated device for detecting lie. Despite the fact that polygraph has so many advantages, it is not 100 % safe and it’s still in the development stage.
physiological changes, biomedical signals, polygraph, lie detection, GSR, correlation
To humanize police practice and ensure a certain dignity to the suspects, in light of the fact that the suspect remains innocent until proven otherwise, scientists have intervened to give help in this sense and why not to automate questionnaires in the near future [1-3]. Electronic engineering is trying to find solutions to this problem by applying methods of acquiring and analyzing biosignals and by developing biomedical equipment called polygraph [4-6]. We can declare that the first polygraph was invented in 1921 by John Augustus Larson [7].
First of all, what is a lie? The lie is a false statement contrary to the truth, or in another form, the concealment of the truth. It can be accompanied by visible signs such as trembling of the hands or redness of the cheeks, but in most cases, it had internal biological emotions. Hence, we have several biological signals in which the patient cannot hide. These are the main ones:
(1) Breathing: Breathing rate is defined by the ordinary alternation of inhalation movement and exhalation and abnormal respiratory system which reflects a physiological instability. Indeed, a state of rest and relaxation is characterized by a slower and superficial breathing. On the other hand, deeper breaths are generated by excitations [8].
(2) Cardiac frequency: Heart rate is a measure that reflects the emotions or the beats of the human heart. It accelerates when he/she gets an emotional shock. This might be a lie indicator. Remember that the heart rate is the number of heart beats per minute [9].
(3) Systolic blood pressure: Blood pressure is a measure of blood flow through the body. Normally, during stress we feel a contraction of the entire body. Since it is a contraction and not relaxation, we have chosen the systolic pressure as an indicator rather than the diastolic one.
(4) Skin electrical conductance: It is a measure that determines the levels of electrical skin conductance. The change of the conductance is essentially from sweating which increases with stress. The galvanic skin response (skin conductance or resistance) is one of the most robust technologies in the field of psychoanalysis and cognitive area [10].
(5) The method of magnetic resonance imaging (MRI): Researchers have attempted to use MRI [11, 12] as a lie detector which was based on a method called cognitive subtraction. The principle of this technique relies on the fact that if a person is telling the truth, some parts of the brain are activated, whereas if he or she lies, the active areas of the brain will not be the same. By comparing brain image of several people who lies, it would be possible to identify the brain areas involved and to establish criteria to determine the common features of the liars mind.
The problem may arise in the question of what is the most significant parameter in detecting lies and is there any difference in reaction between the female and male face to annoying questions. To solve this problem, this paper establishes an approach based on experimentation by asking some simple questions to different individuals from the two genders and analyse their responses. The findings shed quick answer to the different assumptions.
The remainder of this paper is organized as follows: Section 2 describes the protocol of the experiments and the necessary steps followed to reach the goal of exposing the technical way to detect the lie. The experimental results and discussion with validation (extension study) are exposed in section 3. Finally, section-4 concludes the paper and gives some recommendations for future studies.
2.1 Experimental
The work's experiment is based on a questionnaire which was imposed on different participants; their responses analyzed by our technological platform gave us the lie detection. Then, we followed the proposed circuit to detect a lie and a statistical evaluation to decide the reaction of the two genders (men and women) facing a polygraph. The following algorithm shown in the Figure 1 explains the experimental procedures.
During all our experiments, we used the following series of questions:
Question 1: Are you a man?
Question 2: Are you a serious man/woman? (The question is just a warm up for the questionnaire and for making the participants more comfortable).
Question 3: Someone claims that you have cheated on an exam?
Question 4: Do you really hate your parents?
Question 5: Do you have any respect for the seriousness of the workers?
For this study we took a nasal reusable Airflow Sensor linked to a data acquisition board "Arduino [13]". Its position scheme is as follows (Figure 2):
2.3 Cardiac frequency and Systolic blood pressure
An electronic measuring instrument “systolic blood pressure” with an internal cardiotachometer was used. This device is “OMRON M3” which is a clinically validated instrument [14]. The Figure 3 shows the mentioned device:
Figure 2. Nasal Airflow Sensor position scheme
Figure 3. Electronic blood pressure monitor for measuring blood pressure and heart rate [14]
2.4 Skin electrical conductance
“Galvanic skin sensor: GSR” have two removable electrodes when connected to “Arduino card” (illustrated in Figure 4). A low voltage passes through the electrodes, usually attached to two fingers in order to establish an electric circuit in which the person becomes the variable resistor. This process allows measuring the change in conductivity in real time since it is the inverse of the resistance. The conductivity of the skin is measured in micro Siemens.
Figure 4. Galvanic skin sensor
To enrich our study, we analyzed statistically the results of the GSR technique. After taken the first case, i.e. the event that the volunteers have answered the questions with a positive response (Yes). We applied the statistical method to two groups (men and women) in order to detect the differences between the two categories and exported the signals of GSR to Matlab software and run the density tool.
Calculation of Pearson’s correlation: In order to know with accuracy the dependence (correlation) of lie’s parameter between the two categories (men and women) and confirm the results, we have calculated the linear correlation called Pearson’s correlation coefficient “r” which has the following formula:
$r=\frac{\sum_{i=1}^{n}\left(x_{i}-\overline{x}\right)\left(y_{i}-\overline{y}\right)}{\sqrt{\sum_{i=1}^{n}\left(x_{i}-\overline{x}\right)^{2}} \sqrt{\sum_{i=1}^{n}\left(y_{i}-\overline{y}\right)^{2}}}$ (1)
Thus: the variable “x” is the conductance of skin (technique GSR) for men and “y” is the conductance for women.
3.1 Referential study
(1) Breathing
This experiment takes a long period, and the first question “Are you a man?” was chosen via which the curve shown in the Figure 5 was obtained.
Figure 5. Breathing result of a patient (before and after lie)
From the Figure 5, it can be seen that the changes caused by lie does not appear very well. The figure indicates marginally that when the patient lies, he breathed out more gas during his breath. To better determine that there's a lie or not, further experiment was carried out such as experiments of conduction.
(2) Cardiac frequency and Systolic blood pressure
1) Cardiac frequency
A- Answers to the truth: (see Table 1)
Table 1. Cardiac frequency obtained for truth answers
|
Serial Question number |
1 |
2 |
3 |
4 |
5 |
|
Cardiac Frequency (Pulse or F.C: BPM) |
77 |
80 |
74 |
74 |
74 |
The average of cardiac frequency when the participant finishes with answers to the truth is statically about 75.8 BPM.
B- Answers to the lie: (see Table 2)
Table 2. Cardiac frequency obtained for lie answers
|
Serial Question number |
1 |
2 |
3 |
4 |
5 |
|
Cardiac Frequency (Pulse or F.C: BPM) |
70 |
71 |
67 |
76 |
75 |
The average of the cardiac frequency when the patient lies is about 71.8 BPM.
We can clearly observe from these tables that when the patient lies, his cardiac frequency falls.
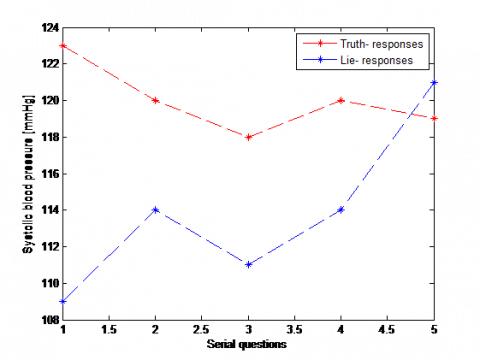
2) Systolic blood pressure
By doing this experiment, we get the following curve (Figure 6):
Figure 6. Systolic blood pressure (truth and lie responses)
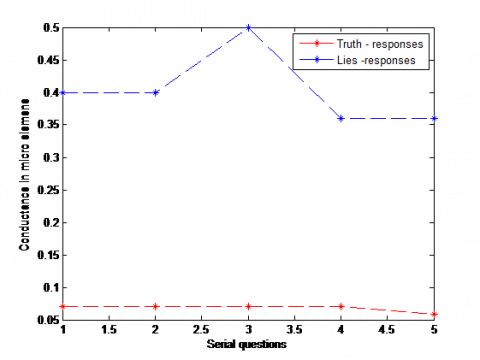
(3) Skin electrical conductance (Galvanic Skin Response: GSR)
Also, by using the data acquisition board "Arduino", we had this graph (Figure 7):
Figure 7. Skin conductance (truth and lie responses)
It can be seen from the Figure 7 above that this experiment of conductance has the best indication of lies and can be shown as a change in level; one can see that the conductance increases when the participant is lying. From this figure, we can see nearly a similar change when the participant is telling the truth. Just for the first question, the patient was stressed because he did not expect such questions. When the patient lies, it is seen that the systolic pressure decreases and undergoes strong changes.
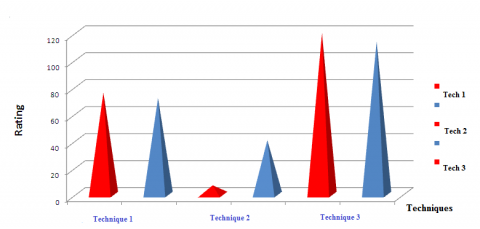
3.2 General discussion
By exploring many techniques, we needed to know the best one of them in order to consider it the main tool for detecting a lie. In this study, three major techniques were used: cardiac frequency (Tech 1), GSR technique (Tech 2) and systolic blood pressure (Tech 3).
We draw a heterogeneous graph (see figure 8) regrouping all these three techniques by their middling and always having the same indexation – red color for class of truth and blue for a class of lie-. Our aim is to see the difference between the two classes in the same technique. As an additional remark, the values of technique 2 had been multiplied by 100 in order to make them appear in the same graph with the other methods.
Figure 8. Graphical comparison between lie techniques (the red color for truth responses and the blue one is for false responses)
From Figure 8 we can easily detect the best technique for detecting lie, which in our case is the skin conductance or GSR technique, the difference is clear between the lie and truth classes.
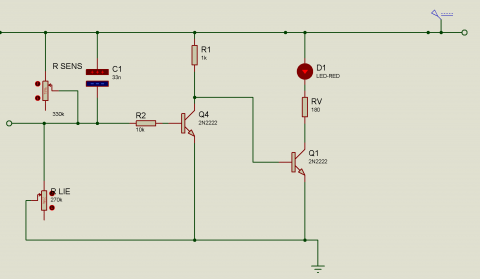
(1) Proposed circuit for detecting Lie
To realize our own circuit for detecting a lie, we used the best technique as demonstrated in this study, which is the Galvanic Skin Response by designing the following circuit (Figure 9):
Figure 9. Scheme of the proposal circuit
With RLIE representing the resistance of the skin (resistance of the two experimental dry electrodes) and RSENS is the resistance used to adjust the sensitivity of the circuit. The patient, by lying causes a decrease in its resistance (RLIE) which makes the light emitting diode (LED) to light indicating a lie.
(2) Extension of study “Generalization”
To confirm further the hypothesis by using the galvanic skin conductance as the best technique and explore other parts of this study, we extended our study to other volunteers (05 male students “men” and 05 female students “women”) with the same question. We obtained the following results:
Figure 10. Generalization of graphical comparison for women
Accordingly, we have recall for this generalization that we have chosen these techniques: systolic blood pressure (Tech 1), cardiac frequency (Tech 2) and GSR technique (Tech 3) and thus, we change the order of techniques in order to make a difference between the two Figures (10 &11) and see the change on the right side. We also mention that the values of skin conductance for women were lower than that of men. The question which destabilizes individuals and gave us good results is the question 4, which speaks about parent’s love.
Figure 11. Generalization of graphical comparison for men
As a result, we find out from the Figures (10 &11) that the GSR technique is still the best (especially for the men where the percentage of lie is higher than the truth).
We can explain the difference of GSR results between men and women by the nature of the questions (for example, are you a man?).
For more proof, we used a statistical method as described in the section of material and method. After running Matlab software, we obtained these results:
(a)
(b)
Figure 12. Density of GSR signal: a) Case of men, b) case of women
From Figure 12, it is seen that the signal energy describing the GSR data values is lower for the women compare to men.
Another discovery is that, if someone notices the density values are scattered and lower for men than women, this will prove that men take all the questions into consideration.
To demonstrate this finding, we have statistically derived the values from the responses of the two categories (men and women). The result was as follows:
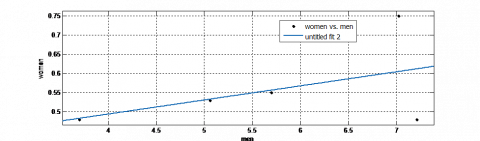
Figure 13. Distribution of values (regression line) - women versus men
We see that from the first easy questions (1 & 2), the divergence begins to increase. This is further evidence that the two categories do not give the same importance to the given questions.
By calculating the linear correlation from the Pearson’s formula (equation 1, “material and method” section), we obtained: r=+0.47. Hence, this coefficient is lower than 0.7 and it’s positive (Figure 14). This indicates that we have a positive correlation, so the relationship between our variables is weak. Simply there's a proportional relationship between the two categories (they lie together) but each one in a different way (there is no strong link between the two categories).
Figure 14. Correlation scale
In this study, a lie detector (polygraph) which is an instrument that observes the physiological changes when the person is lying was experimented by checking several methods. These latter’s allow us to judge whether the person is lying or not. We explored the most common instruments and techniques in a polygraph (systolic blood pressure, heart rate, breathing and GSR). The main satisfactory technique to detect a lie is the conductance of the skin (GSR’s technique), which has been clearly demonstrated in this paper. We have also simulated the latter i.e. GSR as our personal lie detector had convincing results. By making a statistical analysis when we generalized our study on women and men, we discovered that there is a divergence between the two categories not only from the standpoint but also from their sensitivity to questions.
As further work it will be necessary to determine accurate numerical thresholds for different biological signals to differentiate truth from a lie. The difficulty will be resided on the threshold which varies from person to person and also depends on many factors. Another recommendation is to do a correlation work between the different methods mentioned in this paper in order to increase the probability of detection of lie which will result in an increase of the accuracy.
The author takes advantage of this opportunity to express his gratitude to everyone who helped him throughout this project more than ever his students for the questionnaire.
[1] Srivastava, N., Dubey, S. (2015). Lie detector: Measure physiological values. International Frontier Science Letters, 4: 1-6. https://doi.org/10.18052/www.scipress.com/IFSL.4.1
[2] Manda, R.K. (2016). Pattern variation method with modified weights to detect lie using artificial neural network (PVMMWANN). AMSE JOURNALS-2016-Series: Modelling C, 77: 41-52.
[3] Ravikanth, R. (2009). Police must upgrade their technology. http://www.thehindu.com/todays-paper/tp-features/tp-educationplus/police-must-upgrade-their-technology/article662461.ece, accessed on May 1 2019.
[4] Iacono, W.G. (2008). Accuracy of polygraph techniques: Problems using confessions to determine ground truth. Physiology & Behavior, 95(1-2): 24-26. https://doi.org/10.1016/j.physbeh.2008.06.001
[5] Honts, C.R., Reavy, R. (2015). The comparison question polygraph test: A contrast of methods and scoring. Physiology & Behavior, 143: 15-26. http://dx.doi.org/10.1016/j.physbeh.2015.02.028
[6] Kazi, S.S., Harne, B.P. (2015). A review on statistical signal processing of EEG signals for lie detection. IJAREEIE Journal, 4(4): 2661-2665. http://dx.doi.org/10.15662/ijareeie.2015.0404116
[7] Marston, W.M. (2009). Polygraph/lie detector FAQs. International League of Polygraph Examiners: http://www.theilpe.com/faq_eng.html
[8] Abdat, F. (2010). Reconnaissance automatique des émotions par données multimodales: expressions faciales et signaux physiologiques. French theses Web. http://www.theses.fr/2010METZ035S
[9] Appelhans, B.M., Luecken, L.J. (2006). Heart rate variability as an index of regulated emotional responding. Review of General Psychology, 10(3): 229-240. http://dx.doi.org/10.1037/1089-2680.10.3.229
[10] Walczyk, J.J., Harris, L.L., Duck, T.K., Mulay, D. (2014). A social-cognitive framework for understanding serious lies: Activation-decision-construction-action theory. New Ideas in Psychology (Elsevier), 34: 22-36. https://doi.org/10.1016/j.newideapsych.2014.03.001
[11] Sowden, S., Gordon, R.T.W., Banissy, M.J., Catmur, C., Bird, J. (2015). Transcranial current stimulation of the temporoparietal junction improves lie detection. Current Biology, 25(8): 2447-2451. https://doi.org/10.1016/j.cub.2015.08.014
[12] Nourbakhsh, N., Wang, Y., Chen, F., Calvo, R.A. (2012). Using galvanic skin response for cognitive load measurement in arithmetic and reading tasks. Proceedings of OZCHI’12. https://doi.org/10.1145/2414536.2414602
[13] Airflow Sensor (Breathing) for e-Health Platform. Cooking Hacks Web (2019). https://www.cooking-hacks.com/airflow-sensor-breathing-ehealth- medical
[14] The Omron Products website (2019). http://www.omron-healthcare.com.