Thalakola Syam Sundara Rao* | Bhanu Prakash Battula
OPEN ACCESS
From the last few years has seen an eruption in the quantity of digital data stored in electronic health records (EHR). Presently the most difficult thing in world that was facing by patients and doctors was when to join hospital. And how to start treatment for patent. If a person was sick, he wants to go which hospital and met which kind of doctor for his problem. When a doctor diagnoses a person for some decease he needs his past medical history. Previously, these medical prescriptions were written on papers. But these papers are no longer available. Presently, the better choice is Electronic health records (EHR). But EHR data is a heterogeneous in nature, in order to process heterogeneous data we use deep learning based feature extraction method, and for predation we use navie basian classifier to make prediction. Here in this paper we propose a frame work based on VAR and Skip-gram method to take features using those feature we use basian classification to predict the readmission into hospital.
electronic health record, volitional encoders, navie basian, classification, deep learning
Presently the most difficult thing in world that was facing by patients and doctors was when to join hospital. And how to start treatment for patent. If a person was sick, he wants to go which hospital and met which kind of doctor for his problem. When a doctor diagnoses a person for some decease he needs his past medical history. Previously, these medical prescriptions were written on papers. But these papers are no longer available. Presently, the better choice is Electronic health records (EHR) [1]. At present, all the hospitals are maintained these kinds of data. But medical data or EHR data is not a simple data. It involves all kids of complexities like lab reports in image or text format, doctor prescription was hand-written, some diagnosis results were in numerical format. When a person has illness was repeated means he needs to readmit.
A hospital readmission [2] is characterized as admission to a doctor's facility inside a predetermined time allotment after a unique affirmation. Distinctive time allotments, for example, 30-day, 90-day, and 1-year readmissions have been utilized for research purposes. Readmission may happen for arranged or impromptu reasons, and at indistinguishable doctor's facility from unique or confirmation at an alternate one. Readmission expectation is critical for two reasons: quality and cost of social insurance. High readmission rate reflects moderately low quality and furthermore has negative social effects on the patients and on the healing facility. Almost 20 percent of doctor's facility patients are readmitted inside 30 days of release, a \$35 billion issue for the two patients and the human services framework. Avoidable readmissions represent around $17 billion per year. Therefore, readmission is winding up more critical as a marker for assessing the general human services adequacy. Recognizing patients at high hazard for readmission ahead of schedule amid hospitalization [3] may help endeavors in lessening readmissions. It is huge to foresee readmission from the get-go so as to counteract it. To avert extreme readmissions, methods, for example, tolerant subsequent meet-ups and instructions have been actualized, which could be exorbitant for individual patient.
Hence, directed subsequent meet-ups that attention on patients with high dangers of readmissions are favored. This raises the interest for surveying quiet readmission dangers and therefore conveys the readmission expectation to the cutting edge of social insurance explore. Precise expectation of clinic readmission is troublesome due to its perplexing entrapments with the patients' wellbeing conditions, particularly the incessant ones. Lately, there has been some examination on doctor's facility readmission expectation from patient Electronic Health Records (EHRs) [4]. There are numerous difficulties for working with EHR, for example, its inadequacy, tumult, heterogeneity, and so on. There are some current anticipating calculations being utilized to foresee readmission [5]. Nonetheless, these calculations have a few deficiencies, making them inapplicable to our datasets and goals: They foresee patients without considering the misprediction expenses of various classifications, Time-arrangement is the basic issue, they utilize wasteful element encoding and restricted patient qualities are identified with a specific ailment [6].
A clear path for EMR [7] include encoding is to remove or make highlight vector physically. A few investigations have recommended there are clinical and statistic parameters that may build the danger of readmission [8]. Hazard variables may differ contingent upon the interim among release and readmission. An accomplice learn at a solitary establishment found that chance elements for early readmissions (inside multi week after release) were to some degree not the same as hazard factors for later readmissions (somewhere in the range of 8 and 30 days after discharge).Clinical factors incorporate the accompanying: Use of high-chance drug Demographic [9] and strategic elements include: Prior hospitalization, regularly including spontaneous hospitalizations inside the last 6 to a year, Black race, Low wellbeing education, Reduced interpersonal organization markers, Lower financial status, Discharge against therapeutic counsel. So as to understand the difficulties, we look for profound learning models to perform readmission expectations [10].In this paper we propose a 2 stage highlight extraction strategy to foresee emergency clinic re-affirmation for to diminish the hazard. The remainder of the paper is composed as pursues segment 2 portrays condition of-workmanship, segment 3 presents proposed outline work, area 4 depicts outcomes segment lastly segment 5 closes the paper.
Davis [7]: Chronic illnesses have been among the significant worries in therapeutic fields since they may cause an overwhelming weight on social insurance assets and aggravate the personal satisfaction. In this paper, we propose a novel system for early appraisal on interminable ailments by mining consecutive hazard designs with time interim data from symptomatic clinical records utilizing successive guidelines mining, and arrangement displaying methods. With an entire work process, the proposed structure comprises of four stages to be specific information pre-processing, hazard design mining, order displaying, and post investigation. For empirical assessment, we show the viability of our proposed structure with a contextual investigation on early appraisal of COPD.
Reis et al. [8]: Leptospirosis is a possibly dangerous ailment basically influencing low-salary populaces, with an expected yearly frequency of 1.03 million contaminations around the world. This illness has indications regularly mistaken for other febrile disorders, for example, dengue fever, flu and viral hepatitis, frequently making conclusion testing. Enhancing the precision of early determination of patients with leptospirosis will expand the speed of suitable anti-microbial treatment conveyance, and both will enhance clinical results for this conceivably lethal infection.
Demiris et al. [9]: Recent advances in remote sensor systems for pervasive wellbeing and movement checking frameworks have set off the likelihood of tending to human needs in shrewd situations through perceiving human real-time exercises. While the idea of streams in such systems requires productive acknowledgment strategies, it is likewise subject to suspicious surmising based protection assaults. In this paper, we propose a structure that effectively perceives human exercises in keen homes dependent on spatiotemporal mining procedure. Also, we propose a procedure to upgrade the protection of the gathered human detected exercises utilizing a changed rendition of smaller scale total methodology.
Fernald et al. [10]: Rapid advances of high throughput innovations and wide appropriation ofelectronic wellbeing records (EHRs) have prompted quick collection of - omic and EHR information. These voluminous complex information contain bounteous data for accuracy medication, and huge information investigation can concentrate such learning to enhance the nature of social insurance. Strategies: In this paper, we present – omic and EHR information qualities, related difficulties, and information investigation including information pre-processing, mining, and displaying. Results: To show how enormous information examination empowers accuracy medication, we give two contextual investigations, including distinguishing sickness biomarkers from multi-omic information and joining - omic data into EHR. End: Big information investigation can address - omic and EHR information challenges for change in outlook toward exactness prescription. Criticalness: Big information examination comprehends - omic and EHR information to enhance medicinal services result. It has dependable societal effect.
Sun et al. [11] Ambient-helped living (AAL) is promising to wind up an enhancement of the present consideration models, giving improved living background to individuals inside setting mindful homes and brilliant conditions. Action acknowledgment dependent on tactile information in AAL frameworks is a critical undertaking since 1) it tends to be utilized for estimation of dimensions of physical action, 2) it can prompt identifying changes of every day designs that may show a rising medicinal condition, or 3) it tends to be utilized for identification of mishaps and crises. To be acknowledged, AAL frameworks must be moderate while giving dependable execution. These two factors colossally rely upon enhancing the quantity of used sensors and extricating powerful highlights from them.
This paper proposes a nonexclusive element building technique for choosing strong highlights from an assortment of sensors, which can be utilized for creating dependable grouping models. From the initially recorded time arrangement and some recently produced time arrangement [11] [i.e., sizes, first subsidiaries, delta arrangement, and quick Fourier change (FFT)- based series], an assortment of time and recurrence space highlights are removed. At that point, utilizing two-stage include choice, the quantity of produced highlights is extraordinarily diminished. At long last, unique arrangement models are prepared and assessed on a free test set.
The proposed technique was assessed on five openly accessible informational collections, and on every one of them, it yielded preferable precision over when utilizing hand-custom fitted highlights [12]. The advantages of the proposed deliberate element building strategy are rapidly finding great capabilities for some random undertaking than physically discovering ones reasonable for a specific errand, choosing a little list of capabilities that beats physically decided highlights in both execution time and exactness, and distinguishing proof of important sensor types and body areas consequently [13]. At last, the proposed technique could diminish the expense of AAL frameworks by encouraging execution of calculations on gadgets with constrained assets and by utilizing as couple of sensors as would be prudent.
Panahiazar, Maryam et al. [27] "Using EHRs and machine learning for heart failure survival analysis." built a heart failure risk prediction model using a series of machine learning techniques andobserved that logistic regression and random forest return more accurate models comparedto other classifiers.
Dernoncourt et al. [28] created a system for the automatic de-identification of clinicaltext, which replaces a traditionally laborious manual deidentification process for sharing restricted data. Their framework consists of a bidirectional LSTM network (Bi-LSTM) and both character and word-level embeddings. The authorsfound their method to be state of the art, with an ensembleapproach with conditional random fields also faring well.
3.1 Need for EHR data analytics
Previously, EHR data analysis was carried out using Data mining techniques [14]. But EHR data is the combination of structured and unstructured data, so most of the data mining methods and tools are failed to analyse the insights of the EHR records. In literature we addressed various methods which are analysis the EHR data. Most of the mechanisms does not performed well. In order to address and solve that issue in this paper we are proposed the deep learning based EHR data [15] analysis. The subsequent section will address the proposed work.
EHR contains a huge amount of data so it is necessary to store it in the proper format for further processing [16]. To extract the needed data from such large dataset is a challenge. A great deal of research is going on around there. Here component choice is the strategy used to choose suitable highlights from the dataset [17]. The inspiration driving utilizing highlight determination is general information decrease, include set decrease, execution improvement and information understanding.
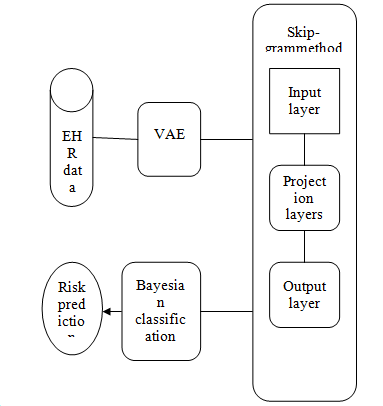
Here we use two kinds of methods because EHR data is a high dimensional data. Initially we do feature selection unstructured data for that we used VAE [18] mechanism. It does feature extraction and presented in reduced format. After that for text processing of medical records we use W2V method. And we make classification of data for to predict the risk of readmission using Naive Bayes classification [19].
Figure 1. Proposed model architecture
3.2 Feature extraction from complex bio medical data using Variational Auto encoders (VAE)
Variational Auto encoders has been developed as one of the most useful approaches to representation learning of complex data in recent years. VAE have already demonstrated promising performance in complicated data including handwritten digits, faces, house numbers, speech and physical models of scenes [20]. VAE has the structure of auto encoders including encoders, decoders and latent layer [21]. Variational auto encoders are probabilistic generative models. Assume Y is our input data and t is the latent variable, based on the total probability law we have:
P(y)=∫P(Y,t)dz=∫P(Y|t)P(z)dz (1)
VAE tries to maximize the probability of each Y in the training set according to the Eq-2 under the generative process. P(Y|t) is the probability function of the observed data given to latent variable, which means how can find the distribution of input data based on distribution of sample of latent variable [22]. The main idea in variational auto encoder is to attempt to sample values of latent variables (t) that are likely produce Y, and construct P(t|Y) from those. In this way, we need a new function P(t|Y) which can describe the distribution of z based on value of Y [23]. In the other words, t is sampled from an arbitrary distribution and R can be any distribution such as standard normal distribution and help to compute Et∼QP (Y|t). For doing that, we start to match P(t|Y) to R(t) using Kullback-Leibler divergence between P(t|Y) and R(t), for some arbitrary R:
D[R(t)∥P(t|Y)]=Et∼R[logR(t)−logP(t|Y)]) (2)
The objective function of variational auto encoders can be formulated as following which maximizes logP(Y) minus an error term:
logP(Y)−D[R(t|Y)∥P(t|Y)] (3)
We can infer P(Y) and P(Y|t) into Eq. 3 by applying Bayes rule to P(t|Y) and reformulate Eq. 4:
logP(Y)−D[R(t|Y)∥P(t|Y)]=Et∼R[logP(Y|t)]−D[R(t|Y)∥P(t|Y)] (4)
This equation known as the core of the variational auto encoder. In particular, the right hand side acts as an auto encoder, since R is encoding Y into t, and P is decoding it to reconstruct Y.
3.3 Skip-gram method ()
(1) Input layer
Since we need to see how to speak to words, words are our contribution here. In any case, we can't simply encourage a word in the string structure to a neural system [24].
The way we speak to singular words is through a special list mapping, i.e. each word has a one of a kind record. For example, in the event that we have U unmistakable words, our goal is to take in the portrayal of every one of these U words/records as some E dimensional vector [25].
We once-hot encode the word files, i.e. each word goes from being a file into a U dimensional vector of zeroes, with 1 just at the record it speaks to.
So a word in EHR information resembles "expire" is spoken to by something like: [0, 0, 1, 0, 0,.......0]1*U where the record for "perish" is 2.
(2) Projection layer
Since our vocabulary measure is U and we need to take in an E dimensional portrayal for each word in the vocabulary, the projection layer is a U*E framework.
(3) Output layer
This layer takes the yield of the Projection layer and makes a likelihood dissemination utilizing a softmax work over the U words. The learning stage tunes the projection layer so that in the end words like "When," "in," "express," and "French" have a higher likelihood than different words in U when "France" is the information [26].
After the preparation stage, the projection layer is gotten and utilized as the word embedding’s for the U words. The projection layer just turns into a query table where each ith push speaks to the embedding’s for the word with record I.
Naive Bayes classifiers [27] was popular to handle any kind of data, the data may be any kind.That is continuous or categorical. So this classifier is more advantageous in medical data classification. Here we give medical data set that is processed and the necessity features was already obtained from the deep learning based auto encoders [28].
Given a lot of information focuses, X = {x1,x2,x...,xd}, we need to build the back likelihood for the occasion Cj among a lot of conceivable results C = {c1,c2,c...,cd}. In a progressively natural language, X is the indicators and C is the arrangement of unmitigated dimensions present in the reliant variable. Utilizing Bayes' standard:
$P(Cj/x_(1, ) x_2, x_3....x_d )α π P(x_(1, ) x_2, x_3....x_d/C_J )P(C_j)$
where p (Cj | x1,x2,x...,xd) is the back likelihood of class enrollment, i.e., the likelihood that X has a place with Cj. Since Naive Bayes accept that the contingent probabilities of the free factors are measurably autonomous we can break down the probability to a result of terms:
$P(x⁄C_J )α π P(x_k⁄C_J )$
Algorithm EHR data ()
{
Input: discharge summaries from EHR data set
Output: risk prediction for readmission
Step-1: pre-processing
Step-2: apply VAE ()
Step-3: Take features from VAE and give that features to Skip gram Method
Step-4: Risk prediction
}
The proposed method takes the EHR dataas input, in that data discharge summaries are taken for processing. VAE deep learning technique is applied, for to extract features of frequent re-admitted patients. VAE takes almost 80 % of the data for training purpose and remaining 20 % for testing purpose. After getting the features set we use Skip gram Method for text feature mining from the clinical data. Those clinical outcomes are given to classifier of Navie baseynwhich classifies the patients who have more risk to be re-admitted to hospital.
(4) Data set used
Here we used MIMIC3 [17] data set, the data set contains two types of discharge summaries, one belongs to discharge notes second one is progress summary. Discharged summary having almost five hundred documents. And it contains multiple features those are Disease: 3,554; Symptom: 7,461; Treatment: 2,457; Test: 2,672; Disease Group: 151; Total: 16,295.
Second set of features are belonging to progress summaries means during the treatment what kind of things are happen was considered as progress summaries. These contains following class of attributes Disease: 4,769; Symptom: 11,479; Treatment: 2,785; Test: 4,317; Disease Group: 72; Total: 23,422.
The last highest quality level makes utilization of five classifications of named elements, in particular, ailment, side effect, treatment, test, and infection amass as for procedures of the conclusion and medicines. In the procedures, restorative staff use tests to discover side effects of infections from patients and make an indisputable determination. At that point, thinking about the analysis, they will utilize drugs also, treatment conventions, or even play out a task to treat the infections. Illness and side effect named elements allude to phrases speaking to infection and manifestation ideas, individually.
Treatment named substances include phrases that speak to tranquilize names, treatment conventions (e.g., chemotherapy what's more, radiotherapy), and medical procedures. Treatment explanation might be coarse-grained, yet it can lessen blunders in the explanation process in order to secure a top notch clarified corpus set. In the future, we will refine the explanation substance of medications. Infection amass elements are phrases that speak to the seriousness of sicknesses. In Chinese EMRs, explicit maladies, for example, hypertension)" and (diabetes)" are trailed by portrayals of the seriousness of the maladies.
For instance, there would be an expression (hypertension 3 level high-chance gathering)" in an EMR of nervous system science. In the expression, the sickness (hypertension)" is trailed by (high-chance gathering)" that is a further analyse as an unmistakable rule for medicines. These depictions can be utilized to help therapeutic stats to organize normal medications for patients. For getting these depictions consequently, phrases like (high-chance gathering)" are explained as ailment bunch elements. Subsequent to explaining the corpus, we utilized the between annotator understanding (IAA) to evaluate the dimension of assention of the two annotators since the IAA means the exactness and fulfillment of the explanation [22]. The IAA for the two specialists was 94.20 %, showing that the explanations were dependable. The marked corpus was utilized as the dataset for preparing what's more, trying the models.
4.1 Experimental setup
Here we use Intel 8 GB RAM, 500 GB HDD, as hardware. And UBUNTU OS, python3.5 with Numpy package and Tensor flow to simulate deep learning models. Here we use Panahiazar, Maryam, et al. "Using EHRs and machine learning for heart failure survival analysis." Model as existing and compare our proposed work with it.
Various evaluation metrics, namely, accuracy, micro average F (Micro), and macro-average F (MacroF) [27] were used to evaluate the performance of the medical data record data analysis procedures. Micro values are influenced by the anticipated execution of tests in the classification whose number of tests is bigger than those of different classifications. Micro [23] is calculated as
$MicroF=2×(MicroP×MicroR)÷(MicroP+MicroR)$
where: true positive(c) is the include of substance names classification c showing indistinguishable marks from highest quality level names; false positive(c) is the include of element marks perceived classification c exhibiting disparate names from highest quality level names; and false negative(c) is the check of highest quality level element names not present in the element names in the perceived classification c. MacroF values are acquired by computing the normal Fmeasure (F) estimations of anticipated examples in each class. The F values for each class are determined by precision (P) and recall (R) defined as
$P=\frac{TP}{TP+FP}$
$R=\frac{TP}{TP+FN}$
$F=\frac{2*P*R}{P+R}$
where TP is the check of substance marks introducing indistinguishable names from highest quality level names; FP is the tally of perceived element names showing unique names from best quality level names; and FN is the tally of best quality level element names not present in the perceived element names;
$MacroP=\frac{1}{N_c}\sum_{i=1}^{N_c}P_i$
$MacroR=\frac{1}{N_c}\sum_{i=1}^{N_c}R_i$
$MacroF=\frac{1}{N_c}\sum_{i=1}^{N_c}F_i$
The trial results are partitioned into four sections utilizing the MacroF, MicroF, and exactness esteems, to assess the execution of the standard techniques and our strategy. In the first place, our technique was assessed concerning perceiving diverse kinds of substances dependent on the MacroF esteems. Next, our technique and three distinctive gauge strategies were assessed by the MicroF esteems. In the third piece of the outcomes, exactness was utilized to assess the diverse techniques, in particular, our strategy and three conventional strategies. At last, we contrast our strategy and benchmark models under similar conditions. Itemized results for the strategy are appeared Table.
Table 1. F-measure comparisons on discharge and treatment notes
|
|
Discharge Summary |
Treatment Note |
||||
|
Type |
P |
R |
F |
P |
R |
F |
|
Illness |
28.74 |
63.22 |
47.14 |
71.70 |
69.5024 |
70.58 |
|
Symptom |
34.90 |
70.73 |
46.74 |
67.09 |
76.9648 |
71.67 |
|
Test |
53.88 |
74.38 |
62.50 |
68.40 |
76.0936 |
72.05 |
|
Group of Disease |
30.25 |
88.00 |
45.02 |
20.00 |
88 |
32.60 |
|
Treatment |
33.14 |
66.14 |
44.16 |
50.82 |
68.9128 |
58.50 |
|
Macro-average |
37.30 |
72.49 |
48.58 |
55.60 |
75.8824 |
61.08 |
Table 1 demonstrates the F-measures ran from 40 to 80 percent for release synopses and 63.18 % to 86.23 % for advancement notes for the five element types, with the best F-measure accomplished in perceiving test elements. The F-measure for perceiving ailment bunch elements is the most minimal, which prompts the comparing MacroP values. Since the extent of sickness assemble elements in the corpus is only 0.56 %, there are insufficient examples to prepare the relating highlight loads. The best exhibitions yield F-measures and for mining test elements from release synopses and advancement notes, separately. We looked at the MicroF esteems between the pattern strategies and our technique connected to mining therapeutic named elements from release outlines and advancement notes with the trial results detailed in Table 2. The outcomes demonstrate that the CRF-based model is better than different models. For instance, the MicroF estimations of the CRF-based strategies outflanked those of different techniques by 2.5 and 1.9 percent on release outlines and advancement notes, individually.
Table 2. Microp, micror and microf comparison of existing methods and proposed models
|
|
Discharge notes |
Progress summaries |
||||
|
Algorithm |
Micro P |
Micro R |
Micro F |
Micro P |
Micro R |
Micro F |
|
ME |
78.07 |
77.91 |
77.99 |
79.72 |
79.37 |
79.40 |
|
NB |
88.81 |
88.81 |
88.81 |
91.45 |
91.45 |
91.45 |
|
CRF |
93.15 |
93.15 |
93.15 |
94.93 |
94.92 |
94.93 |
|
Proposed model |
88.64 |
88.65 |
88.64 |
91.13 |
91.14 |
91.13 |
Table 3. Accuracy comparison of existing models and proposed models
|
Model |
Illness |
Illness Group |
Indication |
Test |
Action |
Overall |
|
NB |
34.82 |
26 |
48 |
55.96 |
51.98 |
62.12 |
|
ME |
46.32 |
30.19 |
56.34 |
66.10 |
68.80 |
66.68 |
|
CRF |
69.33 |
41.39 |
70.83 |
88.05 |
67.47 |
81.94 |
|
Proposed method |
63.80 |
39.87 |
71.76 |
81.28 |
61.14 |
70.60 |
The MicroP, MicroR, and MicroF estimations of the models dependent on ME and CRF are nearly the equivalent provided that there is just a single class relegated to each testing tests, the MicroP , MicroR, and MicroF values are dependably the equivalent if there is no mark in the preparation information that isn't in the highest quality level of the test information. In spite of the fact that the test results demonstrate the adequacy of our technique, our strategy doesn't beat the CRF based strategy. The MicroF of NER on release outlines and advancement notes of our techniques are not exactly those of CRF based model by 4 and 3 percent almost. Table 3 gives the precision correlations of existing and proposed models. It plainly demonstrates that proposed model outflanked the current models by giving more exactness rate than every other model.
Figure 2 shows the Accuracy comparison of existing model Dernoncourt et al. [28] and proposed approach. Existing approach authors use recurrent neural networks and these take most of the storage space for processing data. But in our proposed approach we use VAE and Skip-gram method which is more suitable data like medical text. So proposed work produces more accurate values than existing work. Whenever the size of data increase accuracy percentage also increased.
Figure 2. Accuracy comparison
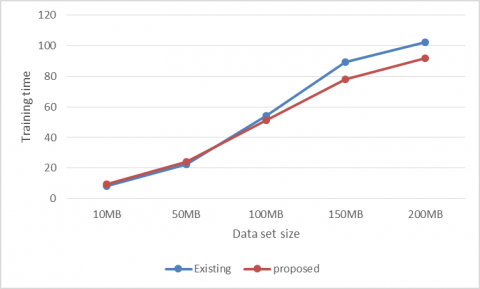
Figure 3. Training time
Figure 3 shows the training comparison of existing model Dernoncourt et al. [28] and proposed approach. Existing approach authors use recurrent neural networks and these take most of the storage space for processing data. This make lot of time for storing and get processed the data. But in our proposed approach we use VAE and Skip-gram method which is more suitable data like medical text. So proposed work produces less computation than existing work. Whenever the size of data increase computation time also increased.
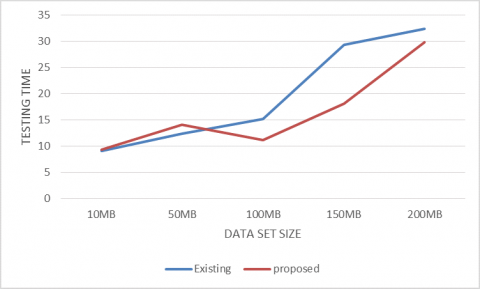
Figure 4. Testing time
Figure 4 shows the testing time comparison of existing model Dernoncourt et al. [28] and proposed approach. Existing approach authors use recurrent neural networks and these take most of the storage space for processing data. This make lot of time for storing and get processed the data. But in our proposed approach we use VAE and Skip-gram method which is more suitable data like medical text. So proposed work produces less computation than existing work. Whenever the size of data increase computation time also increased.
Electronic health records (EHR) plays very important role medical improvement. But EHR data is a heterogeneous in nature, in order to process heterogeneous data we use deep learning based feature extraction method, and for predation we use navie-basian classifier to make prediction. In this paper, we propose a frame work, an end-to-end deep learning predictive model that embeds local and global contextual information via VAE and skip gram topic model based recognition network, respectively. We evaluated the model with hospital readmission prediction task on patients. Existing work use recurrent neural network in our proposed model outperforms baseline with respect to accuracy and computation time. And can also explicitly generates interpretable subgroups to improve understanding of heterogeneous readmission risks among all features.
[1] Koh, H.C., Tan, G. (2005). Data mining application in healthcare. Journal of Healthcare Information Management, 19(2): 64-72.
[2] Kandwal, R., Garg, P.K., Garg, R.D. (2009). Health GIS and HIV/AIDS studies: Perspective and retrospective. Journal of Biomedical Informatics, 42: 748-755. https://doi.org/10/2498/cit.1001391
[3] Hand, D., Mannila, H., Smyth, P. (2001). Principles of data mining. MIT. https://doi.org/10.1007/978-1-84628-766-4
[4] Fayyad, U., Piatetsky-Shapiro, G., Smyth, P. (2017). The KDD process of extracting useful knowledge form volumes of data. Communications of the ACM, 39(11): 27-34. https://doi.org/10.1504/IJFCM.2017.089446
[5] Han, J., Kamber, M. (2006). Data mining: concepts and techniques. 2nd ed. The Morgan Kaufmann Series.
[6] Fayyad, U., Piatetsky-Shapiro, G., Smyth, P. (1996). From data mining to knowledge discovery in International Journal of Pure and Applied Mathematics Special Issue databases. Communications of the ACM, 39(11): 24-26.
[7] McGregor, C., Christina, C., Andrew, J. (2016). A process mining driven framework for clinical guideline improvement in critical care. Learning from Medical Data Streams 13th Conference on Artificial Intelligence in Medicine (LEMEDS). http://ceur-ws. org 765. https://doi.org/ 10.1504/IJIDS.2016.075789
[8] Silver, M., Sakara, T., Su, H.C., Herman, C., Dolins, S.B., O’shea, M.J. (2001). Case study: how to apply data mining techniques in a healthcare data warehouse. Journal of Healthcare Information Management Jhim, 15(2): 155-164.
[9] Rajesh, M. (2018). Get-up-and-go efficient memetic algorithm-based amalgam routing protocol. International Journal of Pure and Applied Mathematics, 116(21): 1314-3395.
[10] Manikanthan, S.V., Padmapriya, T. (2017). Recent trends in M2M communications in 4G networks and evolution towards 5G. International Journal of Pure and Applied Mathematics, 115(8): 1314-3395.
[11] Padmapriya, T., Saminadan, V. (2016). Distributed load balancing for multiuser multi-class traffic in MIMO LTE-advanced networks. Research Journal of Applied Sciences, Engineering and Technology (RJASET) - Maxwell Scientific Organization, 12(8): 813-822.
[12] Bikku, T., Nandam, S.R., Akepogu, A.R. (2017). An iterative Hadoop-based ensemble data classification model on distributed medical databases. In Proceedings of the First International Conference on Computational Intelligence and Informatics, pp. 341-351.
[13] Kudyakov, R., Bowen, J., Ewen, E., West, S.L., Daoud, Y., Fleming, N., Masica, A. (2012). Electronic health record use to classify subjects with newly diagnosed versus preexisting type 2 diabetes: Infrastructure for comparative effectiveness research and population health management. Population Health Management, 15(1): 3-11. https://doi.org/10.1089/pop.2010.0084
[14] Bikku, T. (2018). A new weighted based frequent and infrequent pattern mining method on Realtime E-commerce. Ingenierie des Systemes d'Information, 23(5): 121. https://doi.org/10.3166/isi.23.5.121-138
[15] Gopi, A.P., Vejendla, L.N. (2017). Protected strength approach for image steganography. Traitement du Signal, 35(3-4): 175-181. https://doi.org/10.3166/ts.34.175-181
[16] Vejendla, L.N., Gopi, A.P. (2017). Visual cryptography for gray scale images with enhanced security mechanisms. Traitement du Signal, 35(3-4): 197-208. https://doi.org/10.3166/ts.34.197-208
[17] Chen, Y., Li, Y., Cheng, X.Q., Guo, L. (2006). Survey and taxonomy of feature selection algorithms in intrusion detection system. Conference on Information Security and Cryptology, LNCS4318 153-167.
[18] Vejendla, L.N., Gopi, A.P., Kumar, N.A. (2018). Different techniques for hiding the text information using text steganography techniques: A survey. Ingénierie des Systèmes d'Information, 23(6): 115-125. https://doi.org/10.3166/isi.23.6.115-125
[19] Gopi, A.P., Vejendla, L.N., Kumar, N.A. (2018). Dynamic load balancing for client server assignment in distributed system using genetical gorithm. Ingénierie des Systèmes d'Information, 23(6): 87-98. https://doi.org/10.3166/isi.23.6.87-98
[20] Dreiseitl, S., Machado, L.O. (2002). Logistic regression and artificial neural network classification models: A methodology review. Journal of Biomedical Information, 35(5-6): 352-359. https://doi.org/10.1016/S1532-0464(03)00034-0
[21] Lustgarten, J.L., Gopalakrishnan, V., Grover, H., Visweswaran, S. (2008). Improving classification performance with discretization on biomedical datasets. AMIA Annual Symposium Proceedings, 44: 445-449.
[22] Hua, J., Xiong, Z., Lowey, J., Suh, E., Dougherty, E.R. (2005) Optimal number of features as a function of sample size for various classification rules. Bioinformatics, 21(8): 1509-1515. https://doi.org/10.1093/bioinformatics/bti171
[23] Collins, F.S., Varmus, H. (2015). A new initiative on precision medicine. The New England journal of medicine, 372: 793-795. https://doi.org/10.1056/NEJMp1500523
[24] Voight, B.F., Scott, L.J., Steinthorsdottir, V., Morris, A.P., Dina, C., Welch, R.P., Zeggini, E., Huth, C., Aulchenko, Y.S., Thorleifsson, G., McCulloch, L.J., Ferreira, T., Grallert, H., Amin, N., Wu, G., Willer, C.J., Raychaudhuri, S., McCarroll, S.A., Langenberg, C., Hofmann, O.M., Dupuis, J., Qi, L., Segrè, A.V., van Hoek, M., Navarro, P., Ardlie, K., Balkau, B., Benediktsson, R., Bennett, A.J., Blagieva, R., Boerwinkle, E., Bonnycastle, L.L., Bengtsson Boström, K., Bravenboer, B., Bumpstead, S., Burtt, N.P., Charpentier, G., Chines, P.S., Cornelis, M., Couper, D.J., Crawford, G., Doney, A.S., Elliott, K.S., Elliott, A.L., Erdos, M.R., Fox, C.S., Franklin, C.S., Ganser, M., Gieger, C., Grarup, N., Green, T., Griffin, S., Groves, C.J., Guiducci, C., Hadjadj, S., Hassanali, N., Herder, C., Isomaa, B., Jackson, A.U., Johnson, P.R., Jørgensen, T., Kao, W.H., Klopp, N., Kong, A., Kraft, P., Kuusisto, J., Lauritzen, T., Li, M., Lieverse, A., Lindgren, C.M., Lyssenko, V., Marre, M., Meitinger, T., Midthjell, K., Morken, M.A., Narisu, N., Nilsson, P., Owen, K.R., Payne, F., Perry, J.R., Petersen, A.K., Platou, C., Proença, C., Prokopenko, I., Rathmann, W., Rayner, N.W., Robertson, N.R., Rocheleau, G., Roden, M., Sampson, M.J., Saxena, R., Shields, B.M., Shrader, P., Sigurdsson, G., Sparsø, T., Strassburger, K., Stringham, H.M., Sun, Q., Swift, A.J., Thorand, B., Tichet, J., Tuomi, T., van Dam, R.M., van Haeften, T.W., van Herpt, T., van Vliet-Ostaptchouk, J.V., Walters, G.B., Weedon, M.N., Wijmenga, C., Witteman, J., Bergman, R.N., Cauchi, S., Collins, F.S., Gloyn, A.L., Gyllensten, U., Hansen, T., Hide, W.A., Hitman, G.A, Hofman, A., Hunter, D.J., Hveem, K., Laakso, M., Mohlke, K.L., Morris, A.D., Palmer, C.N., Pramstaller, P.P., Rudan, I., Sijbrands, E., Stein, L.D., Tuomilehto, J., Uitterlinden, A., Walker, M., Wareham, N.J., Watanabe, R.M., Abecasis, G.R., Boehm, B.O., Campbell, H., Daly, M.J., Hattersley, A.T., Hu, F.B., Meigs, J.B., Pankow, J.S., Pedersen, O., Wichmann, H.E., Barroso, I., Florez, J.C., Frayling, T.M., Groop, L., Sladek, R., Thorsteinsdottir, U., Wilson, J.F., Illig, T., Froguel, P., van Duijn, C.M., Stefansson, K., Altshuler, D., Boehnke, M., McCarthy, M.I. (2010). Twelve type 2 diabetes susceptibility loci identified through large-scale association analysis. Nature Genetics, 42(7): 579-589. https://doi.org/10.1038/ng.609
[25] Billings, L.K., Florez, J.C. (2010). The genetics of type 2 diabetes: What have we learned from GWAS? Annals of the New York Academy Sciences, 1212(1): 59-77. https://doi.org/10.1111/j.1749-6632.2010.05838.x
[26] Denny, J.C., Bastarache, L., Ritchie, M.D., Carroll, R.J., Zink, R., Mosley, J.D., Field, J.R., Pulley, J.M., Ramirez, A.H., Bowton, E., Basford, M.A., Carrell, D.S., Peissig, P.L., Kho, A.N., Pacheco, J.A., Rasmussen, L.V., Crosslin, D.R., Crane, P.K., Pathak, J., Bielinski, S.J., Pendergrass, S.A., Xu, H., Hindorff, L.A., Li, R., Manolio, T.A., Chute, C.G., Chisholm, R.L., Larson, E.B., Jarvik, G.P., Brilliant, M.H., McCarty, C.A., Kullo, I.J., Haines, J.L., Crawford, D.C., Masys, D.R., Roden, D.M. (2013). Systematic comparison of phenome-wide association study of electronic medical record data and genome-wide association study data. Natural Biotechnology, 31(12): 1102-1111. https://doi.org/10.1038/nbt.2749
[27] Panahiazar, M., Taslimitehrani, V., Pereira, N., Pathak, J. (2015). Using EHRs and machine learning for heart failure survival analysis. Studies in Health Technology and Informatics, 216: 40-44.
[28] Dernoncourt, F., Lee, J.Y., Uzuner, O., Szolovits, P. (2015). De-identificationof Patient Notes with Recurrent Neural Networks. arXiv