Sharmin Sultana Shanta* | Md. Haider Ali Biswas
© 2020 IIETA. This article is published by IIETA and is licensed under the CC BY 4.0 license (http://creativecommons.org/licenses/by/4.0/).
OPEN ACCESS
A general model based on SIR type has been developed and analyzed in this paper by incorporating a control variable function termed as media awareness. The study emphasizes that consciousness grows among general population due to media awareness which results in isolating a portion of susceptible population from the infected ones. The model exhibits two equilibrium points and the stability of these equilibrium points has been investigated. Numerical simulations have been carried out based on a specific set of parameters to study the effects of applied control. The findings of this analysis reveal that continuous publicity of awareness programs is very effective and significant in preventing the disease transmission whereas the news, collected by media during a disease period, also plays a compassionate role in reducing the size of infectious population. The results of the present analysis also expose that the reproduction number, epidemiologically a certain threshold, is influenced by the transmission and recovery rates. Our study suggests that in absence of effective antivirals or vaccines, media awareness may be one of the supportive interventions for mitigating and controlling the disease burden during any pandemic or epidemic situation.
infectious disease, mathematical model, basic reproduction number, media awareness
Infectious diseases, caused by microorganisms (viruses, fungi, bacteria, parasites and arthropods) which are pathogenic, are very detrimental and life threatening to human health since such diseases can spread indirectly or directly from individuals to individuals, may transmit from contaminated water and food or from animals (zoonotic) or insects [1]. Although the symptoms and signs of infectious diseases may vary or depend on specific types, general indications such as fever, coughing, muscle aches, runny nose, rashes, fatigue and diarrhea are very common for most of the diseases. Diagnosis of contagious diseases, that mainly identifies infectious agents, is done by microbial cultures, microscopy, PCR diagnostics, biochemical test, metagenomic sequence and symptomatic diagnostics [2]. Some of the common infectious diseases are AIDS, Tuberculosis, Hepatitis B, Measles, Chickenpox, Ebola, Influenza, Malaria, Dengue, Chikungunya, Nipah virus infection, MERS, SARS etc. [3]. Recently Coronavirus Disease (COVID-19), caused by a new virus: primarily named as 2019-nCoV; later known as SARS-CoV-2, has been declared as a worldwide pandemic which was initially identified at the city of Wuhan in China on December 31, 2019 when severe pneumonia cases with unidentified explanations were confirmed among a group of individuals and within June 23, 2020, around nine million infective cases with above 469,587 deaths have been confirmed worldwide due to COVID-19 [4]. To slow down or prevent the spread of critical diseases, several characteristics related to the diseases are needed to be understood and recognized [5]. Mathematical modelling in this regard may help predict the forthcoming growth characteristics, project the progress of the disease and choose which interventions should be used as a trial or avoided. Models are typically formulated by considering simple assumptions with specific parameters which are meant for certain diseases and the theoretical methods are applied to understand the special effects of designed interventions, for example, vaccination program [6].
A model on HIV epidemic presented the effects of timely treatment and predicted that early treatment is worthy enough to increase the immunity and considerably lessen new transmissions [7] whereas another work based on testing and treatment revealed that HIV new infections may be minimized to 69.1% within twenty years [8].
A study showed that testing and treatment have the potentiality in minimizing the HIV prevalence to below 1% in next 50 years [9]. A paper focusing on the important issues regarding AIDS epidemic and MDG 2015 investigated that any effective vaccine is necessary since approximately 7400 individuals become infected daily due to HIV. It also presented that the vaccine RV144 was 31% successful during 2009 in preventing HIV infection [10].
A model on tuberculosis established that the disease may be controlled when the efficacy of treatment and vaccination reaches to a convinced threshold [11] and this model was extended later with control schemes so that the intercession cost and the infection burden can be minimized [12]. Another study [13] presented that a particular vaccine which can function both as pre and post exposure is essential to attain the universal control over the deadly TB.
A model representing the influence of reinfection and relapse for Ebola dynamics exposed that the new infective cases will decrease with high level control interventions [14] while another study emphasized that education, quarantine and tracing can significantly decrease the total dimension of Ebola epidemic [15].
An analysis highlighted that Nipah virus infection (NiV) is possible to reduce quickly if quarantined cases are maximized and safety hygiene is maintained [16]. Based on the propagation of NiV [17], it has been anticipated that social distancing and mass awareness may be effective in controlling the situation of NiV [18].
Some works on the dynamics of Dengue [19], Chikungunya [20], Influenza [21], Measles [22], Hepatitis B [23] etc. similarly represent the applications of modelling, from where important insights and strategies were seen to be developed which are sufficiently needed for controlling the spread.
Media as a form of social communication facilitates people by not only sharing information but also providing data to the health administrators during any outbreak situation so that forecasting of the outbreaks can be made possible [24]. A study emphasized that education and media, in Bangladesh, have significance in preventing married people from the deadly HIV. The study also found that the couples who watch television regularly are nearly 8.6 times conscious about HIV than those of who do not watch television [25]. It has been understood that the effects of information transfer play an important role in minimizing the risk of infection [26] while the flow of awareness has the potentiality to decrease the percentage of diseased population [27]. The reports made by mass media for the general public during a pandemic or an epidemic deliver significant information which encourage people to practice healthy and positive behaviors such as maintaining social distance, hand washing etc. These positive practices can reduce the possibility of disease transmission [28]. Activities performed by the media have already shown the potentiality in predicting the evolution and development of infectious diseases. As a result, it is now possible to detect and easily analyze several disease behaviors [29]. Media coverage and its impact on contagious diseases have been explored and investigated through a model by using variable contact rate [30]. Another analysis based on SIS model (which actually motivated us to do this work) focused that awareness campaigns can effectively control the transmission of a spreadable disease but for continuous immigration, the disease may be endemic [31].
In this paper, we introduce a general model, which is based on SIR type [32], to study the possible control and preventive strategy, more specifically, the impact of media awareness programs during the period of any pandemic or epidemic from a common point of view. The purpose of this paper is to analyze the properties of the model, investigate the effects of the publicity rate of awareness programs and the news collection rate which function for making people conscious about the harmful consequences of short or long term infectious diseases.
In Section 2, the framework of the model has been represented whereas the analytical part of the model has been discussed in Section 3. Numerical results are shown graphically in Section 4. Finally, the overall summary with findings is discussed in Section 5.
The common SIR model deals with three different compartments considering active population which vary in course of time: susceptible population S(t), infectious population I(t) and recovered population R(t). The population in S compartment are always at a high risk of infection, thus anytime they may reach to the infectious stage due to a certain disease by coming contact with the infective individuals. A number of infective individuals may die due to the severity of the disease whereas majority of the population become fully recovered in course of time owing to the immunity and treatment facilities. We consider the presence of influx rate of population and natural death rate to the SIR model which is governed as follows:
$\frac{dS}{dt}=b-(\beta I+\mu )S$
$\frac{dI}{dt}=\beta \,SI-(\mu +\gamma +d)\,I$
$\frac{dR}{dt}=\gamma I-\mu R$ (1)
with S(0)>0, I(0)≥0, R(0)≥0 and N(t)=S(t)+I(t)+R(t).
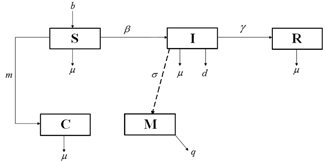
In model (1), b indicates the influx rate, β denotes the disease transmission rate and $\gamma$ represents the recovery rate. The constants d and μ represent disease induced death rate and natural death rate respectively. We now incorporate a nonnegative control variable compartment: media awareness or M(t) to the model (1) to study the impact of media awareness programs which are covered by media during the disease period. We assume that media generally focuses on several health issues such as washing hands frequently, wearing face mask with protective equipment, avoiding outside food, maintaining safety while travelling, staying home during illness etc. We also assume that media collects information from the infective population with a rate σ (news collection rate) and broadcast the effective programs timely so that the general population may become aware of the disease. Owing to this assumption, a large portion of susceptible population (S) may become conscious by the influence of media awareness (M) and reach to an isolation compartment C(t), termed as conscious population, with a constant rate m (rate of publicity of awareness programs) from where they never come back to the susceptible class. To make our model more realistic, we further assume that sometimes there may be limitation of resources for which exhaustion in M compartment may occur with a rate q. Considering the two new compartments: M(t) and C(t), the previous model (1) is modified (Figure 1) as follows:
$\frac{dS}{dt}=b-(\beta I+mM+\mu )\,S$
$\frac{dI}{dt}=\beta \,SI-(\mu +\gamma +d)\,I$
$\frac{dR}{dt}=\gamma I-\mu R$
$\frac{dM}{dt}=\sigma I-qM$
$\frac{dC}{dt}=mSM-\mu C$ (2)
with S(0)>0, I(0)≥0, R(0)≥0, M(0)≥0, C(0)≥0 and N(t)=S(t)+I(t)+R(t)+C(t).
Figure 1. Compartmental diagram representing infectious disease dynamics with control policy
The analysis required for model (2) is discussed in this section. We need to observe the boundedness criterion of (2), determine its possible equilibria with basic reproduction number and prove the stability of equilibria.
3.1 Boundedness
Following [7], we obtain from model (2): $\frac{d N}{d t} \leq b-\mu N$ which implies that $N(t) \leq \frac{b}{\mu}+\left(N(0)-\frac{b}{\mu}\right) \exp (-\mu t) .$ When $t \rightarrow \infty, N(t)$ approaches to a certain threshold $\frac{b}{u}$ which suggests that N(t) is actually bounded on [0, t), as a result S, I, R and C are also bounded. Therefore the biological feasible region of model (2) is:
$\Omega =\left\{ (S(t),\,I(t),\,R(t),\,C(t))\in \Re _{+}^{4}\,\,:\,\,S,I,R,C\ge 0\,\,;\,\,0\le N\le \frac{b}{\mu } \right\}$
3.2 Equilibria
Apparently, model (2) possesses two equilibrium points, a disease free equilibrium point $(\mathrm{DFE}): \varepsilon_{1}\left(S^{\circ}, I^{o}, R^{o}, M^{o}, C^{o}\right)$ and an endemic equilibrium point $(\mathrm{EE}): \varepsilon_{2}\left(S^{*}, I^{*}, R^{*}, M^{*}, C^{*}\right) .$
Clearly $\varepsilon_{1}\left(S^{o}, I^{o}, R^{o}, M^{o}, C^{o}\right) \equiv\left(\frac{b}{\mu}, 0,0,0,0\right)$.
In order to determine EE which satisfies the equations:
$\frac{dS}{dt}=0,\frac{dI}{dt}=0,\frac{dR}{dt}=0,\frac{dM}{dt}=0,\,\frac{dC}{dt}=0$
i.e., $b-(\beta I+mM+\mu )\,S=0$,$\beta \,SI-(\mu +\gamma +d)\,I=0$,$\gamma I-\mu R=0$, $\sigma I-qM=0$and $mSM-\mu C=0$ (3)
we solve Eq. (3) and thus obtain $\varepsilon_{2}\left(S^{*}, I^{*}, R^{*}, M^{*}, C^{*}\right)$ where,
${{S}^{*}}=\frac{d+\gamma +\mu }{\beta }$, ${{I}^{*}}=\frac{bq\beta -q{{\mu }^{2}}-dq\mu -q\gamma \mu }{(d+\gamma +\mu )\,(m\sigma +q\beta )}$
${{R}^{*}}=\frac{\gamma \,(bq\beta -q{{\mu }^{2}}-dq\mu -q\gamma \mu )}{\mu \,(d+\gamma +\mu )\,(m\sigma +q\beta )}$, ${{M}^{*}}=\frac{\sigma \,(b\beta -d\mu -\gamma \mu -{{\mu }^{2}})}{(d+\gamma +\mu )\,(m\sigma +q\beta )}$
and ${{C}^{*}}=\frac{m\sigma \,(b\beta -d\mu -\gamma \mu -{{\mu }^{2}})}{\beta \mu \,(m\sigma +q\beta )}$.
3.3 Basic reproduction number ($\mathfrak{R}_{0}$)
A precise method termed as next generation matrix approach [33] is applied in this subsection to obtain the basic reproduction number (${{\Re }_{0}}$) for model (2).
In model (2), I(t) is the only infection component and therefore the new infection matrix is $F=(\,\beta \,{{S}^{o}}\,){{\,}_{1\times 1}}$ and the transfer matrix is $V=(\,d+\gamma +\mu \,){{\,}_{1\times 1}}$. Consequently, the next generation matrix becomes$F{{V}^{-1}}=(\,\beta \,{{S}^{o}}\,)\,\,\left( \frac{1}{d+\gamma +\mu \,} \right)\,$.
Hence, the spectral radius of $F{{V}^{-1}}$, i.e., $\rho \,(F{{V}^{-1}})$ is defined to be the basic reproduction number (${{\Re }_{0}}$) which can be written as: ${{\Re }_{0}}=\frac{\beta \,{{S}^{o}}}{d+\gamma +\mu \,}=\frac{b\beta }{\mu \left( d+\gamma +\mu \right)}$.
3.4 Stability
The Jacobian matrix (J) associated to the model (2) is essentially required to establish the stability [34] of DFE and EE and therefore is defined as follows:
$J=\left( \,\begin{matrix} -(\beta \,I+\mu +mM) & -\beta S & 0 & -mS & 0 \\ \beta \,I & \beta S-\mu -\gamma -d & 0 & 0 & 0 \\ 0 & \gamma & -\mu & 0 & 0 \\ 0 & \sigma & 0 & -q & 0 \\ mM & 0 & 0 & mS & -\mu \\\end{matrix}\, \right)$ (4)
Theorem 1. The DFE: $\varepsilon_{1}\left(S^{o}, I^{o}, R^{o}, M^{o}, C^{o}\right)$ is asymptotically stable when $\Re_{0}<1$ and unstable when ${{\Re }_{0}}>1$.
Proof. At DFE: $\varepsilon_{1}\left(S^{o}, I^{o}, R^{o}, M^{o}, C^{o}\right) \equiv\left(\frac{b}{\mu}, 0,0,0,0\right)$, Eq. (4) becomes
$\begin{align} & J({{\varepsilon }_{1}})=\left( \,\begin{matrix} -(\beta \,{{I}^{o}}+\mu +m{{M}^{o}}) & -\beta {{S}^{o}} & 0 & -m{{S}^{o}} & 0 \\ \beta \,{{I}^{o}} & \beta {{S}^{o}}-\mu -\gamma -d & 0 & 0 & 0 \\ 0 & \gamma & -\mu & 0 & 0 \\ 0 & \sigma & 0 & -q & 0 \\ m{{M}^{o}} & 0 & 0 & m{{S}^{o}} & -\mu \\\end{matrix}\, \right) \\ & \Rightarrow J\,({{\varepsilon }_{1}})=\left( \,\begin{matrix} -\mu & -\beta \frac{b}{\mu } & 0 & -m\frac{b}{\mu } & 0 \\ 0 & \beta \frac{b}{\mu }-\mu -\gamma -d & 0 & 0 & 0 \\ 0 & \gamma & -\mu & 0 & 0 \\ 0 & \sigma & 0 & -q & 0 \\ 0 & 0 & 0 & m\frac{b}{\mu } & -\mu \\\end{matrix}\, \right) \\\end{align}$
Considering λ as the eigen value, the characteristic equation becomes $\left| J\,({{\varepsilon }_{1}})-\lambda \,{{I}_{d}}\, \right|=\,\,0$, where Idis an identity matrix of order 5×5.
Now by rearranging the characteristic equation, we obtain
$\left| \,\begin{matrix} -\mu -\lambda & -\beta \frac{b}{\mu } & 0 & -m\frac{b}{\mu } & 0 \\ 0 & \beta \frac{b}{\mu }-\mu -\gamma -d-\lambda & 0 & 0 & 0 \\ 0 & \gamma & -\mu -\lambda & 0 & 0 \\ 0 & \sigma & 0 & -q-\lambda & 0 \\ 0 & 0 & 0 & m\frac{b}{\mu } & -\mu -\lambda \\\end{matrix}\, \right|=0$ (5)
From Eq. (5), we have
$(\lambda +q)\,(\lambda +\mu )\,(\lambda +\mu )\,(\lambda +\mu )\,\left( \lambda -\frac{b\beta -d\mu -\gamma \mu -{{\mu }^{2}}}{\mu } \right)\,=0$
which implies that $\lambda=-q, \lambda=-\mu, \lambda=-\mu, \lambda=-\mu,$ and $\lambda=\frac{b \beta-d \mu-\gamma \mu-\mu^{2}}{\mu}$.
Clearly, all the eigen values, except $\lambda=\frac{b \beta-d \mu-\gamma \mu-\mu^{2}}{\mu}$, are negative.
Now $\lambda=\frac{b \beta-\mu(d+\gamma+\mu)}{\mu}$ can be written as $\lambda=\frac{\mu(d+\gamma+\mu)\left(\frac{b \beta}{\mu(d+\gamma+\mu)}-1\right)}{\mu}=(d+\gamma+\mu)\left(\Re_{0}-1\right)$, which is negative when $\Re_{0}<1$. Therefore, Theorem 1 holds.
Theorem 2. The EE: $\varepsilon_{2}\left(S^{*}, I^{*}, R^{*}, M^{*}, C^{*}\right)$ is asymptotically stable when $\Re_{0}>1$ and unstable when ${{\Re }_{0}}<1$.
Proof is provided in Appendix A.
4.1 Parameters
Since model (2), in general, is designed with a view to understanding the impact of media awareness programs for all infectious diseases (pandemic or epidemic), it will be wise to consider the ongoing fact, COVID-19 pandemic, for parameter collection. Model (2) has eight parameters in total and we have collected influx rate, natural death rate, transmission rate, disease induced death rate and recovery rate from recent studies [35, 36]. It has been observed that a patient who is infected by COVID-19 requires about 15 days on average for his or her complete recovery and therefore γ is set to 1/15 per day. The parameters σ, m and q related to the control function, media awareness, have been assumed for our simulations. The description of all parameters with respective values is provided in Table 1.
Table 1. Description of parameters and respective values
|
Parameters |
Description |
Values (per day) |
Source |
|
b |
rate of influx |
271.23 |
[35] |
|
μ |
natural death rate |
3.01×10⁻⁵ |
[35] |
|
β |
disease transmission rate |
3.112×10⁻⁸ |
[36] |
|
d |
disease induced death rate |
0.01 |
[35] |
|
γ |
recovery rate from disease |
1/15 |
[35] |
|
σ |
rate of news collection from the infectives |
0.0005 – 0.0050 |
Assumed |
|
m |
rate of publicity of awareness programs |
0.0002 – 0.0006 |
Assumed |
|
q |
exhaustion rate of programs for limitation of resources |
0.00015 |
Assumed |
Figure 2. Dynamics of all compartments for σ=0.0005 and m=0.0002
4.2 Results
We use MATLAB, particularly ‘ode45’ solver, for performing the numerical simulations with the parameter values described in Table 1. Initially, we consider the total population N(0)=9003354 which is subdivided as: S(0)=9003322, I(0)=30, R(0)=2 and C(0)= 0. We set M(0)=0 with σ = 0.0005 and m = 0.0002 as the standard values. With all the initial values of state variables and parameters, the code is run for 120 days. The simulation result is presented in Figure 2 from where the dynamics of all compartments of our designed model is understood. The code is run again for m = 0.0002, 0.0004 and 0.0006 to study the impact of media awareness programs and the results are shown in Figures 3-7. We have focused on the news collection rate (σ) keeping m fixed to 0.0002, increased the values of σ from 0.0005 to 0.0025 and 0.0050 and studied its effects on the control function with infectious and conscious population which are displayed in Figures 8-10. We have also studied the effects of disease transmission rate β and recovery rate γ (Figures 11-13) to understand the variation of $\Re_{0}$ since it is responsible for the disease persistence.
It is evident from Figure 2 that the number of susceptible individuals decreases with time. A portion of susceptible population become conscious owing to the media awareness programs and move to the isolation stage. Another portion of susceptible class become infected due to the severity of disease transmission or infection rate, as a result the infective class size reaches to a maximum peak point within 50 days. The total infectious population around 50 days is seen to be about 1.77% of total population. For the immunity system of human body and proper treatment, infected people gradually recover from the disease or may die and within 120 days, 3.26% of total population become fully recovered of the disease. Due to the continuous growth of control variable, media awareness, the size of conscious population increases upto 96.22% of total population and reaches a threshold after 60 days which continues till the end.
Figure 3. Susceptible population for m=0.0002, 0.0004 and 0.0006
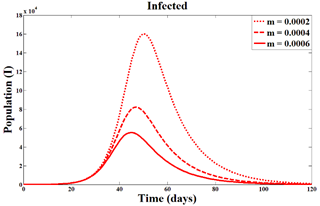
From Figure 3, we see that susceptible population reduce gradually when the publicity rate of awareness programs (m) increases (i.e., m=0.0004 and 0.0006) from its standard value (m = 0.0002). Figure 4 represents the dynamics of infectious class for m=0.0002, 0.0004 and 0.0006. It is observed that infectious population decrease to 48.63% approximately for m = 0.0004 compared to the standard value (m=0.0002) whereas the population size decreases to 65.41% for m=0.0006.
Figure 4. Infectious population for m=0.0002, 0.0004 and 0.0006
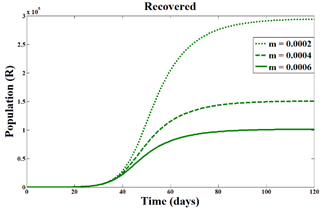
Figure 5. Recovered population for m=0.0002, 0.0004 and 0.0006
Figure 6. Dynamics of recovered population compared to the infectious population for m=0.0002, 0.0004 and 0.0006
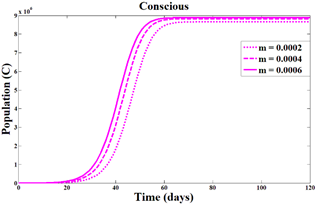
Figure 5 shows the dynamics of recovered population for m = 0.0002, 0.0004 and 0.0006. Apparently, it seems that the size of the recovered population reduces when the publicity rate of awareness programs is increased. This happens because a portion of susceptible population initially become conscious by virtue of media awareness programs which are implemented to bring consciousness. Thus a percentage of susceptible population isolate themselves from the infectives. The concept may clearly be understood from Figure 6 where both infected and recovered population are shown in order to realize the behaviors of these two compartments combinedly. From Figure 6, it is obvious that for m=0.0002, the total number of recovered population is superior to that of infected population and this statement exactly holds also for m=0.0004 and 0.0006. The dynamics of conscious population have been displayed in Figure 7 to study the effect of the publicity rate (m). We see that for m=0.0004 and 0.0006, the threshold of conscious class increases approximately to 1.91% and 2.56% respectively compared to the previous threshold.
Figure 7. Conscious population for m=0.0002, 0.0004 and 0.0006
Figure 8. Control variable function for σ=0.0005, 0.0025 and 0.0050
Figure 9. Infectious population for σ=0.0005, 0.0025 and 0.0050
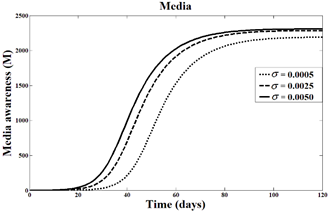
Figure 8 describes the control variable function (media awareness) for the news collection rate σ=0.0005, 0.0025 and 0.0050. When σ=0.0005, the control function increases continuously and after 85 or 90 days time period, it reaches its maximum level. With the increase of σ, the function shows an enormous effect and reaches to the maximum level before 80 days. It has been found that the control function increases about 4.29% for σ=0.0025 and 5.35% for σ=0.0050. From Figure 9, we understand that the reduction of infectious group is nearly about 79.04% to 89.39% due to the intensification of news collection rate. Figure 10 represents that conscious population change over time when σ increases. For σ=0.0005, it takes around 60 days to attain the threshold level whereas for 0.0025 and 0.0050, the maximum number of conscious population increases approximately to 3.10% within 55 days and 3.51% within 45 days respectively.
Figure 10. Conscious population for σ=0.0005, 0.0025 and 0.0050
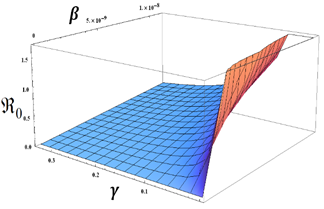
Figure 11. Effects of β and γ on $\Re_{0}$
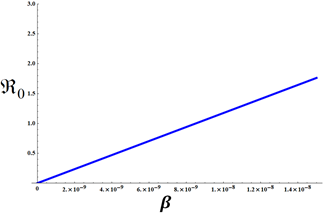
Figure 12. Change in $\Re_{0}$ for β
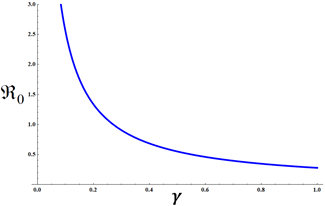
Figure 13. Change in $\Re_{0}$ for γ
Figure 11 is the three dimensional representation of $\Re_{0}$ for β and γ whereas Figures 12 and 13 are representing the characteristics of $\Re_{0}$ for β and γ respectively. It has been observed that $\Re_{0}$ increases with the increase of disease transmission rate β whereas $\Re_{0}$ shows decreasing effects when the recovery rate γ is increased. This investigation suggests that besides publicity rate of awareness programs and news collection rate, recovery rate is also responsible for the reduction of infectious population size.
A general model on infectious disease dynamics has been developed in this paper where media awareness is considered as a control variable function. The model is formulated with a purpose to study the impact of media awareness with important factors and its efficacy during any pandemic or epidemic situation. Media generally collects information about the severity of the ongoing disease, emphasizes on several health issues, as a result of which, mass population may become conscious and form a separate isolation group so that they may avoid the contagion. Since increased transmission rate is one of the main reasons for the persistence of a disease, consciousness regarding safety issues and disease characteristics is significantly needed to lessen the adverse scenario. It is observed that continuous publicity of awareness programs brings a tremendous change in human behavior which is very effective and substantial in preventing the disease transmission. Moreover, the news and information collected by media, despite some exhaustion, always reveal a positive impact which works as a pre-recovery option for mitigating the virus transmission. The present work suggests that in order to productively control the disease burden, especially at that time when there is scarcity of effective vaccines or proper treatments, early and continuous implementation of awareness programs may be one of the supportive interventions for any countries to meet the critical challenges against the new emerging diseases.
The first author was supported by the Ministry of Science and Technology, Government of the People’s Republic of Bangladesh in her M.Sc. program with the NST Fellowship 2017-18, Grant No. 39.00.0000.012.02.009.17-662, Serial: 217, Date-10.01.2018. This financial support is greatly acknowledged. The authors are also thankful to the anonymous reviewers and the editor for their constructive comments and suggestions which have significantly improved the quality of the paper.
Proof of Theorem 2. We apply numerical technique to establish the theorem.
At EE: $\varepsilon_{2}\left(S^{*}, I^{*}, R^{*}, M^{*}, C^{*}\right)$, Eq. (4) becomes
$J({{\varepsilon }_{2}})=\left( \,\begin{matrix} -(\beta \,{{I}^{*}}+\mu +m{{M}^{*}}) & -\beta {{S}^{*}} & 0 & -m{{S}^{*}} & 0 \\ \beta \,{{I}^{*}} & \beta {{S}^{*}}-\mu -\gamma -d & 0 & 0 & 0 \\ 0 & \gamma & -\mu & 0 & 0 \\ 0 & \sigma & 0 & -q & 0 \\ m{{M}^{*}} & 0 & 0 & m{{S}^{*}} & -\mu \\\end{matrix}\, \right)$ (A.1)
where,
${{S}^{*}}=\frac{d+\gamma +\mu }{\beta }$,${{I}^{*}}=\frac{bq\beta -q{{\mu }^{2}}-dq\mu -q\gamma \mu }{(d+\gamma +\mu )\,(m\sigma +q\beta )}$,${{R}^{*}}=\frac{\gamma \,(bq\beta -q{{\mu }^{2}}-dq\mu -q\gamma \mu )}{\mu \,(d+\gamma +\mu )\,(m\sigma +q\beta )}$ and${{M}^{*}}=\frac{\sigma \,(b\beta -d\mu -\gamma \mu -{{\mu }^{2}})}{(d+\gamma +\mu )\,(m\sigma +q\beta )}$
Considering λ as the eigen value, the characteristic equation is:
$\left| \,J\,({{\varepsilon }_{2}})-\lambda \,{{I}_{d}}\, \right|=\left| \,\,\,\begin{matrix} -(\beta \,{{I}^{*}}+\mu +m{{M}^{*}})-\lambda & -\beta {{S}^{*}} & 0 & -m{{S}^{*}} & 0 \\ \beta \,{{I}^{*}} & \beta {{S}^{*}}-\mu -\gamma -d-\lambda & 0 & 0 & 0 \\ 0 & \gamma & -\mu -\lambda & 0 & 0 \\ 0 & \sigma & 0 & -q-\lambda & 0 \\ m{{M}^{*}} & 0 & 0 & m{{S}^{*}} & -\mu -\lambda \\\end{matrix}\,\, \right|=0$ (A.2)
where, Idis an identity matrix of order 5×5.
Using the values of the parameters from Table 1, i.e., b = 271.23, μ = 3.01×10⁻⁵, β = 3.112×10⁻⁸, d = 0.01, γ = 1/15, σ = 0.0005, m = 0.0002 and q = 0.00015, we have
S*=2.46455×10⁶, I*=47.0922,
R*=104302, M*=0.392435,
Also from basic reproduction number,
${{\Re }_{0}}=\frac{b\beta }{\mu \left( d+\gamma +\mu \right)}=\text{ 3}\text{.65623}>\text{1}$ (A.3)
Therefore, the simplified form of Eq. (A.2) is:
${{c}_{1}}{{\lambda }^{5}}+{{c}_{2}}{{\lambda }^{4}}+{{c}_{3}}{{\lambda }^{3}}+{{c}_{4}}{{\lambda }^{2}}+{{c}_{5}}\lambda +{{c}_{6}}=0$ (A.4)
where,
c1=1, c2=0.0601703,
c3=0.000010335, c4=3.68385×10⁻⁷,
c5=2.215525×10⁻¹¹ and c6=3.33345×10⁻¹⁶
Solving Eq. (A.4), we obtain
λ =–0.0601, –0.00003, –0.00003, –0.0000049 –0.00247 i and – 0.0000049 + 0.00247 i
It is visible that the first three eigen values are negative whereas the fourth and fifth eigen values are complex conjugate with negative real parts and this occurs due to Eq. (A.3) (i.e., for $\Re_{0}>1$). It can be shown that for $\Re_{0}<1$, all eigen values or real parts of complex eigen values will not be negative.
Therefore, the EE: $\varepsilon_{2}\left(S^{*}, I^{*}, R^{*}, M^{*}, C^{*}\right)$ is asymptotically stable when $\Re_{0}>1$ and unstable for $\Re_{0}<1$.
[1] Who. Infectious diseases, Health topics, World Health Organization. https://www.who.int/topics/infectious_diseases/en.
[2] Wikipedia. Infection. https://en.wikipedia.org/wiki/Infection#Transmission.
[3] Wikipedia. List of infectious diseases. Available from: https://en.wikipedia.org/wiki/List_of_infectious_diseases.
[4] Who. Coronavirus Disease (COVID-2019) Situation Reports. https://www.who.int/emergencies/diseases/novel-coronavirus-2019/situation-reports.
[5] Watts, D.J. (2004). Six degrees: The science of a connected age. W.W. Norton & Company.
[6] Wikipedia. Mathematical modelling of infectious disease. https://en.wikipedia.org/wiki/Mathematical_modelling_of_infectious_disease.
[7] Rahman, S.A., Vaidya, N.K., Zou, X. (2016). Impact of early treatment programs on HIV epidemics: an immunity-based mathematical model. Mathematical Biosciences, 280: 38-49. https://doi.org/10.1016/j.mbs.2016.07.009
[8] Sorensen, S.W., Sansom, S.L., Brooks, J.T., Marks, G., Begier, E.M., Buchacz, K., DiNenno, E.A., Mermin, J.H., Kilmarx, P.H. (2012). A mathematical model of comprehensive test-and-treat services and HIV incidence among men who have sex with men in the United States. PloS One, 7(2): e29098. https://doi.org/10.1371/journal.pone.0029098
[9] Granich, R.M., Gilks, C.F., Dye, C., De Cock, K.M., Williams, B.G. (2009). Universal voluntary HIV testing with immediate antiretroviral therapy as a strategy for elimination of HIV transmission: A mathematical model. The Lancet, 373(9657): 48-57. https://doi.org/10.1016/S0140-6736(08)61697-9
[10] Biswas, M.H.A. (2012). AIDS epidemic worldwide and the millennium development strategies: A light for lives. HIV & AIDS Review, 11(4): 87-94. https://doi.org/10.1016/j.hivar.2012.08.004
[11] Liu, J., Zhang, T. (2011). Global stability for a tuberculosis model. Mathematical and Computer Modelling, 54(1-2): 836-845. https://doi.org/10.1016/j.mcm.2011.03.033
[12] Gao, D.P., Huang, N.J. (2018). Optimal control analysis of a tuberculosis model. Applied Mathematical Modelling, 58: 47-64. https://doi.org/10.1016/j.apm.2017.12.027
[13] Ziv, E., Daley, C.L., Blower, S. (2004). Potential public health impact of new tuberculosis vaccines. Emerging Infectious Diseases, 10(9): 1529. https://doi.org/10.3201/eid1009.030921
[14] Agusto, F.B. (2017). Mathematical model of Ebola transmission dynamics with relapse and reinfection. Mathematical Biosciences, 283: 48-59. https://doi.org/10.1016/j.mbs.2016.11.002
[15] Chowell, G., Hengartner, N.W., Castillo-Chavez, C., Fenimore, P.W., Hyman, J.M. (2004). The basic reproductive number of Ebola and the effects of public health measures: the cases of Congo and Uganda. Journal of Theoretical Biology, 229(1): 119-126. https://doi.org/10.1016/j.jtbi.2004.03.006
[16] Mondal, M.K., Hanif, M., Biswas, M.H.A. (2017). A mathematical analysis for controlling the spread of Nipah virus infection. International Journal of Modelling and Simulation, 37(3): 185-197. https://doi.org/10.1080/02286203.2017.1320820
[17] Biswas, M.H.A. (2012). Model and control strategy of the deadly Nipah virus (NiV) infections in Bangladesh. Research & Reviews in Biosciences, 6(12): 370-377.
[18] Biswas, M.H.A. (2014). Optimal control of Nipah virus (NiV) infections: A Bangladesh scenario. Journal of Pure and Applied Mathematics: Advances and Applications, 12(1): 77-104.
[19] Ghosh, I., Tiwari, P.K., Chattopadhyay, J. (2019). Effect of active case finding on dengue control: Implications from a mathematical model. Journal of Theoretical Biology, 464: 50-62. https://doi.org/10.1016/j.jtbi.2018.12.027
[20] Ortigoza, G., Brauer, F., Neri, I. (2020). Modelling and simulating chikungunya spread with an unstructured triangular cellular automata. Infectious Disease Modelling, 5: 197-220. https://doi.org/10.1016/j.idm.2019.12.005
[21] Kim, S., Lee, J., Jung, E. (2017). Mathematical model of transmission dynamics and optimal control strategies for 2009 A/H1N1 influenza in the Republic of Korea. Journal of Theoretical Biology, 412: 74-85. https://doi.org/10.1016/j.jtbi.2016.09.025
[22] Verguet, S., Johri, M., Morris, S.K., Gauvreau, C.L., Jha, P., Jit, M. (2015). Controlling measles using supplemental immunization activities: A mathematical model to inform optimal policy. Vaccine, 33(10): 1291-1296. https://doi.org/10.1016/j.vaccine.2014.11.050
[23] Khan, T., Ullah, Z., Ali, N., Zaman, G. (2019). Modeling and control of the hepatitis B virus spreading using an epidemic model. Chaos, Solitons & Fractals, 124: 1-9. https://doi.org/10.1016/j.chaos.2019.04.033
[24] Fung, I.C.H., Tse, Z.T.H., Fu, K.W. (2015). The use of social media in public health surveillance. Western Pacific surveillance and response journal: WPSAR, 6(2): 3. https://doi.org/10.5365/WPSAR.2015.6.1.019
[25] Rahman, M.S., Rahman, M.L. (2007). Media and education play a tremendous role in mounting AIDS awareness among married couples in Bangladesh. AIDS Research and Therapy, 4(1): 10. https://doi.org/10.1186/1742-6405-4-10
[26] Kiss, I.Z., Cassell, J., Recker, M., Simon, P.L. (2010). The impact of information transmission on epidemic outbreaks. Mathematical Biosciences, 225(1): 1-10. https://doi.org/10.1016/j.mbs.2009.11.009
[27] Funk, S., Gilad, E., Watkins, C., Jansen, V.A. (2009). The spread of awareness and its impact on epidemic outbreaks. Proceedings of the National Academy of Sciences, 106(16): 6872-6877. https://doi.org/10.1073/pnas.0810762106
[28] Collinson, S., Khan, K., Heffernan, J.M. (2015). The effects of media reports on disease spread and important public health measurements. PloS One, 10(11): e0141423. https://doi.org/10.1371/journal.pone.0141423
[29] Ye, X., Li, S., Yang, X., Qin, C. (2016). Use of social media for the detection and analysis of infectious diseases in China. ISPRS International Journal of Geo-Information, 5(9): 156. https://doi.org/10.3390/ijgi5090156
[30] Cui, J.G., Sun, Y.H., Zhu, H.P. (2008). The impact of media on the control of infectious diseases. Journal of Dynamics and Differential Equations, 20(1): 31-53. https://doi.org/10.1007/s10884-007-9075-0
[31] Misra, A.K., Sharma, A., Shukla, J.B. (2011). Modeling and analysis of effects of awareness programs by media on the spread of infectious diseases. Mathematical and Computer Modelling, 53(5-6): 1221-1228. https://doi.org/10.1016/j.mcm.2010.12.005
[32] Kermack, W.O., McKendrick, A.G. (1927). A contribution to the mathematical theory of epidemics. Proceedings of the royal society of London. Series A, Containing Papers of a Mathematical and Physical Character, 115(772): 700-721. https://doi.org/10.1098/rspa.1927.0118
[33] Van den Driessche, P., Watmough, J. (2020). Reproduction numbers and sub-threshold endemic equilibria for compartmental models of disease transmission. Mathematical Biosciences, 180(1-2): 29-48. https://doi.org/10.1016/S0025-5564(02)00108-6
[34] Zill, D.G. (2016). Differential equations with boundary-value problems. Nelson Education.
[35] Yang, C., Wang, J. (2020). A mathematical model for the novel coronavirus epidemic in Wuhan, China. Mathematical Biosciences and Engineering, 17(3): 2708-2724. https://doi.org/10.3934/mbe.2020148
[36] Rong, X., Yang, L., Chu, H., Fan, M. (2020). Effect of delay in diagnosis on transmission of COVID-19. Mathematical Biosciences and Engineering, 17(3): 2725-2740. https://doi.org/10.3934/mbe.2020149