Qiangqiang An
OPEN ACCESS
This paper attempts to improve the accuracy of traditional collaborative filtering recommendation algorithms. To solve the sparsity of the scoring matrix, the author designed a novel collaborative filtering recommendation algorithm based on average similarity (AS) and user-based collaborative filtering (USF). The proposed algorithm was subjected to parallelization programming on MapReduce, followed by the analysis on the parallelization of the algorithm. Next, the proposed algorithm was verified through experiments with varied ratios. The experiments show that our algorithm can compensate for the sparseness of the scoring matrix in traditional algorithms, and output accurate recommendation results. The research findings shed important new light on solving recommendation problems in the ear of big data.
average similarity (AS), user-based collaborative filtering (USF), recommendation algorithm, scoring matrix
With the advent and rapid development of the big data era, the researches based on big data are going deeper and involving increasing fields, covering all aspects of people's life and learning. The big data recommendation system also provides businesses and users with much convenience, attracting a lot of attention from the public. Businesses can recommend goods, information, and services to users through the big data recommendation system, while users can no longer feel so confused about the information selection and can quickly and easily choose the content they need through the recommendation [1]. However, the big data era also imposes unprecedented challenges on the accuracy of traditional recommendation methods under information overloads.
The collaborative filtering recommendation technology is now widely used in various fields for it’s easy to understand. This paper, with the purpose of improving the accuracy of the traditional collaborative filtering recommendation algorithm, optimized the traditional CF recommendation algorithm based on the analysis of the existing problems in this algorithm, proposed the ASUCF algorithm, and carried out a simulation experiment on the ASUCF algorithm by building the Hadoop cloud computing platform by comparative analysis [2], verifying that the algorithm can make up for the drawbacks of the traditional algorithms and improve the recommendation accuracy.
2.1 Recommendation technology
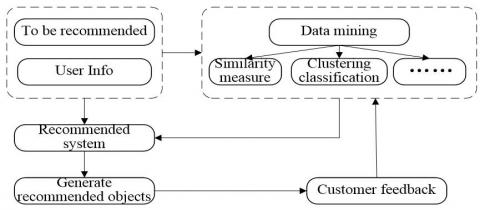
The recommendation system uses data mining methods to recommend similar products and things to users according to their past consumer behaviors and products bought, combined with information retrieval and filtering technologies, so as to free users from selection confusion by massive data [3]. Figure 1 shows the recommendation process of the recommendation system that can continuously improve the accuracy of recommendations by learning from user feedback and consumer behavior records. The recommended system is widely used in various fields, covering e-commerce, web pages, music, and movies. At present, the most commonly used recommended methods are the hybrid recommendation method, the recommendation methods based on rules, knowledge and content, and the collaborative filtering recommendation method [4]. This article mainly focuses on the collaborative filtering recommendation method.
Figure 1. Recommended system recommendation process
2.2 Collaborative filtering technology
The collaborative filtering technology finds the neighbor users through the similarity between users, and user neighbors with similar interests according to the calculation of the interest scores and all the users' preferences, so as to recommend similar items to users [5].
2.2.1 Classification of collaborative filtering algorithms
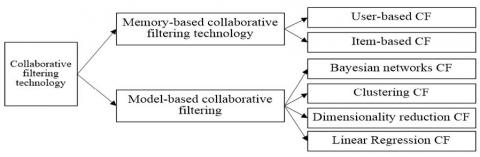
As the research on the collaborative filtering algorithms goes deeper, the algorithms are becoming increasingly diversified, and there are many ways to form a new collaborative filtering algorithm. Despite this, the collaborative filtering algorithms can be classified as shown in Figure 2 in general [6]. Other algorithms are combined in line with this classification.
Figure 2. Collaborative filtering technology classification
(1) Memory-based CF
When recommending, this method searches for similar objects through global search, and scores according to the user-item scoring matrix to obtain the recommendations. For different objects of the user similarity calculation, the classification methods are different and divided into the following two categories [7].
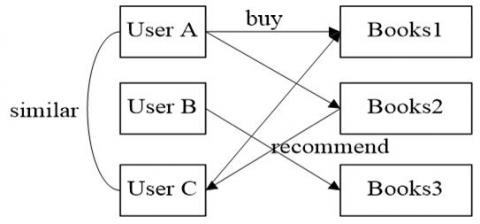
1) User-based CF
The User-based CF algorithm finds the similar users’ historical behaviors via the similarities among users, and then forecasts and selects the items whose ratings are similar to user ratings for recommendation. Figure 3 is an example of the User-based CF recommendation algorithm.
Figure 3. Example of User-based CF
2) Item-based CF
The Item-based CF algorithm recommends similar items to users by finding similarities among items., which is based on the concept that users have the same preference for certain item.
(2) Model-based Collaborative Filtering
Although the memory-based collaborative filtering technology performs better, its computational efficiency will decrease when the number of users and items increases, due to its user-item scoring matrix for all users and items. In order to solve this problem, scholars have put forward the model-based collaborative filtering technology, which can improve work efficiency by relying on data mining, linear regression and other methods to establish an offline decision model by matrix learning. However, it takes a high cost and requires regular update. If the update interval is too long, the recommendations will be inaccurate.
2.2.2 Collaborative filtering technology working steps
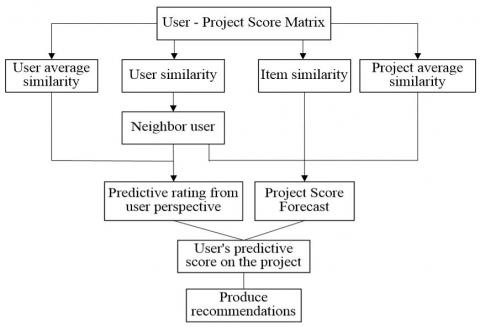
Figure 4 shows the major working steps of the collaborative filtering technology [8].
(1) Build User – Item Scoring Matrix
Table 1 shows the user-item rating matrix.
Figure 4. Collaborative filtering technology work steps
Table 1. User - item rating matrix
|
User/ Item |
I1 |
I2 |
I3 |
… |
In |
|
U1 |
R11 |
R12 |
R13 |
… |
R1n |
|
U2 |
R21 |
R22 |
R23 |
… |
R2n |
|
U3 |
R31 |
R32 |
R33 |
… |
R3n |
|
… |
… |
… |
… |
… |
… |
|
Um |
Rm1 |
Rm2 |
Rm3 |
… |
Rmn |
In the table, m and n, respectively, stand for the number of all users and items, and $R_{i j}$ is the evaluation value.
(2) Formation of the Nearest Neighbor Set. Calculate and rank the user similarity, and then take the first K users to form the nearest neighbor set. The common similarity calculation methods consist of cosine, adjusted cosine similarity, and Pearson coefficient related methods.
(3) Give Recommendations
The average weighted strategy is usually used to calculate the predicted score according to Formula (1).
$P_{i, c}=\overline{R_{i}}+\frac{\sum \operatorname{sim}(i, j) \times\left(R_{j, c}-\overline{R_{j}}\right)}{\sum|\operatorname{sim}(i, j)|}$ (1)
Take N weighted average items similar to user interest degrees in the nearest neighbor set as the final recommendation.
2.2.3 Common test standards
The accuracy of the recommendation is the key of the recommendation system. Therefore, the recommendation results should be evaluated by appropriate test standards according to the actual application. Usually, the algorithm can verify its accuracy on some specific data sets. Currently, there are many evaluation methods for the quality of recommendation, among which the more commonly used ones are the assessment on the accuracy of forecast and classification [9].
(1) Forecast Accuracy
It is the most commonly used method in the current recommendation system. Based on the statistics principle, the recommendation results are generated by the training set first in the operation, and the test set is used for testing. Then the forecast accuracy of the recommendation system is measured by the error between the two. Errors are divided into mean absolute deviation (MAE) and root mean square error (RMSE). As the MAE can reflect the recommendation quality more intuitively, it is now widely used in the recommendation field.
$M A E=\frac{\sum_{i=1}^{N}\left(p_{i}-q_{i}\right)}{N}$ (2)
In this equation, Pi and Qi represent the actual score set of system prediction and the users respectively, and the measurement can be done by measuring the difference between these two. The MAE is inversely proportional to the recommended quality.
(2) Classification accuracy Classification accuracy refers to the accuracy of the recommendation results, and accuracy and recall rate can be used for the comprehensive consideration of the classification accuracy of recommendation results.
Precision $=\frac{\text { Test } \cap \text { Re commended }}{\text { Re commended }}$ (3)
Re $c a l l=\frac{\text {Test} \cap \text { Re commended }}{\text {Test}}$ (4)
3.1 Problems in traditional algorithms
(1) Sparsity of Matrix
The sparsity of matrix refers to the fact that the scoring matrix relied upon by collaborative filtering technology is getting sparse due to the users’ failure to score all the items when the scale of users reaches a certain extent [10] and the accuracy of the recommendation results will also be affected. Methods including data filling and data dimension reduction are used to solve this problem.
Figure 5. Collaborative filtering algorithm flow based on average similarity
(2) Cold start
Cold start can be divided into the cold start of users and projects. No relevant historical operation records and score records can be found in new users and new projects, and thus recommendation cannot be provided.
(3) Scalability
When scale of users and projects expand, it will inevitably lead to the reduction of timeliness. To solve the scalable problem, the method of threshold setting or probability calculation can be used to reduce the search space and improve the operation efficiency.
3.2 Collaborative filtering optimization Recommendation Algorithm-ASUCF Algorithm
(1) Flow of Collaborative Filtering (ASUCF) algorithm based on average similarity
In order to solve the problems existing in traditional algorithms and improve the recommendation efficiency and accuracy of recommendation results, this paper proposes the collaborative filtering (ASUCF) based on average similarity. That is, the average similarity of users and projects are introduced and the score of users for the project can be obtained based on the predictive score of these two, so as to improve the efficiency and recommendation quality of the recommendation system [11]. The flow chart of the ASUCF algorithm is shown in Figure 5.
(2) Average similarity
Average similarity of users
$U A S(i)=\frac{\sum_{c, w \in I} \operatorname{si} m(c, w)}{\left.C^{2}\right|_{I i} |}$ (5)
In this equation, UAS(i) is the average similarity of user i; $C^{2}|I i|$ is the number of combination of scored projects; $I_{i}$ is the interest distribution of user i.
Average similarity of projects
$\operatorname{IAS}(c)=\frac{\sum_{i, j \in C c} \operatorname{si} m(i, j)}{C^{2}\left|c_{c}\right|}$ (6)
In this equation, IAS(c) is the user average similarity of project C; $C_c$ is the scored user set of project C.
(3) Computation of predictive score
Different from the traditional method used in predicting scores based solely on the users' situation, the scoring characteristics of both users and projects are considered in the computation of predictive score of ASUCF.
1) $P U_{i}, c$ computation from the perspective of users
$P U_{i, c}=\overline{R_{i}}+\frac{\sum(\operatorname{sim}(i, j)-U A S(i)) \times\left(R_{j, c}-\overline{R}_{j}\right)}{\sum|\operatorname{sim}(i, j)-U A S(i)|}$ (7)
2) $P I_{i, C}$ computation from the perspective of projects
$P I_{i, c}=\overline{R_{c}}+\frac{\sum(\operatorname{sim}(c, w)-I A S(c)) \times\left(R_{i, w}-\overline{R_{w}}\right)}{\sum|\operatorname{sim}(c, w)-I A S(c)|}$ (8)
3) Comprehensive computation of $P_{i}, c$
$P_{i, c}=\frac{1}{2}\left(P U_{i, c}+P I_{i, c}\right)$ (9)
With the development of information technology, cloud computing has become the best strategy to solve the big data recommendation problem because of its advantages of large scale, low cost, strong computing power and high reliability. This paper takes Hadoop cloud computing platform as the platform of big data processing, and realizes the parallelization of ASUCF algorithm through the MapReduce parallel computing model on the Hadoop platform [12], thus improving the computing efficiency and scalability.
Figure 6. Algorithm process analysis
4.1 Analysis of algorithm process
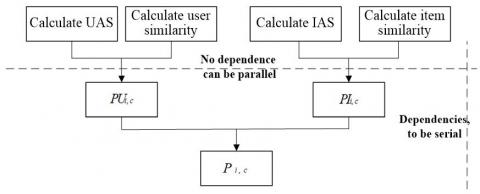
In order to achieve the parallelization of the ASUCF algorithm, it is necessary to analyze which algorithm can be parallelized or serialized and their interrelationship in addition to the MapReduce module design. Figure 6 shows the ASUCF algorithm analysis process. In this process, the predictive score calculated based on the perspective of users and the predictive score calculated based on the perspective of projects can be parallelized while the similarity score needs to be performed before the predictive score so that these two are serialized [13].
4.2 Algorithm process design based on MapReduce
(1) UAS Computation
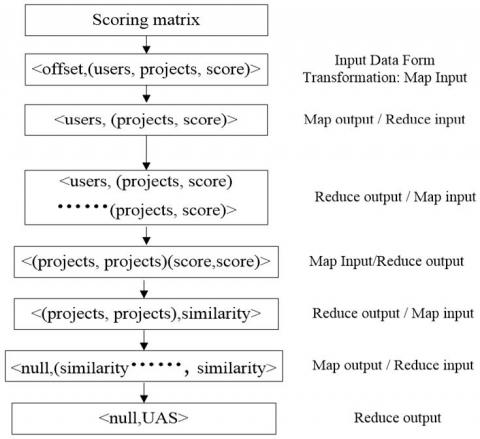
In order to design the input/output method for key-value pairs of MapReduce programming model algorithm, the input-output method in collaborative filtering technology needs to be converted. Because large number of design processes are required, this paper takes UAS computation as an example to conduct the design of MapReduce process. The design of MapReduce process of other IAS, user similarity and project similarity is the same as this principle, so we do not repeat it here. Figure 7 shows the design of MapReduce process of UAS [14]. The process includes a total of three parallel MapReduce processes,
Figure 7. USA calculated MapReduce process design
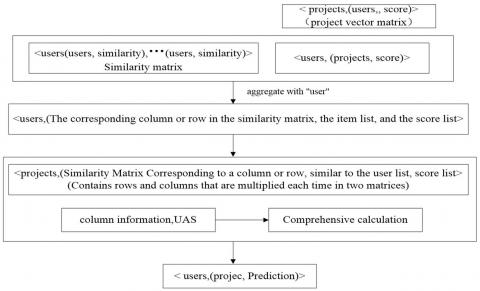
Figure 8. $P U_{i}, c$'s perspective calculates the MapReduce process
(2) Key to the Realization of Algorithm MapReduce Design
As it can be seen from Figure 6 that when the UAS, IAS, user similarity and project similarity are calculated, the key step is the computation of $P U_{i}, c$ and $P I_{i}, c$. This paper conducts the algorithm MapReduce design from the perspective of users. The project perspective method is the same as the user principle, which will not be explained in details. The specific process is as follows [15]:
1) The user vector matrix (as shown in Table 1) and project vector
matrix can be generated through conversion.
2) Generate user similarity matrix and project similarity matrix. The user similarity matrix is shown in Table 2.
Table 2. User similarity matrix
|
User/ Item |
U1 |
U2 |
U3 |
… |
Um |
|
U1 |
1 |
sim12 |
sim13 |
… |
sim1n |
|
U2 |
sim21 |
1 |
sim22 |
… |
Sim2n |
|
U3 |
sim31 |
sim32 |
1 |
… |
Sim3n |
|
… |
… |
… |
… |
1 |
… |
|
Um |
simm1 |
simm2 |
sim m3 |
… |
1 |
3) MCatrix multiplication, formula computation
$P U_{i}, c$ can be obtained through the multiplication of project vector matrix and user vector matrix according to the above formula (7), which is shown in Figure 8. $P I_{i}, c$ can also be obtained according to formula (8) in a similar way.
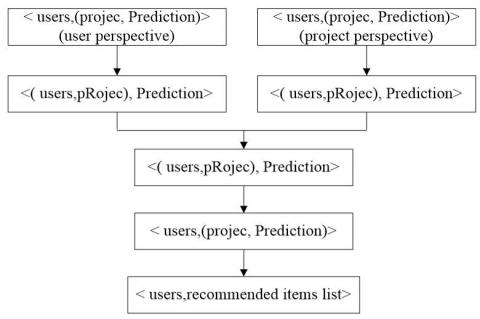
4) Comprehensive computation of $P i, c$
The $P_{i}, c$ can be computed according to formula (9) and the $P U_{i}, c$ and $P I_{i, C} obtained. The process is shown in Figure 9.
Figure 9. MapReduce process design for predictive score calculation and recommended results
4.3 Experimental design
(1) Experimental platform
In order to verify the accuracy of collaborative filtering optimization algorithm-ASUCF (MAE), this paper builds a Hadoop cloud computing platform by selecting one master and five slaves with the same configuration and software version and uses Mahout development tools to implement ASUCF algorithm. The specific software installation and platform building process will not be introduced here.
(2) Experimental design
In this paper, the evaluation of users for movies in the commonly used MovieLens in the recommended field is selected as the experimental data set, because it meets the requirements of the ASUCF algorithm computed in this paper when the data is sparser. The data set is true, reliable and resource-rich. Table 3 is three kinds of scales of dataset size provided by MovieLens.
Table 3. MovieLens provides three kinds of data set size
|
Score record (Ten thousand) |
User number |
Movie number |
Sparseness (%) |
|
10 |
943 |
1682 |
93.69 |
|
100 |
6040 |
3900 |
95.75 |
|
1000 |
71567 |
10681 |
98.69 |
In this experiment, a data set of 100,000 records is taken and the contrastive analysis method is used to conduct two-time accuracy (MAE) experiments on traditional collaborative filtering algorithm and optimization algorithm (ASUCF). Other variables are fixed, the ratio of test set and training set is randomly divided into 4: 1 and 7: 3 respectively, and the number of neighbors is 15.
4.4 Experimental results and analysis
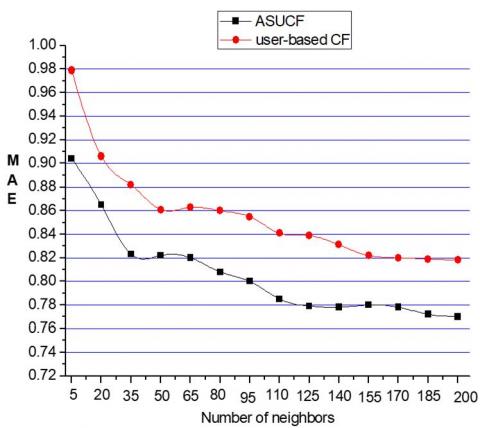
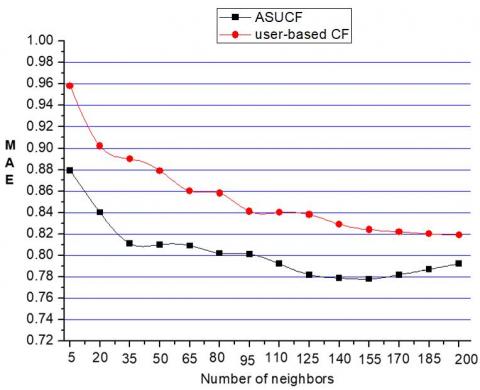
(1) MAE Experiment Results When the Ratio of Test Set and Training Set is 4:1 and 7:3
Figure 10 and Figure 11 show the experimental results of MAE when the ratio of test set and the training set is 4:1 and 7:3 respectively. As it can be seen from these figures, when the number of neighbors is the same, the MAE value of ASUCF algorithm is relatively lower than that of traditional one, while the MAE is inversely proportional to the quality of recommendations, indicating that the quality of recommendations of the ASUCF algorithm is higher than the traditional one. When the number of neighbors increases, the MAE values of these two algorithms both decrease to different degrees. When the number of neighbors increases to a certain degree, the decreasing trend is gradually weakened, which means that the number of neighbors is not the more the better.
Figure 10. Training sets and test set results when the ratio is 4: 1
Figure 11. Training sets and test set results when the ratio is 7: 3
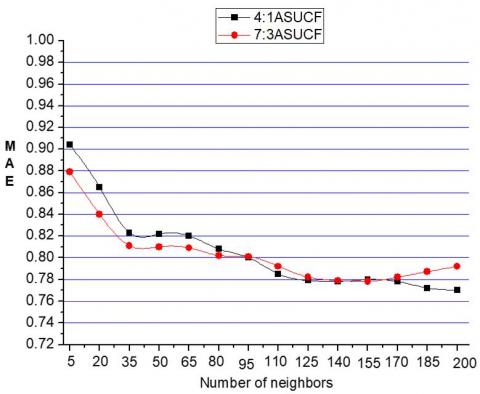
(2) MAE Experimental Results of Collaborative Filtering Optimization Algorithm- ASUCF of Different Proportions
Figure 12 shows the MAE experimental results of ASUCF algorithm when the division ratio is different. As it can be seen from the figure, when the number of users is less than 95, the MAE value with division ratio of 7: 3 is lower than that with ratio of 4: 1, which indicates that the result of this division proportion is superior. However, when the number of users is more than 95, the difference between these two is small. Therefore, we can conclude that the prediction accuracy (MAE) of ASUCF algorithm is better when the sparseness is lower.
Figure 12. The ASEF algorithm MAE when the ratio is different
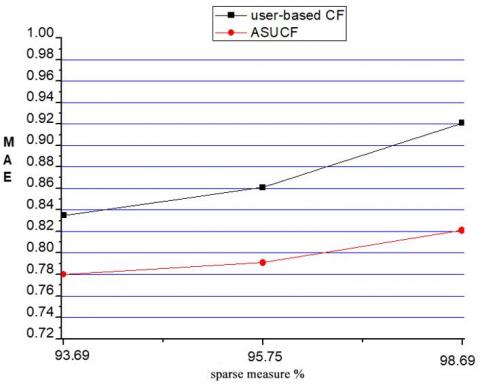
(3) MAE Experiment results with different sparsity degree
Figure 13 shows the comparison between the traditional system filtering recommendation algorithm and the ASUCF algorithm with different sparsity degree. It can be seen from the figure that the MAE value of the ASUCF algorithm is always lower than the traditional algorithm with different sparsity degree, which shows that the recommendation result of ASUCF algorithm is superior to that of traditional one. With the increase of sparsity, the MAE value of both algorithms increases. However, the increase of ASUCF algorithm is slow, and the lower the sparsity, the greater the gap between these two algorithms.
Figure 13. MAE experimental results when data set sparsity is different
Combined with the above experimental data and comparison diagrams, we can conclude that the collaborative filtering optimization algorithm-ASUCF can effectively solve the problem of sparse data in the traditional algorithm and improve the accuracy of the recommendation results.
This paper takes the optimization of the collaborative filtering recommendation algorithm based on big data processing as the research content and conducts in-depth research to improve the accuracy of recommendation results aiming at the problems in traditional algorithms. The main conclusions are as follows:
(1) Based on the detailed analysis of the traditional collaborative filtering recommendation algorithm, a collaborative filtering (ASUCF) algorithm based on average similarity is proposed aiming at the sparsity of scoring matrix.
(2) MapReduce parallelization programming design of ASUCF algorithm is conducted, and the parallelization process of ASUCF algorithm is analyzed.
(3) By using the Hadoop cloud computing platform, the comparative analysis method is used to conduct the data set experiment of the ASUCF algorithm with different ratio to verify that this algorithm can compensate the sparseness of scoring matrix in traditional algorithms and improve the accuracy of the recommendation results.
[1] Cui, X.L., Zhu, P.F., Yang, X., Li, K.Q., Ji, C.Q. (2014). Optimized big data k-means clustering using mapreduce. Journal of Supercomputing, 70(3): 1249-1259. https://doi.org/10.1007/s11227-014-1225-7
[2] Sfrent, A., Pop, F. (2015). Asymptotic scheduling for many task computing in big data platforms. Information Sciences, (319): 71-91. https://doi.org/10.1016/j.ins.2015.03.053
[3] Río, S.D., López, V., Benítez, J.M., Herrera, F. (2015). A mapreduce approach to address big data classification problems based on the fusion of linguistic fuzzy rules. International Journal of Computational Intelligence Systems, 8(3): 422-437. https://doi.org/10.1080/18756891.2015.1017377
[4] Mothe, J., Rakotonirina, A.J. (2018). Contextual collaborative filtering. A LDA-based approach. Ingénierie des Systèmes d’Information, 23(1): 89-109. https://doi.org/10.3166/ISI.23.1.89-109
[5] Su, P., Shang, C., Shen, Q. (2015). A hierarchical fuzzy cluster ensemble approach and its application to big data clustering. Journal of Intelligent & Fuzzy Systems, 28(6): 2409-2421. https://doi.org/10.3233/IFS-141518
[6] Anagnostopoulos, I., Zeadally, S., Exposito, E. (2016). Handling big data: Research challenges and future directions. Journal of Supercomputing, 72(4): 1494-1516. https://doi.org/10.1007/s11227-016-1677-z
[7] Lin, K.C., Zhang, K.Y., Huang, Y.H., Hung, J.C., Yen, N. (2016). Feature selection based on an improved cat swarm optimization algorithm for big data classification. Journal of Supercomputing, 72(8): 3210-3221. https://doi.org/10.1007/s11227-016-1631-0
[8] Kovacs, L., Szabo, G. (2016). Conceptualization with incremental bron-kerbosch algorithm in big data architecture. Acta Polytechnica Hungarica, 13(2): 139-158.
[9] Cole, J.B., Newman, S., Foertter, F., Aguilar, I., Coffey, M. (2012). Breeding and genetics symposium: Really big data: processing and analysis of very large data sets. Journal of Animal Science, 90(3): 723. https://doi.org/10.2527/jas.2011-4584
[10] Kwon, O., Sim, J.M. (2013). Effects of data set features on the performances of classification algorithms. Expert Systems with Applications, 40(5): 1847-1857. https://doi.org/10.1016/j.eswa.2012.09.017
[11] Lee, C.H., Chien, T.F. (2013). Leveraging microblogging big data with a modified density-based clustering approach for event awareness and topic ranking. Journal of Information Science, 39(4): 523-543. https://doi.org/10.1177/0165551513478738
[12] Deng, S., Huang, L., Li, Y., Yin, J. (2014). Deploying data-intensive service composition with a negative selection algorithm. International Journal of Web Services Research, 11(1): 76-93.
[13] Fan, B., Leng, S., Yang, K. (2016). A dynamic bandwidth allocation algorithm in mobile networks with big data of users and networks. IEEE Network, 30(1): 6-10. https://doi.org/10.1109/MNET.2016.7389824
[14] Fernández, A., Carmona, C.J., Jesus, M.J.D., Herrera, F. (2016). A view on fuzzy systems for big data: progress and opportunities. International Journal of Computational Intelligence Systems, 9(sup1): 69-80. https://doi.org/10.1080/18756891.2016.1180820
[15] Xu, X., Zhao, J., Xu, G., Ding, Y., Dong, Y. (2014). Dsmc: a novel distributed store-retrieve approach of internet data using mapreduce model and community detection in big data. International Journal of Distributed Sensor Networks, 2014(4): 1-12. https://doi.org/10.1155/2014/430848