Fabien Beaumont* | Fabien Bogard | Sébastien Murer | Guillaume Polidori | Farouk Madaci | Redha Taiar
OPEN ACCESS
This main goal of this study is to investigate the link between both aerodynamics and physiological responses of an international level middle-distance runner, when running either alone or in drafting position behind two pace makers. A simulation model based on Computational Fluid Dynamics (CFD) methods are used to analyze aerodynamic effects while physiological parameters are experimentally recorded using a lightweight ambulatory respiratory gas exchange system (Cosmed K5©). Experiments were performed at submaximal effort during a 1000 m on-track running test, and simulations were carried out under similar conditions in terms of speed and runners spacing. The results indicate that compared to the baseline (running alone), the drafting position shows a significant aerodynamic reduction in drag area (-33%), which should be responsible for the measured decrease in the following physiological parameters: oxygen consumption (-6%), heart rate (-1%) and energy cost (-33%). The findings of this study suggest running behind two pace makers meaningfully influences the runner's physiology by minimizing air resistance.
VO2, Energy cost, CFD, drag area, air resistance
The main purpose of the present study is to investigate the close link between the aerodynamic and physiological responses of an international level middle-distance runner when running alone or in drafting position behind two pace makers.
In a sporting activity, "drafting" refers to the practice of getting closer to another competitor in an attempt to minimize the work required to overcome the drag (by pushing the fluid out of the way). Drafting is practiced in many sports and the related benefits in terms of performance are unquestionable [1]. However, most scientific studies in the matter only investigate the physiological benefits and neglect its aerodynamic side, which is nevertheless essential. It is well known that an athlete's performance is related to metabolism as well as the conditions under which a sporting activity is practiced [2]. Moreover, there is a direct correlation between an athlete's physiological mechanisms and the aerodynamic parameters governing the mechanics of the sporting gesture. During sports practice, aerodynamic (or hydrodynamic) drag is the force acting opposite to the relative motion of an athlete with respect to a surrounding fluid (air, water). Although drafting behind another runner is commonly known to reduce aerodynamic drag, accurate quantification of the associated performance gain is difficult, being inherent to various parameters such as speed, distance between runners, position... The aerodynamic drag of a moving body can be assessed using experimental methods (field tests or wind tunnel measurements), but also by numerical methods such as CFD (Computational Fluid Dynamics). There has been growing interest in this type of analysis over the past few years and numerous scientific publications have been dedicated to its application in the field of sports sciences [3-11]. CFD actually provides accurate information on the flow structure around an obstacle. In the frame of sports sciences, it enables accurate description of the aerodynamic phenomena acting on moving bodies during the practice of drafting. Silva et al. [10] used CFD methods to analyze drafting effects in swimming. Ito [9] studied the aerodynamic effects of marathon pace makers on a main runner by comparing experiments with CFD simulations, while Blocken et al. [5] used CFD combined with wind tunnel measurements to assess aerodynamic drag in cycling pelotons.
In terms of physiology, the effect of drafting has been widely studied since it reduces the athlete's energy expenditure and perceived exertion, while improving sports performance. Drafting is used in many sports such as cross-country skiing [12], speed skating [13], cycling [14-16], swimming [17] and short-tracking [18]. However, few studies have been conducted regarding the effects of drafting during running, especially in middle and long distances. Zouhal et al. [19] have shown that drafting can result in significant time savings for athletes in middle-distance running over 3000 m. Other studies have shown that drafting decreases the athlete's oxygen consumption in roller skating [20], triathlon [21-22] and even in cycling where it has been found to reduce oxygen consumption by up to 62% [23]. At a given speed, lesser oxygen consumption results in energy saving: drafting may therefore be part of an energy saving strategy. Drafting has also been shown to significantly reduce heart rate in cross-country skiing [12, 24] or triathlon [21-22]. During intense exercise, the feeling of extreme heaviness and fatigue experienced by the athlete stems from an accumulation of lactic acid. Drafting has been shown to reduce the blood concentration of lactate after exercise [21], allowing the athlete to compete longer before fatigue. Moreover, drafting can reduce the perception of effort [25]. As a consequence of these advantages, many studies have concluded that drafting can have a significant effect on athletic performance and overall performance. For example, drafting improved the performance of short track speed skaters by 2% [18]. Although speeds may vary from one sport to another, Hagberg [23] and Millet et al [20] concluded that the benefits of drafting increase along with speed. In addition, Arnett [1] determined that the positive effect of drafting on runners increased with wind speed when running with a headwind. Millet et al [20] showed that drafting benefits in in-line skating increase as the distance between skaters decreases. Blocken et al. [4] stated that for six or more cyclists of similar sizes riding behind one another, the positions with the highest drag reduction are the last two ones.
Positioning wisely would allow the athlete to take full advantage of the benefits of drafting, its use being part of an individual or collective strategy that would improve an athlete's sporting performance. In middle and long distance running events, both the organizers and athletes often use pacemakers (also called pacesetters) or rabbits to obtain the best possible winning time. In track and field, the use of pace makers is commonplace and allows setting the rhythm during the initial part of a race. In the 800 m, only one pace maker seems sufficient, while in longer distances two or even three pace makers are needed. Running behind leading pace makers can be considered as drafting because the trailing runner in a subsequent position is placed in an “aerodynamic shelter”.
There is a clear lack of data in the literature regarding the benefits that a drafting situation can provide in the case of running. To bring new knowledge on this area, this paper establishes a new approach based on both experimental and numerical methods. For this, the main purpose of the present study is to investigate the close link between the aerodynamic and physiological responses of an international level middle-distance runner when running alone or in drafting position behind two pace makers. Aerodynamic effects are numerically analyzed using a Computational Fluid Dynamics (CFD) method while physiological parameters were recorded using a lightweight ambulatory respiratory gas exchange system (Cosmed K5©). Physiological measurements were performed using a metabolimeter to assess the draft runner's VO2, heart rate and energy consumption. Numerical simulations were performed using identical parameters (speed, runners spacing). To the best of our knowledge, the present study is the first one to combine metabolic measurements with numerical simulations in order to assess both physiological and aerodynamic effects involved in the practice of drafting in middle-distance running events.
The remainder of this paper is organized as follows: Section 2 introduces both numerical and experimental methods used in the present research, Section 3 describes the results of the study which are discussed in the Section 4.
2.1 Numerical method
The purpose of these numerical simulations is to reproduce in the most realistic way the aerodynamic response related to the practice of drafting when running in line. To this end, the experimental conditions of the running track tests described in the second part of the method section have been reproduced in a numerical model. The number of runners, their average speed as well as the spacing between runners were modelled. In order to highlight the influence of the two pace makers on results, two calculations were performed: the first one featured only one runner (ND), while the second included all three runners, i.e. one runner behind two pace makers (DR).
2.2 Geometry and computational grid
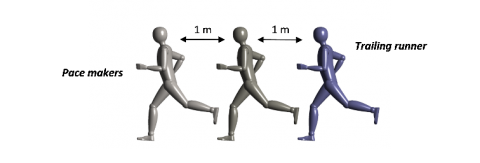
Solving a computational fluid dynamics problem requires several steps, starting with the geometry of the solids of interest and the computational domain. The simplified geometry of the runner’s body placed in a running position was designed using a CAD software (see Figure 1). It is worth noting that for simplification purposes, the runner is considered as a static body in the computation. In such a case, the running movements of the arms and legs are not modelled.
Figure 1. Runner’s geometry as designed using a CAD software: In accordance with the experimental test, the distance between two runners equals 1 m
The same CAD software used to create the runner’s geometry made it possible to calculate a frontal area of the runner’s model of 0.56 m², similar to that found by Bardal [26].
For the second computation, the geometry was duplicated to obtain 3 runners separated by a distance of 1 m, as seen in Figure 1. It is worth noting that the distances between the three runners are similar to those of the experimental test, presented in the second part of the article.
The three-dimensional grid was generated using the ANSYS Workbench Meshing® software and consists of a structured mesh composed of approximately 5×10⁶ hexahedral elements. The size of the computational domain as well as the meshing methodology are detailed in a previous article [3].
2.3 Boundary conditions
A uniform constant horizontal velocity (5.88 m/s or 21.2 km/h) was imposed at the inlet of the fluid domain corresponding to the runner’s average speed recorded during the experimental test. At the outlet, a pressure condition corresponding to the ambient static pressure was imposed. A symmetry condition was also applied to the upper and side surfaces of the fluid domain. Finally, on the surface of the runner’s model, the no-slip wall boundary condition was applied.
2.4 CFD simulations
Simulations were performed using ANSYS Fluent 18.2© CFD code. The standard k-ε model was chosen to solve the 3D steady Reynolds Averaged Navier-Stokes (RANS) equations. During computations, convergence was monitored and was supposedly reached as soon as residuals displayed values below 10-5. Detailed CFD methodology is described in a previous paper [3].
2.5 Experimental overview
2.5.1 Subjects
Three athletes specialized in middle and long distance running volunteered to participate in this study. It should be noted that physiological measurements were performed on only one runner (world-class runner). These national and international level athletes are all members of the CREPS Athletics Team located in Reims, France. The anthropometric characteristics of each athlete are listed in Table 1.
All subjects agreed to participate in the experiment after being informed of the purpose of the study and the protocol, and gave their written consent in accordance with the Declaration of Helsinki.
Table 1. Anthropometric characteristics of the three runners
|
|
Age (years) |
Height (cm) |
Body mass (kg) |
BMI (kg/m²) |
|
Tested subject |
18 |
184 |
63 |
18.6 |
|
Pace maker 1 |
19 |
193 |
77 |
20.7 |
|
Pace maker 2 |
19 |
182 |
64 |
19.3 |
2.5.2 Track race running protocol
The 1000 m is one of the shortest middle-distance tracks running races. The indoor 1000 meters usually takes place on a 200-meter track, thus requiring five laps to complete. Measurements were carried out on a 200 m indoor athletics track (CREPS, Reims, France), ensuring minimization of the adverse effects of wind. In addition, temperature and humidity (20-21°C, 53-56% RH) were measured and varied little from one measurement to another.
In order to measure the potential effects of drafting on the athlete's respiratory parameters, a first measurement was performed on a single athlete (No Drafting: ND) after running the 1000 meters (see Figure 2). One day later, a similar measurement was performed on the same athlete following two pace makers (Drafting: DR). The distance between each runner was established at 1 m ± 0.1 m (Figure 2). Each test was performed one day apart and consisted of a warm-up phase, an exercise phase and a recovery phase. Only the exercise phase, consisting of 5 laps of the 200-meter track, was analyzed. In both tests (with and without drafting), oxygen consumption (VO2 max) and energy cost were measured for the tested runner under similar competitive conditions (Figure 2). For each of the two tests performed under identical conditions, physiological measurements were recorded every 2 seconds using a portable device designed to measure metabolic parameters (K5, COSMED©, Italia).
Before each test, the subject started with a standardized warm-up consisting of 10-minute continuous run at low speed, a standardized mobility drills followed by a 5-minute stretching. The total duration of the warm-up phase was 15 minutes. After stretching, the harness and mask were placed on the subject and the Cosmed K5© system was attached to the back of the tested subject. Tests were subsequently conducted on the subject before calibration procedures were implemented. Once the subject was ready, the VO2 measurement began and the tested subject was positioned on the starting line. The delay between initiation of the measurement and the runner’s start was measured in order to pinpoint the exact beginning of the time trial in the data file. The second test, which took place the next day under identical conditions, was performed with two other runners (pace makers) preceding the tested subject by a distance of 1 m.
Figure 2. Different cases studied. Running alone (a), running behind two pace makers (b)
3.1 Numerical results
Drag area is defined as the product of the drag coefficient by the frontal area (m²). Drag area was determined using CFD calculation first for the runner alone (ND), and secondly for the trailing runner (DR). We found a frontal area of 0.182 m² for the trailing runner compared to 0.272 m² for the runner alone. Results indicate a drag reduction of 33% in drafting position.
Figure 3 represents the pressure coefficient Cp displayed in a vertical centerplane (a, c) as well as in a horizontal plane (b, d), for the isolated runner (a, b) and the three runners (c, d).
The pressure coefficient is defined in Eq. (1). as follows:
$C_p=2\frac{P-P_0}{ρU_∞^2}$ (1)
where P is the static pressure, P0 the reference static pressure (i.e. the atmospheric pressure) and U, the speed of the body through the fluid (m.s-1).
Figure 3. Pressure coefficient Cp in the vertical centre plane (a, c) and in the horizontal plane (b, d) (h=1.2 m) for single runner (top) and three runners (bottom)
It is worth mentioning that the legend in Figure 3 has been limited to the interval [-0.1; 0.2] in order to highlight all changes in the static pressure field due to drafting. The maximum and minimum (absolute) values of Cp are obviously much higher. The effect of the presence of pace makers on the runner is clearly demonstrated by the distribution of pressure, which differs according to the runner's position.
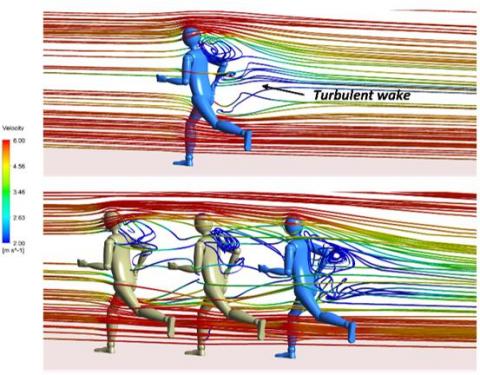
The velocity streamlines are displayed in Figure 4, where it should be remarked that the speed range has been limited to the interval [2; 6 m/s] to better highlight the speed gradients. Figure 4 clearly evidences the development of a turbulent wake behind the runners.
Figure 4. Velocity streamlines for the runner alone (a) and the three runners (b), computations performed for a speed of 5.88 m.s-1 (21.2 km/h)
3.2 Experimental results
The 200 m times recorded at each lap during the two trials are presented in Table 2. Only small differences are observed between intermediate lap times, whether for the tested runner alone or for the tested runner following the two pace makers.
Table 2. 200 m lap times (s) (0-1000 m) of the runners recorded during the two trials for the tested runner alone (ND) and the tested runner following the two pace makers (DR)
|
|
1st lap |
2nd lap |
3rd lap |
4th lap |
5th lap |
|
ND |
33”38 |
34”25 |
34”03 |
33”97 |
33”97 |
|
DR |
33”80 |
34”02 |
34”80 |
34”40 |
34”34 |
The speed derived from these lap times varies by less than 2% between each lap, the average speed over all 5 laps of each event is 5.88 m/s (21.2 km/h).
3.2.1 Oxygen consumption (VO2)
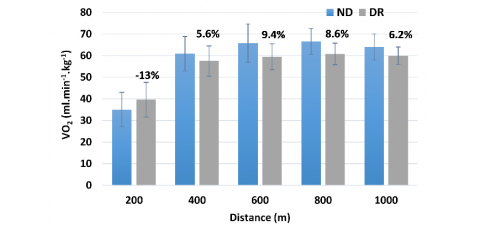
The evolution of oxygen consumption for each lap is presented in Figure 5, benefit of drafting (%) is indicated above the bars.
Drafting reduces the VO2 value by an average 6%, although the (DR) value appears higher than that of the runner alone (ND) during the first lap (0-200 m). Measurements were performed with an average speed of 5.88 m.s-1, deduced from the overall time for the 5 laps of each trial.
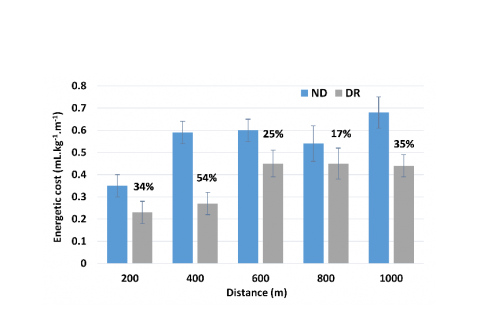
Figure 6. Energetic cost as a function of distance (m) for the runner alone (ND) and for the runner in drafting position (DR), all values are displayed as mean±SD
Energetic cost for the runner alone (ND) and for the trailing runner (DR) is depicted in Figure 6, benefit of drafting (%) is indicated above the bars. A significant gain (17-54%) attributable to drafting is observed.
In this work, two different analysis methods have been implemented to evaluate the aerodynamic and physiological responses of a middle-distance runner following two pace makers during 1000 m indoor on-track races. First of all, a numerical study was carried out in order to investigate the aerodynamic response of the runners when drafting in line. The Computational Fluid Dynamics (CFD) method was used and two separate numerical simulations were completed. The first simulation modelled the airflow around the runner alone, while the second focused on the airflow around the 3 runners (one runner following two pace makers). One of the main reasons why pace makers are used is that running behind another athlete may reduce the aerodynamic forces exerted on the subsequent one [28]. The study by Kyle [29] concludes that running behind one another at a distance of 3.65 m decreases air drag by 28% between athletes, even reaching 64% at a distance of 0.9 m. Our numerical results suggest that the drag area of the trailing runner (DR) is smaller than that of the runner alone (ND) with a drag reduction of 33%, which is lower than the gain calculated in the aforementioned study. Drag is intrinsically related to the distribution of pressures around and in the wake of the runners [30]. From the pressure plots displayed in Figure 3, it is unquestionable that the two pace makers shield the trailing runner from the wind. The low-pressure wake behind the lead runner decreases the pressure gradient taking place from the front to the back of the following runner, hence facilitating his forward motion. The trailing runner pushes high-pressure air forward, such that air with lower velocity hits the runner ahead. This results in less drag for all runners, allowing higher speeds. Quite interestingly, the low-pressure area behind the lead runner (Figure 3, c, d) interacts with the high-pressure area located ahead of the second runner, resulting in a decreased size of the low-pressure area at the back of the lead runner. It is also worth noting that the presence of the two pace makers reduces the absolute value of the overpressure ahead of the last runner as well as the absolute value of under-pressure on his back. Moreover, we can state that the best position among the three riders is the one at the back, as it undergoes a beneficial pressure gradient, thereby minimizing the runner's aerodynamic drag. When running, the athlete induces the movement of the surrounding air as well as the emergence of a turbulent wake behind him. The streamlines presented in Figure 4 indicate that the fluid flow detaches from the runner's body and evolves into the form of vortices. These eddies are located in the negative pressure coefficient area behind the runner (Figures 3 and 4). It is obvious from Figure 4 that flow behavior differs for each runner and depends on the runner’s position in the group: for instance, the turbulent wake depends on the pressure gradients between the front and back of each runner's body. Moreover, one can note that flow velocities are lower in the wake of runners. As a result, being positioned in the wake of a runner is a way of taking advantage of both the negative pressure coefficient area and the lower flow velocities: the under-pressure field ahead of the runner pulls him forward while the whirlwinds push him forward (see Figures 3 and 4).
Even though the reduction of aerodynamic drag of runners due to drafting is well-known, few studies have focused on physiological effects of drafting in middle-distance running. Zouhal et al. [19] carried out a study aimed at determining the effect of drafting during 3000-meter track running. They concluded that drafting may improve running performance by either physiological or non-physiological effects, i.e. pace makers might act as a placebo. In the present work, we suggest that the runner's physiological response largely depends on the reduced aerodynamic response resulting from the drafting position. In order to verify this hypothesis, we performed physiological measurements on a middle-distance runner exercising at submaximal effort during two trials: running alone to simulate a lead runner, and running following two pace makers at a distance of 1 meter. The primary findings of the experimental study are that drafting affects the physiological response of the runner. In many sports, drafting has been proven to reduce oxygen consumption [20-22, 31]. In the present study, it has been shown that the VO2 value measured on the trailing runner (DR) is about 6% lower than that measured on the runner alone (ND) (Figure 5). Pugh [30, 32] investigated the influence of drafting in running and concluded that running behind another athlete reduced VO2 by 6.5%, a value close to those found in our study. Pugh also found that at a speed similar to that of middle-distance track events (6 m/s or about 67 seconds per 400 m), approximately 8% of the runner's energy is consumed to overcome air resistance.
The most commonly used technique to determine the measure of the energetic cost of running is to monitor oxygen consumption (VO2) during running at a given submaximal speed. From VO2 measurements, it is possible to estimate energy expenditure during aerobic activities. It is worth noting that an increase in the rate of oxygen consumption is typical of an increased energy expenditure. Surprisingly, the energy cost savings reported in the present study are greater than those estimated in other sports (Figure 6). In in-line skating, Millet et al [20] reported a gain between 3 and 10% depending on speed and distance between competitors.
The combined approach of our study suggests that the reduction in aerodynamic drag resulting from the practice of drafting in running can lead to a decrease in the cardiorespiratory effort of the runner.
In this work, two different analysis methods have been implemented to evaluate the aerodynamic and physiological responses of a middle-distance runner following two pace makers during 1000 m indoor on-track races. First of all, a numerical study was carried out in order to investigate the aerodynamic response of the runners when drafting in line. The Computational Fluid Dynamics (CFD) method was used and two separate numerical simulations were completed. The first simulation modelled the airflow around the runner alone, while the second focused on the airflow around the 3 runners (one runner following two pace makers). Modifications of pressure gradients due to drafting suggest that the third and last position is the best one in terms of reduction of the aerodynamic response of the runner. Our results also evidenced that the practice of drafting in running has a significant impact on the aerodynamic drag experienced by the runner. It has been shown that running behind two pace makers decreases the aerodynamic drag of the last runner by up to 33%. This work was based on the assumption that the runner's physiological response mostly depends on the lowest aerodynamic response resulting from the drafting position. To verify this hypothesis, we performed physiological measurements on a middle-distance runner who exercised at submaximal effort during two trials: running alone to simulate a lead runner, and running following two pace makers at a distance of 1 meter. The primary findings of the experimental study is that drafting affects the physiological responses of the runner. The measurements revealed that the presence of the two pace makers ahead of the runner reduced the oxygen consumption by ≈6%. The most significant gain was observed in terms of energy expenditure, with an average decrease of 33% compared to the runner alone.
On the basis of the results of our study, we can establish a close link between the physiological data measured on the runner in the drafting position and the results of the aerodynamic analysis conducted by a CFD method. Ultimately, following two pace makers at a distance of 1 meter places the runner in an "aerodynamic shelter" that allows him to reduce energy expenditure and probably improve its running performance. In future studies, it will be possible to investigate other parameters suspected of significantly influencing runners' performance in middle-distance running events, such as the distance between each runner, the number of athletes or their anthropometric characteristics.
The authors would like to address special thanks to the athletes who participated in this study. The authors also gratefully acknowledge the CREPS of Reims for providing us with their athletics track as well as the Cosmed society for the assistance in carrying out this study.
|
Cp |
Pressure coefficient, dimensionless |
|
P P0 |
Static pressure, Pa Reference Static pressure, Pa |
|
U |
Speed, m.s-1 |
[1] Arnett MS. (2002). The physiological effects of drafting in runners. Master's thesis, University of Oregon, USA.
[2] Atkinson G, Davison R, Jeukendrup A, Passfield L. (2003). Science and cycling: current knowledge and future directions for research. Journal of Sports Science 21: 767–787. http://dx.doi.org/10.1080/0264041031000102097
[3] Beaumont F, Taiar R, Polidori G, Trenchard H, Grappe F. (2018). Aerodynamic study of time-trial helmets in cycling racing using CFD analysis. Journal of Biomechanics 67: 1–8. http://dx.doi.org/10.1016/j.jbiomech.2017.10.042
[4] Blocken B, Defraeye T, Koninckx E, Carmeliet J, Hespel P. (2013). Numerical study on the aerodynamic drag of drafting cyclist groups. 6th European and African Conference on Wind Engineering EACWE 2013, July 7-11, Cambridge-UK. Book of Abstract.
[5] Blocken B, Druenen TV, Toparlar Y, Malizia F, Mannion P, Andrianne T, Marchal T, Maas GJ, Diepens J. (2018) Aerodynamic drag in cycling pelotons: New insights by CFD simulation and wind tunnel testing. Journal of Wind Engineering and Industrial Aerodynamics 179: 319–337. http://dx.doi.org/10.1016/j.jweia.2018.06.011
[6] Gardan N, Schneider A, Polidori G, Trenchard H, Seigneur JM, Beaumont F, Fourchet F, Taiar R. (2017). Numerical investigation of the early flight phase in ski-jumping. Journal of Biomechanics 59: 29–34. http://dx.doi.org/10.1016/j.jbiomech.2017.05.013
[7] Hart JH, Allen T, Holroyd M. (2010) Downhill skateboard aerodynamics. Procedia Engineering 2: 2523–2528. http://dx.doi.org/10.1016/j.proeng.2010.04.026
[8] Hirano Y, Tada N. (1996) Numerical simulation of a turning alpine ski during recreational skiing. Medicine & Science in Sports & Exercise 28: 1209. http://dx.doi.org/10.1097/00005768-199609000-00020
[9] Ito S. (2007) Aerodynamic Effects by Marathon Pacemakers on a Main Runner. Transactions of the Japan Society of Mechanical Engineers B. 73:1975–1980.
[10] Silva AJ, Rouboa A, Moreira A, Reis VM, Alves F, Vilas-Boas JP, Marinho DA. (2008) Analysis of drafting effects in swimming using computational fluid dynamics. Journal of Sports Science and Medicine 7: 60–66.
[11] Zaïdi H, Taïar R, Fohanno S, Polidori G. (2008) Analysis of the effect of swimmer’s head position on swimming performance using computational fluid dynamics. Journal of Biomechanics 41: 1350–1358. http://dx.doi.org/10.1016/j.jbiomech.2008.02.005
[12] Bilodeau B, Roy B, Boulay MR. (1994). Effect of drafting on heart rate in cross-country skiing. Medicine & Science in Sports & Exercise 26: 637–641. http://dx.doi.org/10.1249/00005768-199405000-00018
[13] Di Prampero PE, Cortili G, Mognoni P, Saibene F. (1976). Energy cost of speed skating and efficiency of work against air resistance. Journal of Applied Physiology 40: 584-591. http://dx.doi.org/10.1152/jappl.1976.40.4.584
[14] Barry N, Burton D, Sheridan J, Thompson M, Brown NAT. (2015) Aerodynamic drag interactions between cyclists in a team pursuit. Sports Engineering 18: 93–103. http://dx.doi.org/10.1007/s12283-015-0172-8
[15] Belloli M, Giappino S, Robustelli F, Somaschini C. (2016). Drafting effect in cycling: Investigation by wind tunnel tests. Procedia Engineering 147: 38–43. http://dx.doi.org/10.1016/j.proeng.2016.06.186
[16] Edwards AG, Byrnes WC. (2007) Aerodynamic characteristics as determinants of the drafting effect in cycling. Medicine & Science in Sports & Exercise 39: 170–176. http://dx.doi.org/10.1249/01.mss.0000239400.85955.12
[17] Chatard JC, Wilson B. (2003). Drafting distance in swimming. Medicine & Science in Sports & Exercise 35: 1176–1181. http://dx.doi.org/10.1249/01.MSS.0000074564.06106.1F
[18] Rundell KW. (1996). Effects of drafting during short-track speed skating. Medicine and Science in Sports and Exercise 28: 765–771.
[19] Zouhal H, Abderrahman AB, Prioux J, Knechtle B, Bouguerra L, Kebsi W, Noakes TD. (2015). Drafting’s Improvement of 3000-m running performance in elite athletes: Is it a placebo effect? International Journal of Sports Physiology and Performance 10: 147–152. http://dx.doi.org/10.1123/ijspp.2013-0498
[20] Millet G, Geslan R, Ferrier R, Candau R, Varray A. (2003). Effects of drafting on energy expenditure in in-line skating. The Journal of Sports Medicine and Physical Fitness 43: 285–90.
[21] Hausswirth C, Lehénaff D, Dréano P, Savonen K. (1999) Effects of cycling alone or in a sheltered position on subsequent running performance during a triathlon. Medicine & Science in Sports & Exercise 31: 599–604. http://dx.doi.org/10.1097/00005768-199904000-00018
[22] Hausswirth C, Vallier JM, Lehenaff D, Brisswalter J, Smith D, Millet G, Dreano P. (2001) Effect of two drafting modalities in cycling on running performance. Medicine & Science in Sports & Exercise 33: 485–492. http://dx.doi.org/10.1097/00005768-200103000-00023
[23] Hagberg J. (1990). The effects of drafting. Bicycling 31: 168-169.
[24] Bilodeau B, Roy B, Boulay MR. (1995). Effect of drafting on work intensity in classical cross-country skiing. International Journal of Sports Medicine 16: 190–195. http://dx.doi.org/10.1055/s-2007-972990
[25] Corvalán-Grössling V. (1992). The physiological and perceived effects of drafting on a group of highly trained distance runners. Doctoral thesis, University of British Columbia, Vancouver, Canada.
[26] Bardal LM. (2009). Measurement of frontal area of athletes in wind tunnel experiments. Master’s thesis, Department of Energy and Process Engineering, Norwegian university of science and technology, Norway.
[27] Margaria R, Cerretelli P, Aghemo P, Sassi G. (1963). Energy cost of running. Journal of Applied Physiology 18: 367–370. http://dx.doi.org/10.1152/jappl.1963.18.2.367
[28] Kyle CR. (1979). Reduction of wind resistance and power output of racing cyclists and runners travelling in groups. Ergonomics 22: 387–397. http://dx.doi.org/10.1080/00140137908924623
[29] Kyle CR. (1979) Cutting through the wall of air. Runner’s World. May, pp. 48-51.
[30] Pugh LGCE. (1971). The influence of wind resistance in running and walking and the mechanical efficiency of work against horizontal or vertical forces. The Journal of Physiology 213: 255–276. http://dx.doi.org/10.1113/jphysiol.1971.sp009381
[31] Hagberg JM, McCole SD. (1990) The effect of drafting and aerodynamic equipment on the energy expenditure during cycling. Cycling Science 2(3): 19-22.
[32] Pugh LGCE. (1970). Oxygen intake in track and treadmill running with observation on the effect of air resistance. The Journal of Physiology 207: 823–835. http://dx.doi.org/10.1113/jphysiol.1970.sp009097