OPEN ACCESS
Porous carbon materials with high specific surface areas were prepared by a combined method of microwave drying, carbonization and activation processes, in which Chinese herb residue was used as carbon source, and KOH was used as activator, respectively. Scanning electron microscopy (SEM) were used to investigate the microstructure in the formation process of mesoporous carbon materials.N2 adsorption and desorption isotherms were employed to determine by the specific surface areas and pore analyzer. The final sorbent was used for phenol removal .The results showed that the material had the specific surface areas and mesoporous proportion as high as 2 079.25 m2 /g and 79.10% respectively. The saturated adsorption capacity of phenol was 187.5 mg/g. The absorption process fit the Langmuir isotherm model well.Adsorption is mainly on the physical adsorption of phenol on the surface of the porous carbon, and the adsorption behavior is the entropy reduction process of heat release.
Chinese herb residue, porous carbon, specific surface area, phenol, adsorption
With the rapid development of industry in China, the number and types of wastewater discharge have increased rapidly, which have caused serious pollution to the water, so that the health and safety of human beings can not be ignored [1]. As one of the highly polluted wastewater, phenol - containing wastewater is the main pollutant. The phenol is a protoplasmic poison that can react with proteins in cells, formation of insoluble protein material, which causes the cells to lose its vitality, so become the highlight of the pollution is the most phenol containing wastewater. Because the porous carbon material has developed pore structure and large specific surface area, and is widely used in wastewater treatment, air pollution, solvent recovery, food purification and extraction of precious metals and other fields [2-6].
The water treatment is the most important application of porous carbonaceous material, the amount of which accounted for more than 40% [7-9]. The selection of raw materials for the porous carbon is coconut shell, walnut shell, etc., but because of the limited raw material, it restricts its large-scale application. China is the world’s largest producer of traditional Chinese medicine, the annual production of hundreds of millions of tons of medicine. At present, most of the domestic drug residues do landfill treatment, thus causing serious environmental pollution. Because of loose tissue residue, has developed pore and surface area, more conducive to the preparation of porous carbon material. The porous carbon prepared by the recovery of drug residue has good porous and adsorption properties, which can not only solve the problem of environmental pollution, but also realize the comprehensive recycling utilization of the resource.
In this paper, the Chinese herbal medicine dregs was used as raw materials, and the porous carbon materials with high specific surface areas were prepared by a combined method of microwave drying, carbonization and activation processes. Using phenol as the object, the effect of the ratio of modifier and carbonizing materials on the structural properties of the porous carbon materials and the effect of the adsorption of phenol were studied. Because of weak acid and weak polar phenol, KOH modification was used to increase non polar and basic features of the surface hole carbon, to improve its effect on phenol wastewater containing phenol in selective adsorption ability, to provide help for the effective utilization of pore structure of the materials.
Microwave drying of traditional Chinese medicine slag, through the ultra fine powder crushing and sieving to obtain 850 micron particles of raw materials, put it into the 1600X – GSL tube furnace, in the argon atmosphere to 5~20 C /min heating rate to 380 C carbonation 2h. The use of distilled water cleaning, then vacuum heat treatment at 90 DEG C 4h, then the Chinese medicine residue KOH and carbonized (alkali carbon ratio) of 3:1, 4:1, 5:1 according to the quality of the mixture, respectively, in the tube furnace in N2 atmosphere was activated, the first is heated to 400 DEG C were pretreated with 1H, then at 10 C / min respectively heated to 750 degrees Celsius temperature, and thermal insulation 1H, after cooling, then the concentration of 10% HCl cleaning, using distilled water washing to neutral pH value, finally at 110 DEG C, drying to constant weight, to obtain the modified porous materials of Chinese Medicine residue.
The samples were measured by BRUKER D8-ADVANCE X ray diffraction phase. Surface morphology of samples was observed by using QUANTA - TA200 scanning electron microscope. N2 adsorption-desorption isotherm of samples under the 77K were tested by the NOVA2200e surface area and pore size analyzer . The BET equation was used to calculate the surface area, and the method BJH was used to calculate the pore size distribution.
0. 1g porous carbon materials were added to the concentration of 1, 2, 4 and 10 /L 100mL g of phenol solution respectively shocking 24h at 25℃. At a certain time interval, the 1 mL supernatant was removed, and the equilibrium concentration was calculated by the method of ultraviolet visible spectrophotometry. The value of qe (/g mg) was calculated:
$\mathrm{q}_{\mathrm{e}}=\frac{\mathrm{v}\left(\mathrm{c}_{0}-\mathrm{c}_{\mathrm{e}}\right)}{\mathrm{m}}$ (1)
where V was the solution volume (L) , C0 and Ce were the concentration of phenol (/L mg) , m was the quality of activated carbon (g) , respectively.
3.1 Microstructure of porous carbon materials
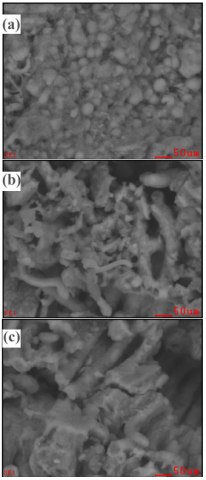
Microstructures of porous materials with different carbon/KOH ratio 1:3, 1:4, and 1:5 are shown in Figure 1. It can be seen that when the carbon base ratio is 1:3, there were a large number of diameter 30 ~ 15 µm spherical shape, and the distribution was more uniform (Figure 1 (a) ) . When the amount of KOH was increased to 1:4, the chemical reaction rate was accelerated, and then corrosion pore wall, which appeared a large number of pore structure with a large diameter of 10 ~ 15µm. As shown in Figure 1 (B) . When the amount of KOH increased, the surface of the material will be excessive corroded, with most reaming hole structure collapse, which lead the pore structur destroyed obviously. The large pore structure with a small size of 25 to 50 m is activated, and the specific surface area of the material is reduced , as shown in Figure 1 (c) . It can be seen that the different carbon /KOH ration can make the material surface morphology change significantly. when carbon /KOH ration is 1:4, which can make the material surface obtain a large number of pore structure, high specific surface area, which can improve the adsorption properties of the materials.
Figure 1. SEM of porous materials with different carbon/KOH ratio (a) 1:3 (b) 1:4 (c) 1:5
3.2 Pore structure of porous carbon materials
The effects of different KOH ratios on the specific surface area and average pore size of porous materials are shown inTable 1. With the increasing of the proportion of KOH, the specific surface areas increased first and then decreased, and the specific surface areas is 2079. 25m2/g when the carbon/KOH ratio is 1:4. This is because the activation process of amorphous carbon was consumed firstly, and more microporous were formed. With the increasing of the proportion of the use of KOH, the activation of the reaction rate was accelerated, and the specific surface areas had also become larger. Increasing of the amount of KOH made the expanded pore size too strong, which caused excessive activation of ablation of herb residue and resulted in decreasing of the surface areas. The average pore diameter of samples of different carbon/KOH ratio (1:3, 1:4 and 1:5) were 2. 16, 7. 78 and 9. 73nm, respectively. This indicated that average pore size increased with the increased of the carbon/KOH ratio. When the carbon/KOH ratio was 1:5, excessive KOH made the microporous and mesoporous ablated, which resulted in larger average pore size. Table 2 shows the parameters of porous structure. It is generally considered that the pore size of microporous materials is less than 2nm, and macroporous materials was between 2 ~ 50nm [12]. Table 1 shows the sample mesoporous volume was 0. 87 cm3 /g, and the total and large pore volume was 79. 10%, and 1. 82%, respectively. Therefore, it is indicated that the material was mesoporous materials.
Table 1. Effect of KOH ration on specific surface areas
|
sample |
1:3 |
1:4 |
1:5 |
|
SBET / (m2·g -1 ) |
1305. 64 |
2079. 25 |
1267. 31 |
|
daverage/ nm |
2. 16 |
7. 78 |
9. 73 |
Table 2. Pore structure parameters of porous carbon materials
|
Project |
Types of pores |
|||
|
Microporous |
Mesoporous |
Macroporous |
Total pore |
|
|
Volume dose (cm3/g) |
0. 21 |
0. 87 |
0. 02 |
1. 10 |
|
content (%) |
19. 10 |
79. 10 |
1. 82 |
100 |
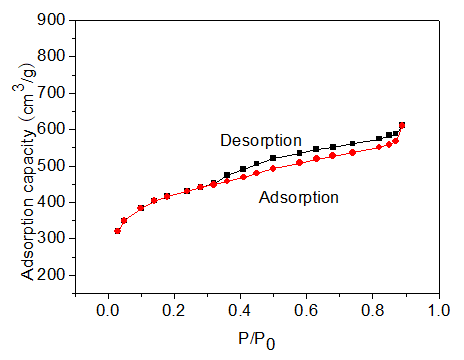
Figure 2 is N2 adsorption-desorption isotherms of porous materials with carbon base ratio of 1:4. From the isotherms, adsorption phenomenon appeared under P/P0 less than 0. 15, which indicated the materials surface had micropores. With the increasing of relative pressure, the adsorption capacity of porous materials continue to increase until the relative pressure is 0. 95. In addition, it is found that the adsorption curve and desorption curve are not coincident, there is a clear adsorption desorption hysteresis loop, which shows that the surface of the porous material contains a large number of mesoporous structure. According to the structural parameters of the materials, the materials is a kind of mesoporous carbon with high specific surface areas.
Figure 2. N2 adsorption-desorption isotherm
3.3 Adsorption of phenol on porous carbon materials
3.3.1 Influence of modifier ratio
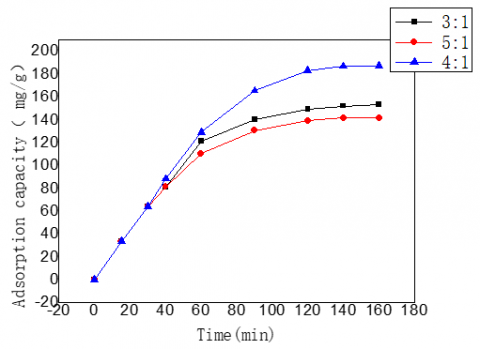
Figure 3 is the analysis of the adsorption capacity of porous materials prepared by different KOH using the ratio of porous materials at a concentration of 4g /L. The adsorption properties of porous carbon materials varied with the carbon/KOH ratio. When the carbon/KOH ratio was 1:3, the saturated adsorption capacity of phenol on porous material was 153. 2mg/g. When the ratio was 1:4, the maximum saturation adsorption capacity of phenol reached 187. 5mg/g, and the adsorption equilibrium time was prolonged to 2. 3h. When the proportion of the use of alkali continued to increase, the saturation adsorption of the material on phenol significantly reduced, which showed that the use of high alkali was not beneficial to the adsorption of phenol. To sum up, carbon/KOH ratio has obvious effect on adsorption of phenol. When carbon/KOH ratio was 1:4, the material has a large number of mesoporous structure and large surface area.
Figure 3. phenol adsorption capacity on porous materials prepared under different carbon /KOH ratio
3.3.2 Adsorption isotherm
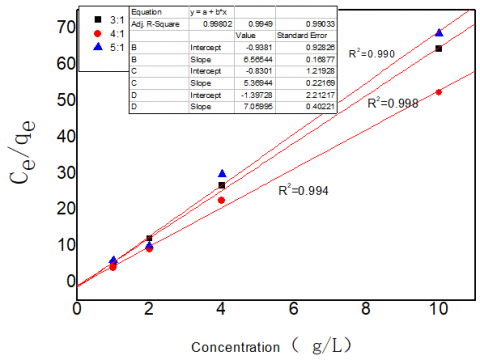
Figure 4 was adsorption isotherms of porous carbon materials on phenol. The characteristics of phenol adsorption on porous carbon materials were analyzed by using the Langmuir adsorption isotherm model (2) .
$\frac{C_{e}}{q_{e}}=\frac{1}{b q_{m}}+\frac{C_{e}}{q_{m}}$ (2)
where QM and B represents the monolayer adsorption capacity and adsorption rate of porous carbon materials respectively. Among them, QM and B were Ce /qe to Ce and the linear slope and intercept calculated.
Adsorption isotherms of porous materials under different carbon/KOH ratio are shown in Figure 4 . It can be seen that the linear correlation coefficient of each isotherm was above 0. 99. The results showed that the adsorption process on phenol with the Langmuir model. This model was applicable to homogeneous adsorbent surface and ignored the single molecular layer adsorption interaction between the adsorbed molecules so that the porous material had not transfer movement of phenol on the each adsorption site , and the adsorption on phenol was single molecular layer adsorption.
Figure 4. Langmuir adsorption isotherms of phenol on porous carbon materials
Different materials on Langmuir adsorption constants of phenol adsorption were calculated by the slope and intercept of the different adsorption isotherms, as shown in Table 3. The data showed that adsorption capacity on phenol of material increased first and then decreased with the increasing of carbon/KOH ratio. When the carbon/KOH ratio was 1:4, the maximum adsorption material of phenol was 191. 23mg/g, which was significantly higher than that of carbon adsorption capacity of 1:3 and 1:5. When the carbon/KOH ratio was 1:3, material had the fastest adsorption rate of 7. 06 L/mg. Adsorption rate of phenol decreased with the increasing of alkali ratio. As can be seen from the Table 3, when the ratio of carbon to alkali is 1:4, the material has the highest adsorption capacity, which further verifies that the ratio of the porous material has better adsorption properties for phenol. The adsorption capacity and adsorption rate were significantly decreased when the ratio of carbon to alkali was 1:5. That is because excessive erosion of the material surface caused by excessive amount of alkali, which result in the specific surface areas of the material decreased significantly and the adsorption performance of phenol significantly reducted.
Table 3. Langmuir isotherm constants for phenol adsorption
|
Sample |
qm (mg/g) |
b (L/mg) |
R |
|
3:1 |
154. 68 |
7. 06 |
0. 998 |
|
4:1 |
191. 23 |
6. 51 |
0. 994 |
|
5:1 |
147. 59 |
5. 04 |
0. 990 |
3.3.3 Adsorption thermodynamics
The study of adsorption thermodynamics can obtain the regular trend and the driving force of the adsorption process. Therefore, it is very important to calculate the adsorption result through the standard thermodynamic function. Based on the thermodynamic equilibrium constant and the Gibbs free energy, enthalpy change and entropy change, the corresponding thermodynamic data can be calculated. The relationships between the thermodynamic equilibrium constant and the thermodynamic function are as follows [13]:
ΔG=-RTlnKc (5. 10)
$\mathrm{K}_{\mathrm{c}}=\frac{C_{0}-C_{e}}{C_{e}}$ (5. 11)
$\ln K_{C}=\frac{-\Delta H}{R T}+\frac{\Delta S}{R}$ (5. 12)
where ΔG is adsorption free energy (kJ mol-1) , R is the gas constan (kJ mol-1K-1) , Kc is equilibrium constant, T is the thermodynamic temperature (K) , C0and Ce is the initial concentration and adsorption equilibrium concentration (mg L-1) , ΔH is adsorption enthalpy (kJ mol-1 ) , ΔS is entropy of adsorption (kJ mol-1K-1) .
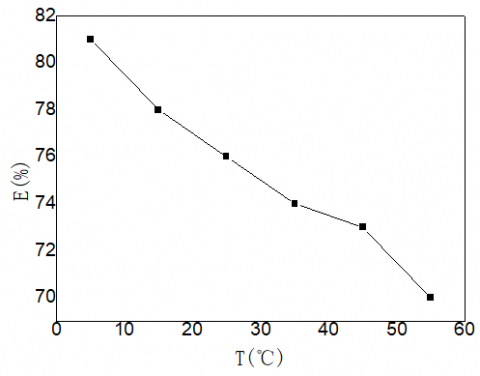
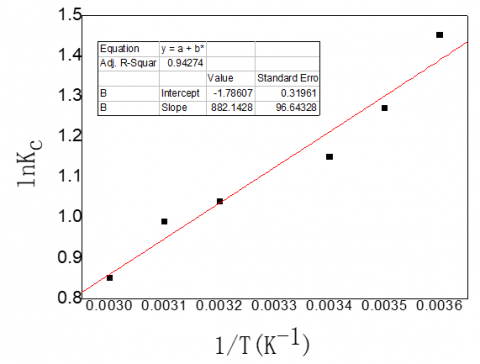
Removal rate of phenol at different temperatures of porous carbon is shown in Figure 5. It can be seen that the removal rate of phenol decreased with the increasing of temperature. The reaction was exothermic reaction. When the temperature was increased from 5℃ to 55℃, the removal rate of phenol decreased by 11%, which showed that the temperature had certain effect on the adsorption of phenol. The linear fitting results of porous carbon adsorption were obtained by the changes of the temperature and the relationship of the thermodynamic equilibrium constant and the Gibbs free energy, enthalpy change and entropy change, as shown in Figure 6 . As can be seen from the graph, the fitting equation is Y=882. 142X-1. 786, R2 is 0. 9427, the experimental result and the fitting degree of the linear equation was higher.
Figure 5. Adsorption of phenol on porous carbon under different temperature
Figure 6. Thermodynamic fitting of porous carbon
Table 4. Thermodynamic parameters of adsorption of phenol on porous carbon
|
concentration (g/L) |
temperature (K) |
ΔG (Kj/mol) |
ΔH (kJ/mol) |
ΔS (kJ/mol) |
|
2 |
278 |
-3. 35 |
-7. 334 |
-0. 015 |
|
288 |
-3. 04 |
|||
|
298 |
-2. 85 |
|||
|
308 |
-2. 66 |
|||
|
318 |
-2. 62 |
|||
|
328 |
-2. 32 |
(1) Porous carbon materials with high specific surface areas were prepared by a combined method of microwave drying, carbonization and activation processes, in which Chinese herb residue was used as carbon source, and KOH was used as activator, respectively. Chinese herb residues was carbonized for 2h at 380℃ . Porous carbon materials were prepared under the carbon/KOH ratio 1:4 at 750 ℃which possessed specific surface areas of 2079. 25m2/g, the mesoporous ratio of 79. 10%.
(2) when carbon/KOH ratio was 1:3, the activation reaction made the material surface contain some mesoporous. Reaction speed increased with the increasing of the amount of KOH, which resulted in the surface of the materials possessed more pore structure. The specific surface areas was the largest when the carbon/KOH ratio was 1:4. Continue to increase the proportion of KOH, the microporous and mesoporous will be excessive ablated, which resulted in decreasing of the specific surface areas.
(3) When carbon/KOH ratio was 4:1, the saturated adsorption capacity of the porous carbon was 187. 5 mg/g. The linear correlation coefficient was 0. 99 of adsorption isotherms. The adsorption process conformed to the Langmuir model, which showed that the adsorption of porous carbon materials on phenol was monolayer adsorption. The adsorption of porous carbon on phenol was physical adsorption on the surface. The adsorption behavior was exothermic and entropy decreasing process.
This work was supported financially by China Tobacco Yunnan Industrial Co., Ltd. (project number: 2013CP02-2014158).
[1] Xu Qigong, Cao Jinling, Gao Rutai, et al., “Trend of water quality deterioration and eutrophication control phases partitioning,” China Environmental Science & Technology, vol. 34, no. 11, pp. 147-151, 2011.
[2] Poinern G.E.J., Senanayake G., Shah N., et al., “Adsorption of the aurocyanide, Au (CN) -2 complex on granular activated carbons derived from macadamia nut shells-A preliminary study,” Minerals Engineering, vol. 24, no. 15, pp. 1694-1702, 2011. DOI: 10.1016/ j.mineng.2011.09.011.
[3] Liu B., Gu J., Qiu P., et al., “Adsorption characteristics of rice husk activated carbon to dye in water and its recovery and utilization,” Acta Scientiae Circumstantiae, vol. 34, no. 9, pp. 2256-2264, 2014. DOI: 10.3969/j.issn.0253-2417.2014.05.005.
[4] Zhou G., “Removal of chloride ion in high salt wastewater by porous iron-carbon-rare earth alloy filler, China,” Chinese Journal of Environmental Engineering, vol. 7, no. 6, pp. 2167-2172, 2013.
[5] Lemos B.R.S., Teixeira I. F., de Mesquita J. P., et al., “Use of modified activated carbon for the oxidation of aqueous sulfide,” Carbon, vol. 50, no. 3, pp. 1386-1393, 2012. DOI: 10.1016/j.carbon.2011.11.011.
[6] Yin C. Y., Aroua M. K. and Wan M.A.W.D., “Review of modifications of activated carbon for enhancing contaminant uptakes from aqueous solutions,” Separation & Purification Technology, vol. 52, no. 3, pp. 403-415, 2007. DOI: 10.1016/j.seppur.2006.06.009.
[7] Karthikeyan S., Boopathy R. and Sekaran G., “Insitu generation of hydroxyl radical by cobalt oxide supported porous carbon enhance removal of refractory organics in tannery dyeing wastewater,” Journal of Colloid & Interface Science, vol. 448, no. 3, pp. 163-174, 2015. DOI: 10.1016/j.jcis.2015.01.066.
[8] Hu J., Tao P., Wang S., et al., “Preparation of highly graphitized porous carbon from resins treated with Cr6+-containing wastewater for supercapacitors,” J. Mater. Chem. A., vol. 1, no. 22, pp. 6558-6562, 2013. DOI: 10.1039/ C3TA00679D.
[9] Xu R. K., Zhao A. Z., Xiao S. C., et al., “Adsorption of methylene blue from water by the Biochars generated from crop residues,” Chinese Journal of Environmental Science, vol. 33, no. 1, pp. 142-145, 2012.
[10] Michio I. and Kang F. Y., Carbon Materials Science and Engineering-From Fundamentals to Applications, Beijing: Tsinghua University Press, 2006, pp. 35-36.
[11] Yan C. Y., Gao P. Z. and Li Y.P., “Preparation and non isothermal oxidation properties of porous carbon with peanut shell as raw material,” Materials for Mechanical Engineering, vol. 14, no. 10, pp. 28-31, 2011.
[12] Rouquerol F., Rouqerol J., Sing K., Adsorption by Powders and Porous Solids, London: Academic Press, 1999, pp. 165-179.
[13] Duranǒglu D., Trochimczuk A. W., Beker U., “Kinetics and thermodynamics of hexavalent chromium adsorption onto activated carbon derived from acrylonitrile–divinylbenzene copolymer,” Chemical Engineering Journal, vol. 187, p. 200, 2012. DOI: 10.1016/ j.cej.2012.01.120.
[14] Li Q., Yue Q. Y., Su Y., et al., “Equilibrium, thermodynamics and process design to minimize adsorbent amount for the adsorption of acid dyes onto cationic polymer-loaded bentonite,” Chemical Engineering Journal, vol. 158, p. 494, 2010. DOI: 10.1016/j.cej.2010.01.033.
[15] Saha P, Chowdhury S, Gupta S, et al., “Insight into adsorption equilibrium, kinetics and thermodynamics of Malachite Green onto clayey soil of Indian origin,” Chemical Engineering Journal, vol. 165: 881, 2010. DOI: 10.1016/j.cej.2010.10.048.