OPEN ACCESS
A statistical theory was introduced with the help of 100 groups of random samples from mechanical laboratory test which would put the membership probabilities of factor under different stable levels objectively. Summarizing the opinions of different experts in mathematical statistics way, the representative weight values are obtained, which can take account of different experts into comprehensive consideration and achieve better results. The findings were applied to evaluate strength of the rock slope in the left bank of Rumei power station in China, and results were able to reflect the slope stability.
slope engineering, probability and statistics, membership, weights, fuzzy evaluation
Processing of the human brain is linked to the gaining of membership functions of any event. A large number of psychological experiments show that it maintains a very close relationship between the human senses of mental activity and the physical nature of the outside world. Due to the existence of the relevance, the cognition of the nature has become better. But the development of different events is determined mostly by its characteristic. Therefore, the description of event’s characteristic is fuzzy because of people’s subjective understanding, so it will bring some disadvantages for the evaluation result of slope stability. Many experts and scholars have dedicated to make the expression of event objective and different for different events. For example in rock slope stability evaluation, the mechanical parameters of rock mass is the decisive factor, but the actual occurrence of rock mass mechanics parameters are extremely discrete, design and construction of the ongoing project cannot be guided by a random test results or experts of some similar engineering [1, 2, 3].
Li Husheng and other experts in the early 1990 s had studied the random-fuzzy statistics, it was concluded that the membership function is formed by mean, variance and covariance of sample of the random-fuzzy statistics. Because of the mean, variance and covariance, random-fuzzy statistics are implicit function, and it can not be calculated without the iteration method, so this is convenient for small sample events, but not for large sample events.
In theory of probability, the probability of event-happening can be obtained through a large number of randomized trials. One basic requirement for randomized trial is that the result of each test must be certain, it means that the result must be A1 or A2, no A1 and A2, if there are two possibilities. Namely, there is no transition state [4, 5].
In reality, the transition state really exists in some phenomenon. Experts and scholars are likely to use digital method to describe the fuzzy state more clearly, but any description based on one random test results is biased, so it’s hard to do the expression of actual events in an objective manner. Therefore a large number of randomized trials are needed to accomplish probability statistics and minimize the errors of the cognition of things.
In n times experiments, the frequency of event A occurring is equal to the ratio between the times of A occurring and n, when n is large enough, the frequency approximates to the probability. The membership degree can be determined with the help of probability; the method is named random-fuzzy probability statistics including the following four elements: Universe U; a fixed element u0 belongs to U; a random motion set A* (general set) belongs to U; one of the sets A* belongs to U as elastic boundary fuzzy set A^ restricts the movement of A * [6].
In order to get the rock mass comprehensive strength for geotechnical engineering, in the way of random-fuzzy probability statistics, the following concepts should be introduced:
Stylebook domain: universe U is composed of n elements u0, randomly chosen different rock mass with physical and mechanical parameters.
Level or standard domains: it is also called classification standard in geotechnical engineering. The physical and mechanical parameters of rock mass are divided into different levels, each level to form a random movement set A*, the upper and lower limit value as the elastic boundary restricts the set of movement.
The actual occurrence domain: the value of stylebook domain which is close to upper and lower limits of standard domains, forming a set which will further restrict the set of movement.
In n time randomized trial results, membership frequency of u0 to A^ is equal to the ratio between the number belongs to A* and n, named r0. Membership degree matrix R is formed under the different levels of membership frequency.
$R=\left[\begin{array}{cccc}r_{11} & r_{12} & \cdots & r_{1 m} \\ r_{21} & r_{22} & \cdots & r_{2 m} \\ \vdots & \vdots & & \vdots \\ r_{n 1} & r_{n 2} & \cdots & r_{n m}\end{array}\right]$ (1)
Membership matrix R in the fuzzy evaluation system is also called fuzzy relations, $R \in \mu_{n \times m}$. The fuzzy evaluation system is adjudicated by a set F of the rock physical and mechanical parameters.
Effective domain: it is a new domain formed by the product of the boundary values and corresponding membership frequency, it represents actual maximum membership and the minimum membership of the actual occurrence domain.
Composite rock mass strength values: it means that the sum value of the boundary values of effective domain. It is also the forms the upper limit and lower limit strength of the rock mass.
The obtaining method of mass comprehensive parameters value as follows:
$\begin{array}{ll}\mathrm{Z}_{\max }=\Sigma \mathrm{u}_{\operatorname{maxi}} \bullet \mathrm{r}_{\mathrm{i}} & \mathrm{i}=1,2,3,4 \\ \mathrm{Z}_{\min }=\sum \mathrm{u}_{\operatorname{mini}} \bullet \mathrm{r}_{\mathrm{i}} & \mathrm{i}=1,2,3,4\end{array}$ (2)
The comprehensive strength values range for this parameter is ($\mathrm{Z}_{\min }, \mathrm{Z}_{\max }$). The average value is:
$Z^{*}=\left(Z_{\min }+Z_{\max }\right) / 2$ (3)
Different mass parameters are not equally important so the weighted process should be allocated by using $A=\left(a_{1}, a_{2}, \cdots, a_{n}\right)$ of a set F to make every factor’s weight clear, and then form evaluation matrix R, therefore, the comprehensive evaluation model is as following:
$R \bullet A=B=\left(b_{1}, b_{2}, \cdots b_{n}\right)$ (4)
Among them$A=\left(a_{1}, a_{2}, \cdots, a_{n},\right), \sum_{i=1}^{n} a_{i}=1, a_{i} \geq 0$, $R=\left(r_{i j}\right)_{n \times m}$, $r_{i j} \in(0,1)$, $b_{j}=\sum_{i=1}^{n} a_{i} r_{i j}, j=1,2, \cdots m$, $b_{j}$ is an evaluation function of $r_{1 j}, r_{2 j}, \cdots r_{n j}$ [7].
For rock mass, the discrete characteristics just meet the motility of random trials; the random-fuzzy probability statistics method avoids the disadvantage of the adverse advice to recognize the rock mass provided by experts with their engineering experiences.
Control river basin area of Rumei Hydropower Station is 79400 km2, average flow rate is 653 m3/s for many years, annual average run off volume is 20.6 billion m3, so the dam type is levee. Normal storage level at the beginning is proposed to 2895 m, the height of the head in the front of the dam indicates 279 m, the total capacity is 3.602 billion m3, the height of the dam is 315m, the installed capacity is 2100MW, the hub arrangement of the dam is composed of core wall rock-fill dam on the left bank, diversion system + underground powerhouse on the right bank, open type spillway, flood discharge tunnel on the left bank, hole, etc.
High rock slope is the main geological environment in the mountain hydropower station construction, especially in the western region of China; it is one of the key technical problems of high slope projects, which controls feasibility and economic benefits of the project. The engineering geological conditions are complex, the high slope stability problems and governance after the construction of high dam in deep canyon area are inevitable and will become the controlling factors to influence the engineering construction and investment, so the research is necessary for the project analysis.
Two profiles were randomly selected from the left bank of dam site. Firstly, the flat holes named PD1 and PD5 were chosen from the middle of dam site and secondly, the flat holes named PD15, PD17, PD19 were chosen from lower dam site. The profile and flat hole distribution is shown in figure 1. Physical and mechanical test results were randomly chosen from 100 groups of samples from the five flat holes in a different depth to get the rock mass deformation modulus, cohesive force, internal friction angle and water absorption samples. The research of samples will help to know the comprehensive strength of the rock and get a useful recommended value of rock mass parameters to calculate the slope stability.
Figure 1. Two typical profiles on the left bank
3.1 Probability and membership
Fuzzy mathematics and probability theory have substantial differences. Due to the lack of information of real project there is uncertainty in determining the project conditions. Probability theory studies the random phenomenon and fuzzy mathematics studies fuzzy phenomenon. They are aiming at researching uncertain phenomenon, with similar method, this makes it possible to apply sophisticated statistical methods of probability theory to the fuzzy math, forming a fuzzy statistical method to learn the unclear bound things. Membership is the concept that proposed by one of phenomenon’s compositions proportion issues, this blooming can be defined by considering and statistics methods. Although the results remain vague, it is more reliable than the subjective judgment.
Threshold value of the following four factors match with slope stability on different levels drawn from reference literature [7, 8], called boundary value of the level domain, Statistics as in table 1:
Table 1. Classification Standard region
|
Level |
Deformation modulus (GPa) |
Cohesion(MPa) |
tan(φ) |
Water absorption(%) |
|
I |
≥56 |
≥0.25 |
≥1 |
≤0.25 |
|
II |
56~18 |
0.25~0.15 |
1~0.7 |
0.25~0.5 |
|
III |
18~1.8 |
0.15~0.045 |
0.7~0.27 |
0.5~0.75 |
|
IV |
≤1.8 |
≤0.045 |
≤0.27 |
≥0.75 |
Data from 100 groups of samples were randomly selected from the flat holes of medium damsite and lower damsiteand sorted in ascending order.
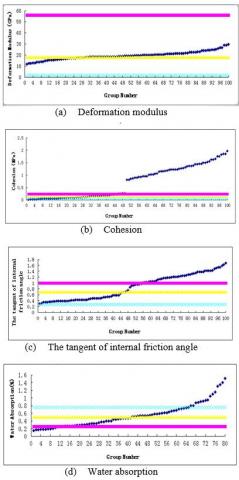
Figure 2. Randomized mechanical test results of different parameters in 5 flat holes
In the figure 2, the horizontal lines are the upper and lower limits of the mechanical parameters at different level domain, which are adopted from table 1. The curves are the mechanical parameters of sample values.
The figure can reflect the discreteness of mechanics parameters, the water absorption parameter is the most scattered one, distributed in four levels domain, followed by the cohesive force and tangent value of internal friction angle, distributed in three level domain, the deformation modulus of the discrete relative is not obvious. Combining the classification of standard domain, we can count corresponding sample statistics according to different level domain, reflect its membership through the probability of sample under this level. The results are shown in table 2:
Table 2. Frequency distribution and effective regions of different parameters under different levels
|
Deformation Modulus |
The Tangent of Internal Friction Angle |
|||||||||||||||
|
Level |
Level domain |
The actual occurrence domain U’ |
Fre-quency |
Membership probability r |
Effective region (Z=U’*r) |
Level |
Level domain |
The actual occurrence domain U’ |
Fre-quency |
Membership probability r |
Effective region (Z=U’*r) |
|
||||
|
I |
≥56 |
0 |
0 |
0 |
0 |
I |
≥1 |
1.01~1.68 |
46 |
0.46 |
0.46~0.77 |
|
||||
|
II |
56~18 |
18.2~29.8 |
72 |
0.72 |
13.10~21.46 |
II |
1~0.7 |
0.71~0.97 |
9 |
0.09 |
0.07~0.09 |
|
||||
|
III |
18~1.8 |
11.66~18 |
28 |
0.28 |
3.26~5.02 |
III |
0.7~0.27 |
0.29~0.69 |
45 |
0.45 |
0.13~0.31 |
|
||||
|
IV |
≤1.8 |
0 |
0 |
0 |
0 |
IV |
≤0.27 |
0 |
0 |
0 |
0 |
|
||||
|
Cohesion |
Water Absorption |
|||||||||||||||
|
Level |
Level domain |
The actual occurrence domain U’ |
Fre-quency |
Membership probability r |
Effective region (Z=U’*r) |
Level |
level domain |
The actual occurrence domain U’ |
Fre-quency |
Membership probability r |
effective region (Z=U’*r) |
|
||||
|
I |
≥0.25 |
0.26~1.98 |
55 |
0.55 |
0.14~1.09 |
I |
≤0.25 |
0.15~0.25 |
12 |
0.15 |
0.02~0.04 |
|
||||
|
II |
0.25~0.15 |
0.16~0.22 |
14 |
0.14 |
0.02~0.03 |
II |
0.25~0.5 |
0.27~0.48 |
30 |
0.3752 |
0.10~0.18 |
|
||||
|
III |
0.15~0.045 |
0.05~0.15 |
31 |
0.31 |
0.02~0.05 |
III |
0.5~0.75 |
0.51~0.74 |
24 |
0.3 |
0.15~0.22 |
|
||||
|
IV |
≤0.045 |
0.02~0.04 |
0 |
0 |
0 |
IV |
≥0.75 |
0.75~1.51 |
14 |
0.175 |
0.13~0.26 |
|
||||
Probability of deformation modulus in sample domain field in Class I and Class IV level is 0, deformation modulus mainly concentrates in the class II and III level. The most of the rock masses deformation modulus is at class II level and the probability is 0.72. Deformation modulus comprehensive parameter calculated by equation (2), ranges between 16.37 and 26.48 with average value of 21.42. The average value obtained from laboratory sample test for deformation modulus is 19.48which is shown in figure 2(a). and is the integrated average of all samples.
Probability that cohesive force in sample domain field in Class IV level is 0, they are mainly distributed in the class I, class II and III level, the probabilities are 0.55, 0.14 and 0.31, this shows the value of cohesion is more favourable for slope stability. Their comprehensive parameters are in the range of (0.18, 1.17), the theoretical average value is 0.675. The experimental average value of sample is 0.72.
Probability that tangent value of Internal friction Angle in sample domain field in Class II and Class IV level is almost 0, they are mainly distributed in Class I and Class III level, the probabilities are 0.46 and 0.45. Internal friction angle value is not conducive to slope stability. Its comprehensive parameter are in the range of (0.659, 1.17), the theoretical average value is 0.91. The experimental average value of sample is 0.86.
Discreteness of the moisture content in sample domain is most obvious, because the probability distribute in every level, which is due to the reason that moisture content occurred in the rock masses also related to rock fracture and porosity. Moisture content has a greater impact on the mechanical parameters of rock, and plays a role in the deterioration of the rock from the aspects of physics and chemistry. Its comprehensive parameter are in the range of (0.41, 0.70), the theoretical average value is 0.56. The experimental average value of sample is 0.54.
The parameters derived by random fuzzy probability statistics considering subordinate probability of rock parameters reflects more effectively the actual strength of rock parameters .The theoretical value is close to the experimental value .The modulus of deformation comparatively approach 20GPa that is provided for type II rock in the project; cohesion is close to 0.7MPa that is provided for type IV rock in the project; internal friction angle is close to 1 that is provided for type III rock; the tangent in project , represents the parameters of the entire slope because samples were obtained from the actual engineering sites .In the case of sufficient information and targeted sampling , valid parameter values for different classes of rock can be obtained . y the above factors probability distributions under the different levels, the matrix can be expressed as:
$R=\left[\begin{array}{cccc}0 & 0.55 & 0.46 & 0.15 \\ 0.72 & 0.14 & 0.09 & 0.375 \\ 0.28 & 0.31 & 0.45 & 0.3 \\ 0 & 0 & 0 & 0.175\end{array}\right]$ (5)
3.2 Probability and weight
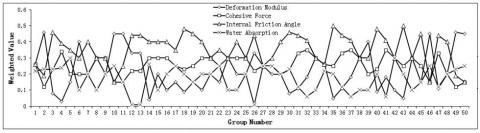
In view of the deformation modulus, cohesive force, internal friction angle and moisture content, the four parameters of rock mass, occupy an important position in the slope stability, viewing the relevant information and consulting experts, its statistical weight distribution is shown in the figure3.
Figure 3. Weighted values from reallocation Statistics
Table 3. Weighted frequency distribution and the consolidated weight distribution
|
The intervals |
0-0.1 |
0.1-0.2 |
0.2-0.3 |
0.3-0.4 |
0.4-0.5 |
The weighted average and normalized
|
|||||
|
|
Fre- quency |
Membership probability (p1) |
Fre-quency |
Membership probability (p2) |
Fre-quency |
Membership probability (p3) |
Fre-quency |
Membership probability (p4) |
Fre- quency |
Membership probability (p5) |
|
|
Deformation Modulus |
11 |
0.22 |
20 |
0.4 |
8 |
0.16 |
5 |
0.1 |
6 |
0.12 |
0.22 |
|
Cohesion |
0 |
0 |
12 |
0.24 |
31 |
0.62 |
7 |
0.14 |
0 |
0 |
0.26 |
|
The Tangent of Internal Friction Angle |
0 |
0 |
5 |
0.1 |
16 |
0.32 |
10 |
0.2 |
19 |
0.38 |
0.34 |
|
Water Absorption |
15 |
0.3 |
18 |
0.36 |
17 |
0.34 |
0 |
0 |
0 |
0 |
0.18 |
The pi is the membership probability.
Four factor weights allocation are concluded by normalization processing.
The weights consider the importance of a factor in the slope, from the comprehensive analysis of the various experts, the weight should avoid the distortion of results on the individual experts subjective mistakes. The weight matrix of deformation modulus, cohesive force, internal friction angle and moisture content is as following:
$A=\left[\begin{array}{lllll}0.22 & 0.26 & 0.34 & 018\end{array}\right]$ (7)
3.3 Comprehensive evaluation system of rock mass parameters on the left bank slope of Rumei hydropower station
The basic theory of fuzzy evaluation system is fuzzy mathematics, and the four key elements are factor, grading standard, weight, and membership matrix.
Therefore, the assessment results obtained from the random field test samples on left bank slope of Rumei hydropower station is:
$B=R \bullet A=\left[\begin{array}{cccc}0 & 0.55 & 0.46 & 0.15 \\ 0.72 & 0.14 & 0.09 & 0.375 \\ 0.28 & 0.31 & 0.45 & 0.3 \\ 0 & 0 & 0 & 0.175\end{array}\right] \cdot\left[\begin{array}{c}0.22 \\ 0.26 \\ 0.34 \\ 0.18\end{array}\right]=\left[\begin{array}{c}0.33 \\ 0.29 \\ 0.35 \\ 0.03\end{array}\right]$ (8)
The calculated result shows that the level I, II, III and IV rock mass comprehensive strength are proportional to 33%, 29%, 35% and 3% respectively.
According to the principle of maximum membership degree, the slope rock mass parameter of this area is generally at the level III. Butfor the strength of this Slope rock mass parameter, level I takes up the vast proportion, and the level IV element only accounts for 3%.Thus, the Principle of maximum membership degree can not absolutely reflects the true slope rock mass parameters level. By calculating the comprehensive strength value, the evaluation result of all levels intensity components can be better reflected. And the formula is:
$B^{*}=\sum_{i=1}^{4} b_{i} \cdot i$ (9)
$B^{*}$ is a value larger than 1and less than 4. It is assumed rock mass parameters comprehensive level is higher when $B^{*}$ is closer to 1, the level of comprehensive rock mass parameters is lower when $B^{*}$ is closer to 4.
The comprehensive strength of the left bank slope of Rumei hydropower station concluded by evaluation of rock mass parameters is:
$B^{*}=\sum_{i=1}^{4} b_{i} \cdot i=0.33 * 1+0.29 * 2+0.35 * 3+0.03 * 4=2.09$ (10)
Since 2.09 is bigger than 2 and less than the average 2.5, the slope rock mass parameters is nearly at level II. The slope has certain ability to resist outside interference, it accords with the geological survey, the actual situation and RMR rock mass quality evaluation result.
By statistically analyzing the random samples, focusing on analyzing the discrete factor from different level frequency distribution, the subordinate probabilities can better reflect the actual probabilities, compared to the formula method.
For the random samples, the whole evaluation of the samples is representative in some degree; the deviation has been reduced effectively. The proposed value for the deformation modulus of sample is 21.42GPa , the cohesive force of the sample is 0.675MPa, the internal friction angle of sample is 0.91, moisture content of the sample is 0.56.
The weight value has some deviation, as it is mostly based on experts experience or the sensitive analysis under limited condition. Every project has its own futures and every expert emphasises on different points, thus, by making comprehensive evaluation of different experts suggestions, the subjective deviations can be reduced effectively.
By using the random-fuzzy probability statistical method, the comprehensive assessment of the hydropower station’s left bank slope rock mass parameters is 2.09.
Suggestion: For the single project, by analysing the samples from different rock stratum, material parameters and recommended values of different rock stratum can be obtained.
Limitation: Due to the limitation of data the evaluation is not based on sufficient elements. It has analyzed the four typical factors which influence the stability of the side slope, in fact, the form of the ground and its distribution also have obvious effect on the stability of the side slope. Therefore, if condition permits, more elements should be taken into consideration.
[1] Liu Z. Q., Huang H. W., Xue Y. D., Li G., “Research on hazard assessment and mitigation measure of talus slope,” (in Chinese), Chinese Journal of Underground Space and Engineering, vol. 3, no. 8, pp.1472-1489, 2007. DOI: 10.3969/j.issn.1673-0836.2007.z2.022.
[2] Liu D. L., Thaml G., Lee P.K.K., Tsuiy, Wang Y. H., “The stability of rock slope and fuzzy comprehensive evaluation method,” (in Chinese), Chinese Journal of Underground Space and Engineering, vol. 18, no. 2, pp. 170-175, 1999. DOI: 10.3321/j.issn:1000-6915.1999.02.012.
[3] Zhang X. H., Wang H., Dai F. C., “Comprehensive evaluation of slope stability using interaction matrix and fuzzy sets,” (in Chinese), Chinese Journal of Rock Mechanics and Engineering, vol. 19, no. 3, pp. 346-351, 2009. DOI: 10.3321/j.issn:1000-6915.2000.03.020.
[4] Wen S. Y., Li J. L., Yang X. T., “Multi level fuzzy comprehensive evaluation of stability analysis of unloading high slope,” (in Chinese), Rock and Soil Mechanics, vol. 27, no. 11, pp. 2041-2044, 2006. DOI: 10.3969/j.issn.1000-7598.2006.11.037.
[5] Li H. G., Fuzzy Mathematical Basis and Practical Algorithm, (in Chinese), Beijing: Science press, 2005.
[6] Liu J., Li J. L., Hu H. L., Zheng T., Wang X. H., “Study on fuzzy evaluation method of rock slope stability based on finite element analysis,” (in Chinese), Chinese Journal of Rock Mechanics and Engineering, vol. 26, no. 8, pp. 3438-3445, 2007, S1. DOI: 10.3321/j.issn:1000-6915.2007.z1.129.
[7] Wan L. P., Liu J., Zhao Z. Y., Dong Y. H., Cheng Z., “Layered sensitivity analysis and weight determination of rock slope stability impacting factors,” (in Chinese), Water Resources and Hydropower Engineering, vol. 43, no. 3, pp. 59-62, 2012. DOI: 10.3969/j.issn:1000-0860.2012.03.016.
[8] Li J. L., Wang L. H., Liu J., Rock Slope Engineering (in Chinese). Beijing: China Water Power Press, 2006.