Lin Xie | Donald W. Kirk*
OPEN ACCESS
Robust anionic exchange membranes (AEMs) are needed for alkaline fuel cells (AFCs) [1]. To convert the as-produced AEMs to hydroxide form, conventionally an one step high alkalinity 1-2M alkaline solution for 24 - 48hrs is used [1]. However, this high alkalinity process will be shown to limit the ion exchange capacity and reduce long term viability of the AEMs. To investigate the degradation process, short-term activation and long- term stability of 3 AEMs were studied. Short-term degradation was found to be caused by the high concentration of hydroxide ions in the initial conversion process. Long-term degradation was found to be caused by the substituted hydroxide ions which caused gradual loss of conducting species from the membrane. A modification of the conventional one step high alkalinity process was developed to mitigate this membrane degrada- tion. This modified process used multi-step low alkalinity conversion stages. Three types of commercial AEM products from Fumatech (FAS-PP- 75, FAA-3-PK-130, and FAD-55) were compared with both the conventional and modified processes. The results showed that the multistep low alkalinity process improved the initial membrane performances by at least 20%. The long-term stability was substantially enhanced for FAS-PP-75 and FAA-3-PK-130.
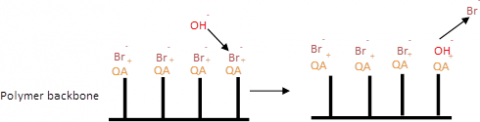
The application of anionic exchange membranes for alkaline fuel cells (AFCs) has gained ground in the last decade. Most AEMs are synthesized with halogen counter anions (Br- or I-), which need to be converted into hydroxide forms for alkaline fuel cell applications [1] [2] [3]. Ideally, the hydroxide conversion process is solely the ex- change of the initial counter anions (Br- or I-) for the hydroxide ions from the solution to the membrane [1] [4] [5]. Due to stronger binding forces, the hydroxide ions replace the counter anions and form ionic bonds with the quaternary ammonium groups (QA) on the polymer backbone [1], as shown in Fig. 1.
Figure 1. The ideal hydroxide conversion process for AEMs
This ion exchange process can be summarized in equation (1).
$-O A^{+} B r_{(s)}^{-}+O H_{(a q)}^{-} \rightarrow-O A^{+} O H_{(o)}^{-}+B r_{(a q)}^{-}$ (1)
The degree of conversion refers to the extent of the above reaction. To drive the ion exchange process as described in Eqn. (1), a single step high alkalinity process is conventionally applied which leaves the AEMs in 1-2M alkaline solutions for 24-48hrs [1]. As will be shown, such high concentrations may cause polymer degradation. The degra- dation due to hydroxide refers to the nucleophilic attack of the QA groups by hydroxide anions. This process includes various mecha- nisms such as Hofmann elimination and β hydrogen substitution, which have been intensively studied by AEM researchers [1] [2] [6] [7].
In this study, the degradation was divided into two categories, short- term degradation and long-term degradation, according to the period when the hydroxide attack occurs. As shown in Fig. 2, during the con- version process, the QA groups can be attacked by the hydroxide ions from the activation solutions, and is referred to as short-term degrada- tion. Short-term degradation is the major concern for a highly alkaline conversion process because of the concentration of the hydroxide ions. Many QA sites may be degraded during hydroxide conversion process and thus the initial performance may be compromised.
Figure 2. Hydroxide degradation at different stages
In the working fuel cell environment, QA groups can be attacked by the substituted OH- ions, and this is referred to as long-term degradation. For AEMs with adequate alkaline resistance, there should be little long-term degradation. For AEMs with weak resistance, this long-term degradation may be manifest by decreasing electrochemical conduction over time.
For the conventional conversion process, high alkaline concentra- tions are used to drive forward the hydroxide exchange reaction. We investigated whether a lower concentration alkaline solution (≤0.2M NaOH) could be beneficial for preserving the AEM performance. Since lower alkaline concentrations may reduce the conversion rate, the alka- line solutions were replenished several times to reset the ion exchange equilibrium. The amount of counter anions released was measured to evaluate the completeness of the exchange process.
Three types of commercial AEMs with different levels of alkaline resistance were subjected to both the conventional process (1M NaOH 24 hrs) and the low hydroxide process. To analyse the performance loss due to short term degradation, hydroxide conversions were measured in terms of both ionic conductivity and ion exchange capacity (IEC) im- mediately after the conversion. To evaluate the loss due to long-term degradation, AEM samples were stored in deionized (DI) water. IEC and conductivity data were tested over a 20-day period.
2.1. Materials
Sodium bromide (99.5% Analar), sodium hydroxide (98.8% Fisher Scientific), silver nitrate (99% EMD), phenolphthalein (Analar), hydrobromic acid (48%, ACP), nitric acid (70% Sigma-Aldrich), bromine (99.5%, Sigma-Aldrich), deionized water (18M, Milli-Q) were used.
2.2. Anion exchange membranes
Three types of AEMs, Fumasep® FAA-3-PK-130, FAS-PP-75, FAD-55, were selected from Fumatech Co. based on different levels of alkaline resistance. The following table summarizes their key properties from the supplier [8],
FAA-3-PK-130, with a strong alkaline resistance, is designed for alkaline fuel cells or electrolysers; FAS-PP-75 is a newly developed product with medium alkaline resistance; FAD-55 is sensitive to alkali and it is designed for an environment with pH 8 or lower conditions.
2.3. Conventional single step hydroxide conversion process [1]
3cm * 3cm AEM samples (FAS-PP-75) were immersed in 50ml of 1M NaOH solution for 4, 6, 12, and 24 hrs. Each sample was washed and rinsed with deionized (DI) water until the water showed no alkalin- ity using a phenolphthalein indicator. The same process was repeated with lower concentrations of NaOH (0.5M, 0.2M, and 0.02M). Conversion extent was measured and compared in terms of IEC.
2.4 Modified hydroxide conversion process
3cm * 3cm AEM samples (FAA-3-PK-130, FAS-PP-75, or FAD-55) were immersed in 50 mL of 0.02 or 0.2M NaOH solution (0.02M for FAD-55 and 0.2M for the FAA-3-PK-130, FAS-PP-75,). The alkaline solution was replenished on a daily basis. A Br- selective electrode was used to determine the released Br- ion concentration from each alkaline conversion test. When no Br- could be detected, the converted samples were washed and rinsed with DI water until the droplets from the sam- ples showed no alkalinity with a phenolphthalein indicator.
To determine the influence of agitation in the conversion, ultrasoni- cation was applied to the FAD-55 conversion process above. The alkaline solutions with the AEM samples (3cm*3cm) were ultrasonicated by a sonicator (Cole-Parmer 8851) at 47kHZ for 5, 6, 7, 9, and 11 hours. The 0.02M NaOH solutions were replenished at each hour.
Table 1. AEM sample properties
|
|
Counter anion |
IEC (Br-) |
pH range |
|
FAA-3-PK-130 |
Br- |
1.42 |
0-14 |
|
FAS-PP-75 |
Br- |
1.42 |
0-12 |
|
FAD-55 |
Br- |
2.3 |
0-8 |
2.5. $ \mathbf{B r}^{-}$ determination
An Ag/AgBr electrode was used to measure the amount of Br- ions in a solution, applying the Nernstian behaviour as shown in equation 2.
$A g B r+e^{-} \leftrightarrow A g+B r^{-} \\ E_{o}=0.07 \mathrm{V} vs SHE \quad E=E_{o}+\frac{R T}{n F} \ln \left(B r^{-}\right)$ (2)
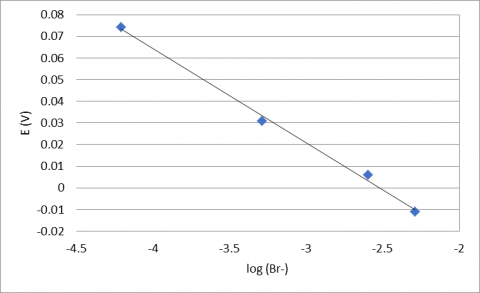
The used alkaline solution was neutralized by 1M nitric acid using a pH meter as an indicator. The overall solution volume was diluted to 100 ml in a volumetric flask. Two electrodes were placed in a sample of the solution. An Ag/AgBr electrode was used as the working elec- trode and an Ag/AgCl electrode was applied as the reference electrode. The open circuit potential (OCP) value was measured by a potentiostat to determine the amount of released Br- ions using the calibration curve (Fig.3) determined for this system.
Figure 3. Br- calibration curve versus Ag/AgCl reference electrode
By collecting and quantifying the Br- ions from each day of the hydroxide conversion process, the total amount of Br- ions released from each membrane sample was determined. A detailed description is provided in the supplementary document.
2.6. IEC determination [9]
A back-titration technique was used to determine the IEC values from the tested samples. The converted samples were dried and weighed. Each sample was immersed in 30ml of 0.006M HBr, prepared from hydrobromic acid (48%, ACP) for 48 hours. With a phenolphtha- lein indicator, a 0.006M standard NaOH solution, prepared from sodi- um hydroxide (98.8% Fisher Scientific), was used to titrate another 30ml HBr solution. The hydroxide consumption X ml was the background value. After 48 hours, the sample was removed and the remained acid was titrated with Y ml of NaOH to provide the hydroxide consumption. The IEC value was determined as IEC = (X-Y)*0.006M/sample mass (mmol/g).
2.7. Conductivity measurement
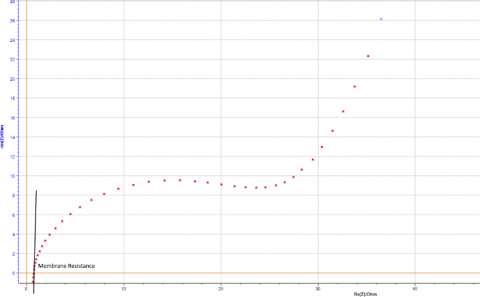
The ionic conductivities were measured by electrochemical imped- ance spectroscopy (EIS) analyses. The AEM samples were assembled between two electrodes. The structure was immersed in DI water to ensure 100% humidity. EIS measurements (Fig.4) were taken with a VSP-300 potentiostat from Bio-Logic Co.. The scan rate ranged from 2 MHz to 10 Hz.
Figure 4. Nyquist plot from an AEM membrane EIS measurement. The membrane resistance of a membrane sample can be measured from the Nyquist plot where the impedance plot intercepts with the real axis
The ionic conductivity values were obtained from the following equation.
$\sigma=\frac{l}{A R}$ (3)
2.8. Long-term performance analysis
To analyse the degree of conversion degradation, hydroxide convert- ed AEM samples were kept in a sealed vessel having 50 mL of DI wa- ter. Both IEC and conductivity values were measured at specific times for up to 21 days. Samples used for back titration (IEC analysis) could not be reused and thus a series of AEM samples were tested. These were converted in the same process and same initial conditions.
In literature, there have been reports that suggest CO2 from air can affect the conductivity of an AEM. To determine whether this was a significant effect in the current measurements, dry air with its ~400ppm CO2 content was bubbled through the DI water vessel for 6 hrs at 1L/min. No change in the EIS conductivity measurements could be detected. Since the IEC tests were done in a sealed vessel the influence of CO2 was not considered to be significant.
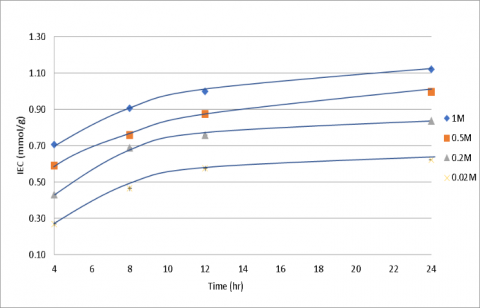
FAs-PP-75 samples underwent hydroxide conversion processes with various time and concentration conditions. The initial conversion performances were determined by hydroxide IEC values as shown in Fig.5.
From the data in Fig. 5, it is clear why the conventional high alkalinity conversion is recommended. The highest IEC was obtained with this approach. Higher alkalinity achieves a higher degree of conversion within the same time period. The results also demonstrate that all conversion curves approach equilibria. This indicates an OH-/Br- ion exchange equilibrium between the QA sites and the alkaline solution, as described in Eq. (4).
$-Q A^{+} B r_{(s)}^{-}+O H_{(a q)}^{-} \leftrightarrow-Q A^{+} O H_{(s)}^{-}+B r_{(a q)}^{-} \\ Kep=\ln (\frac{Br\bar{(}aq)}{OH\bar{(}aq)})$ (4)
Figure 5. FAS-PP-75 conventional hydroxide conversions performances. The conversion performances (IEC) obtained with 1M, 0.5M, 0.2M, or 0.02M NaOH conversion for different conversion time
Figure 6. FAS-PP-75 hydroxide conversions performances (IEC) with 1M NaOH conversion for 4-72 hrs
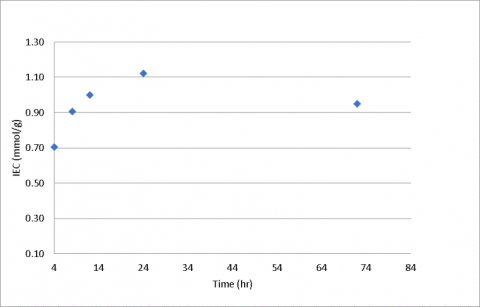
Higher hydroxide solution concentrations push the equilibrium to- wards the products resulting in higher IEC values. Therefore, higher alkaline concentrations appear more favourable for the AEM activation process. This is also supported by the fact that most AEM researchers g. 8. FAA-3-PK-130 hydroxide conversion itial performances (IEC) use a 1-2 M alkaline solution for a 24-48 hrs activation process [1] [10] [11] [12].
On the other hand, these high alkalinity conversion processes may also cause hydroxide degradation if the membrane’s alkaline resistant is not strong enough. As shown in Fig.6, by extending the conversion time to 72 hrs, the IEC value of FAS-PP-75 decreased to 0.97 mmol/g from 1.11 mmol/g. This demonstrates that the short-term hydroxide degradation can occur during an extended conversion period.
3.2. A modified hydroxide conversion process
A modified hydroxide conversion process was developed to mitigate the degradation due to hydroxide. A low concentration (i.e. 0.2M) alka-line solution was used in the activation process while the activation solution was replenished to avoid reaching conversion equilibrium. Bromide ion detection in the leach solution was used to determine the extent of conversion. The conversion parameters such as concentration and replenishment frequency were modified for specific membrane samples.
As shown in table 2, the AEM samples were considered as fully hydroxide converted when there was no Br- detected in the leach solutions. The FAS-PP-75 conversion was found to be complete after 7 days using 0.2M NaOH solutions. FAA-3-PK-130’s conversion process took 9 days using 0.2M NaOH solutions. Under lower alkaline condi- tions 0.02M NaOH solutions, the FAD-55 conversion took 9 days.
Table 2. Initial IEC conversion performances from the modified process
|
IEC |
FAS-PP-75 |
FAA-3-PK-130 |
FAD-55 |
|
IEC (Br-) (mmol/g) |
1.42 |
1.42 |
2.3 |
|
Conversion |
0.2M 7 days |
0.2M 9 days |
0.02M 9 days |
|
Released Br-(mmol/g) * |
1.41 |
1.33 |
2.25 |
|
Converted IEC (OH-) (mmol/g) |
1.40±0.031 |
1.32±0.031 |
1.81±0.028 |
* Released IEC (Br-) measurements were included in the supplementary document
From the table, the amounts of released Br- are close to the IEC (Br-) values. This indicates that the Br- ions which were initially bound on the membrane samples have been exchanged by hydroxide ions.
3.3. Initial IEC measurements comparison
In Fig.7, comparing 1M NaOH, 24hr with 0.2M NaOH, 7 days, the FAS-PP-75 membrane achieved a 20% higher IEC value. The IEC values achieved under the lower alkalinity conditions also approached the expected manufacturer’ values. These results demonstrate better conversion or mitigated short-term hydroxide degradation using lower alkalinity conversion conditions.
Figure 7. FAS-PP-75hydroxide conversion initial performances (IEC)
Figure 8. FAA-3-PK-130 hydroxide conversion initial performances (IEC)
Figure 9. FAD-55 hydroxide conversion initial performances (IEC)
The FAA-3-PK-130 membrane has higher alkalinity resistance but the conventional hydroxide conversion process produced a poor IEC result (Fig.8). The reason appears to be the difficulty in exchanging OH- for Br- as seen by the data in table 2. Using the modified process, the frequent replenishment of the alkaline solutions even with lower hydroxide concentration resulted in an enhancement of by 30% compared to the conventional conversion.
The effect of membrane susceptibility to alkaline conditions is clear- ly seen in Fig.9 with the least resistant membrane FAD-55. The 1 M 24h conversion process produced the greatest loss in IEC of ~45%. Although the modified process was performed with only 0.02M NaOH solutions, there was short-term degradation, causing a loss of 22% IEC from the manufacturer’s data. It is clear that alkaline resistance is needed for AEMs to be converted from their Br- form to OH- form.
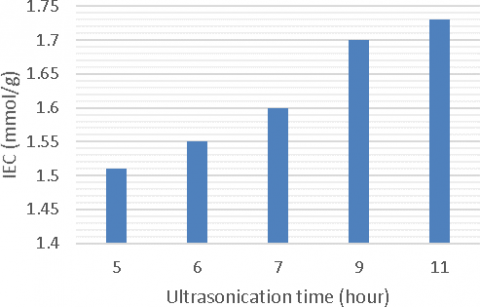
To determine whether enhanced agitation might be used to accelerate the hydroxide conversion process, ultrasonication was applied. Ultra- sonication should facilitate the interaction between ionic species and possibly accelerate the anionic exchange process. As shown in Fig. 10., by ultrasonicating the solutions and replenishing the 0.02M NaOH solutions every hour, the IEC values of FAD-55 were increased. No released Br- was detected from the alkaline solution after 11 hours soni- cation, indicating the endpoint of the conversion process. Therefore, the ultrasonication process reduced the conversion period from 9 days to 11 hours but the IEC value was only 1.73 mmol/g, which was less than 1.81 mmol/g that the 9 days conversion produced. The same ultrasoni- cation process was applied and repeated to FAA-3-PK-130 until no Br- was detected in the alkaline solutions. The achieved IEC value was 1.3 mmolg/g which was the same as the 9 days conversion result shown in table 2. This suggested that the ultrasonication can be an effective method to speed up the AEM hydroxide conversion process but it may exaggerate hydroxide degradation, depending on the membrane’s alka- linity resistance.
Figure 10. FAD-55 modified conversion performances (IEC) with different ultrasonication periods
3.4. Initial ionic conductivity measurements comparison
The initial ionic conductivity measurement results are summarized in table 3. The unconverted (Br- form) samples had higher ionic conduc- tivities than the converted ones as shown in table 3. Interestingly, the conventionally converted AEM samples with lower IEC (OH-) values achieved higher ionic conductivities than the ones converted from the modified processes. However, the initial high conductivity values from the conventional process were unstable, as shown in following sections.
After conversion processes, AEM samples were stored in DI water. Under this condition, no external alkaline ions were present and the AEMs were tested in terms of their resistances to long-term degrada- tion. EIS and IEC measurements were taken to evaluate the IEC and conductivity performances for the 3 types of membranes.
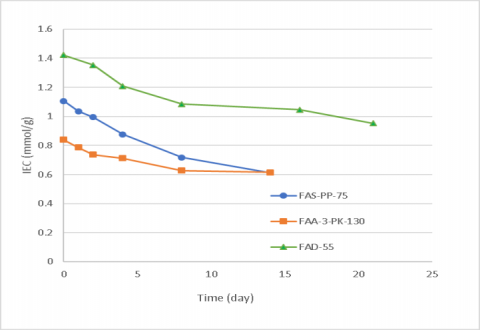
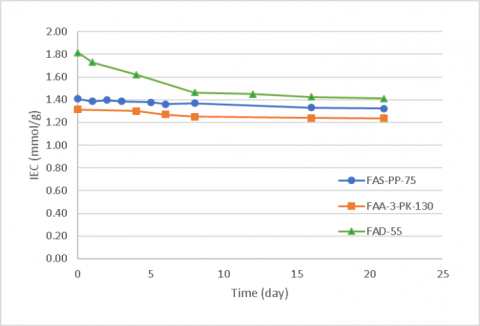
Fig. 11 shows that both types of AEMs incurred loss in IEC after conversion from the conventional process. The rates of IEC loss were fast for the first 8 days and then slowed down afterwards. The loss was more significant on FAS-PP-75 and FAD-55 which have lower alkalinity resistance than FAA-3-PK-130. As shown in Fig. 11, FAS-PP-75 and FAA-3-PK-130 membranes treated with the 0.2M NaOH conversion process exhibited constant IEC values for the entire test period. Even the FAD-55, with weakest alkaline resistance, the IEC values stabilized after the first 8 days.
Fig.12 shows that the FAS-PP-75 and FAA-3-PK-130 polymer struc- tures are stable with the converted hydroxide from the modified con- version process but the high alkalinity conversion appears to leave excess alkaline species which can damage the membrane structure over time. These excess species result in overestimated initial IEC values and long-term hydroxide degradation, which are shown as IEC loss in Fig.11. Thus, the modified low concentration conversion process en- hanced the AEMs’ long-term stabilities by reducing the amount of excess alkaline species entrapped in the membrane structures.
Figure 11. AEM long-term performances with conventional process (IEC)
Figure 12. AEM long-term performances with modified process (IEC)
The FAD-55 samples endured significant IEC loss after the conver- sion despite a higher initial conversion rate by the low alkaline conver- sion process. This indicates that the FAD-55 polymer cannot resist the degradation from its substituted OH- after the conversion process. So, this type of AEM is too sensitive to alkaline conversion for long-term performance. The stability performance was not improved by the modi- fication of the conversion process.
Table 3. AEM ionic conductivity test results
|
Initial ionic conductivity (mS/cm) |
FAS-PP-75 |
FAA-3-PK-130 |
FAD-55 |
|
Br- form |
3.51 |
3.44 |
3.41 |
|
Conventional process |
1.67 |
1.72 |
2.03 |
|
Modified process |
1.58 |
1.38 |
1.84 |
3.7. Ionic conductivity results
The ionic conductivity measurements of FAS-PP-75 and FAA-3-PK- 130 are consistent with the IEC results for both the conventional and modified alkaline conversion processes, as shown in Fig. 13 and 14.
Figure 13. AEM long-term performances with conventional process (conductivity)
Figure 14. AEM long-term performances with modified process (conductivity)
For FAD-55 results shown in Fig. 10 and 11, the IEC losses were simi- lar with both conversion processes. However, the decrease in ionic conductivity was more significant with the conventional process than the modified process as shown in Fig. 13 and 14.
This difference is suggested to be because the ionic conductivity analysis measures all types of ionic species with the tested AEMs. For the conventional conversion process, some bromide ions may still reside on the AEM QA groups, which cannot be measured by IEC back titration analysis. Therefore, the additional conductivity loss indicates the attack of the excess alkaline species on the remaining QA-Br sites.
From the data analysis above, it can be concluded that the conven- tional one step highly alkaline conversion process provides rapid AEM conversion. However, the high alkalinity causes short-term degradation to the QA groups during the conversion process, leading to the loss of initial conductivity. Moreover, high alkalinity conversion also results in unstable long-term performance due to the excess hydroxide remaining in the AEM structures.
By applying low alkaline concentration and measuring the amount of exchanged counter ions, the modified hydroxide conversion process provides improved conversion with mitigated hydroxide degradation for FAS-PP-75 and FAA-3-PK-130 membranes. These AEMs had adequate alkaline resistance. Significant enhancements of initial and long-term conversion performances were found for both IEC and conductivity measurements. The FAD-55 AEM with weak alkaline re- sistance did not benefit from the low alkaline conversion process.
This research was conducted as part of the Engineered Nickel Catalysts for Electrochemical Clean Energy project administered from Queen’s University and supported by Grant No. RGPNM 477963-2015 under the Natural Sciences and Engineering Research Council of Cana- da (NSERC) Discovery Frontiers Program.
[1] J. R. Varcoe, P. Atanassov, D. R. Dekel, A. M. Herring, M. A. Hickner, P. A. Kohl, A. R. Kucernak, W. E. Mustain, K. Nijmeijer, K. Scott, T. Xu and L. Zhuang, Energy & Environmental Science, 10, 3191 (2014).
[2] W. Lu, Z.-G. Shao, G. Zhang, Y. Zhao, J. Li and B. Yi, Internation- al Journal of Hydrogen Energy, 38, 9285 (2013).
[3] N. J. Robertson, H. A. Kostalik IV, T. J. Clark, P. F. Mutolo, H. D. Abruña and G. W. Coates, Journal of the American Chemical Soci- ety, 132, 3400 (2010).
[4] N. Li, M. D. Guiver and W. Binder, CHEMSUSCHEM, 6, 1376 (2013).
[5] G. Merle, M. Wessling and K. Nijmeijer, Journal of Membrane Science, 377, 1 (2011).
[6] I. EG&G Technical Services, "Fuel Cell Handbook," U.S. Depart- ment of Energy, Morgantown, 2004.
[7] U.S. Department of Energy, "DOE Hydrogen Program," U.S. De- partment of Energy, 2008.
[8] Fumatech, "ion exchange membranes for water treatment," Fuma- tech, 23 11 2016. [Online]. Available: http://www.fumatech.com/ EN/Membranes/Water+treatment/Products+fumasep/
[9] Y.-S. Kim and S.-H. Choi, "Synthesis of an Anion-Exchange Mem- brane Based on Imidazolium-Type Ionic Liquids for a Capacitive Energy Extraction Donnan Potential Device," Journal of Chemistry, 2014.
[10] J. Pan, C. Chen, Y. Li, L. Wang, L. Tan, G. Li, X. Tang, L. Xiao, J. Lu and L. Zhuang, Energy & Environmental Science,1, 354 (2013).
[11] J. Ran, L. Wu, Y. Ru, M. Hu, L. Dina and T. Xu, Polymer Chemistry, 32, 5809 (2015).
[12] A. G. Wright, J. Fan, B. Britton, T. Weissbach, H.-F. Lee, E. A. Kitching, T. J. Peckham and S. Holdcroft, Energy & Environmental Science, 9, 2130 (2016).