Feihua Yang | Yi Zhu | Jun Li* | Changlong Wang† | Zhenzhen Ren | Xiaowei Cui
OPEN ACCESS
In order to realize the resource utilization of solid waste, autoclaved aerated concrete (ACC) was prepared by hydrothermal synthesis with quartz tailing sand (QTS) as the main siliceous material. The effects of fineness and content of QTS on the properties, hydration products and microstruc- tures of AAC were investigated by particle size analysis, physical and mechanical properties test, X-ray diffraction analysis (XRD), fourier trans- form infrared spectoscopy (FT-IR), and scanning electron microscope (SEM). The results show that the AAC containing 65% QTS (in mass per- centage) with a specific surface area (SSA) of 320 m2 kg-1 can achieve a compressive strength of 4.43 MPa and bulk density of 560 kg m-3, which qualifies the requirements of B06, A3.5 of AAC sample regulated by the composition and morphology GB/T 11969-2008. The small size of QTS particles and the high thickness of the slurry are harmful to form a good pore structure of AAC. When the blending percentage of QTS is too high, the unreacted QTS particle increase and accumulate within the system, which reduces the space among them and thus influences the growth and crystallization of hydration products and the properties of AAC. Phase analyses show that the main crystalline phases in the AAC samples are to- bermorite, C-S-H, calcite, residual quartz and residual minerals from QTS.
quartz tailing sand, autoclaved aerated concrete, fineness, content
Quartz tailing sand (QTS) is a by-product of glass production, it’s the fine sand obtained after quartz sand, the raw material of glass, had been crushed and screened, and its main chemical component is SiO2. In the float glass process, the harm of fine quartz sand lies in the fact that after entering the furnace, it will erode the refractory material, reduce the lifespan of the furnace, affect the uniformity of the batch, and block the channels between the checker bricks; and all these fac-tors are not good for the glass production, therefore, the glass industry has stipulated requirements for the particle size of quartz sand as fol-lows: the content of quartz sand with a particle size between 0.125 and 0.71 mm must be greater than 95%, and the content of quartz sand with a particle size smaller than 0.125 mm must be less than 5% [1]. According to this proportion, during the glass making process, the quartzite will produce 30% QTS which can be used as the siliceous correction material for the dry-method cement production in the ce-ment plants, but the actual application is quite insufficient. If the QTS has not been handled properly, it’ll fly with the wind in dry seasons, causing desertification to the surrounding land, or it’ll flow into the river with the rainwater during the rainy seasons, causing serious pol-lution to the environment, and meanwhile increasing the environmen-tal protection burden of the manufacturing enterprises.
The research on the comprehensive utilization of QTS in China is mainly focused on the production of chemical raw materials (white carbon black) [2], building materials (aerogels [3], cement [4,5], cera-mists [6,7], autoclaved aerated concrete (AAC) [1]), and extraction of quartz sand [8,9], etc. However, these products are of low added value and can hardly be produced in bulk due to the limitation of transporta-tion distance.
AAC is a new-type of wall construction material produced by sili-ceous materials (sand, fly ash, silicon-containing tailings, etc.) and calcareous materials (lime, cement, etc.), it has the advantages such as light weight, sound-proof, thermal insulation, fire prevention, easy processing, and can save 50% of the energy in buildings [10-17]. The characteristics of AAC are soil-saving, waste reduction, energy-saving in production and use, light weight, easy processing, convenient for construction, good performance (thermal insulation, sound-proof, fire resistance), etc. It is an ideal supporting wall material for modern building structures: the frame structures and the steel structures. After years of practice, it has solved the construction problems that had re-stricted its development before, such as wall cracking, mortar plaster-ing skills, etc.; as our country has laid more emphasis on the energy-saving of buildings and the reform of wall materials, the demand for new type wall materials is becoming increasingly prominent, and the AAC has ushered in new opportunities for development, and there’ll be ample room for its development.
However, in terms of raw material supply, the resources of fly ash and river sand used in the traditional AAC production processes be-come fewer and fewer, so we have to search for other cheap silicon-based raw materials to replace them. This study attempts to use QTS to produce AAC, and such hydrothermally synthesized calcium silicate green building material products, this method not only provides new raw materials for the production of AAC, but also effectively solves the environmental pollution problem caused by the QTS produced from mineral processing plants; moreover, this method saves the costs needed for solving pollution and stacking, makes the best use of the QTS produced from quartz processing plants, enriches the product types of the enterprises and increases their economic growth points.
2.1 Materials
The AAC samples were prepared using the following raw materials: QTZ, lime, 42.5 ordinary Portland cement (OPC) and the gypsum of flue gas desulfurization gypsum (FGDG). The chemical compositions of the raw materials are listed in Table 1 .
(1) QTS. In AAC that is consisted of the cement-lime-sand system, the role of the sand is mainly to provide silica to react with calcium oxide under autoclaved conditions to form hydrated calcium silicate. In addition, the unreacted sand particles act as skeletons and aggregates in the bubble wall of AAC. The QTS adopted in this experiment is earthy yellow in color, with an average particle size of $85.2 \mu \mathrm{m},$ a density of $2.62 \mathrm{g} \cdot \mathrm{cm}^{-3}$ and a whiteness of 34.3, after sieved by $0.08 \mathrm{mm}$ squarehole sieve, the residue was about $12 \%$. As can be seen from Table 1 , the QTS meets the above requirements and its $\mathrm{SiO}_{2}$ content is far greater than 80%
(2) Lime. The main role of lime is to provide $\mathrm{CaO}$ to the $\mathrm{AAC}$, so that it'll react with $\mathrm{SiO}_{2}$ and $\mathrm{Al}_{2} \mathrm{O}_{3}$ in the siliceous materials under hydrothermal conditions to generate hydrated calcium silicate and hydrated calcium aluminate, thereby providing strength to the products. At the same time, lime also increases the alkalinity of AAC, provides the foaming conditions for aluminum powder, and promotes the aluminum powder to undergo foaming reaction and generate porous strucThe experimental system requires effective $\mathrm{CaO}>60 \%$ and $\mathrm{MgO}<7 \%$; finely ground quicklime was adopted in the experiment with a CaO content of $70 \%$, and the content of $\mathrm{MgO}$ was not higher than $3 \%,$ after sieved by $0.08 \mathrm{mm}$ square-hole sieve, the residue was about $10 \%,$ the quicklime was slaked at medium speed and the slaking rate was about 10 min. The chemical composition of lime is shown in Table 1.
(3) Cement. The role of cement is to adjust the consistency during the pouring process, ensure the proper viscosity and plasticity of the slurry, accelerate the hardening of the blank, and promote the hydrothermal synthesis reaction in the autoclaving process. The cement used in the experiment is ordinary Portland cement (OPC) with the strength grade of 42.5 which complies with the Chinese National Standard GB 175-1999. The chemical compositions and the physical properties of the pure Portland cement are shown in Tables 1 and 2 , respectively.
(4) FGDG. The role of FGDG is to slow down the slaking of the lime and the setting of the OPC, it can also improve the strength of the blank and the product, and reduce the shrinkage value. Thermal power plant FGDG was adopted, after sieved by $0.08 \mathrm{mm}$ square-hole sieve, the residue was about $8 \%,$ and the chemical composition is shown in Table 1.
(5) Aluminum powder. Water-based aluminum powder was adopted as the foaming agent, the content of active aluminum is more than 90%.
(6) Water reducing agent. Surfactant was taken as the foam stabilizer to reduce the surface tension of the solution and stabilize the bubbles. FDN superplasticizer was adopted in the experiment.
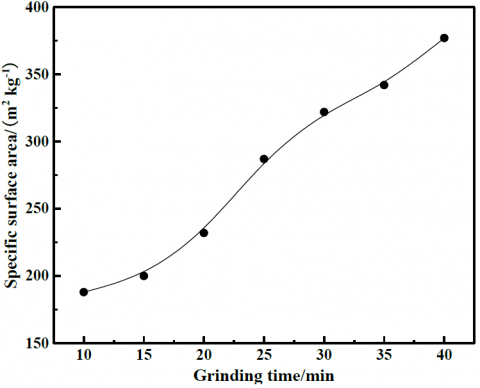
Figure 1. Relationship between grinding time and $\mathrm{SSA}$ of $\mathrm{QTS}$
2.2 Methods
2.2.1. AAC preparation
QTS was dried until the moisture content was less than $1 \%$ and ground in a $5 \mathrm{kg}$ laboratory ball mill $(\mathrm{SM} \varphi 500 \mathrm{mm} \times 500 \mathrm{mm}),$ the grinding time and corresponding specific surface area (SSA) are shown in Fig. 1.
Based on previous tests, this study prepared the AAC of A3.5 strength grade (compressive strength $\geq 3.5 \mathrm{MPa}$ ) and $\mathrm{B} 06$ density grade (bulk density $\leq 625 \mathrm{kg} \cdot \mathrm{m}^{-3}$ ) by adjusting the fineness and content of the QTS. The determination of the amount of raw materials and the pouring process: in order to make the thickening of the slurry match with the foaming of the aluminum powder, the stability of the AAC was observed during the pouring process, when foaming, the inflation of the slurry should be kept stable, too-slow, too-fast, or uneven foaming should be prevented, and phenomenon such as bubbling, or boiling should not appear; after settling and pre-curing, the porous structure of the cross section of the blank was observed by a scanning electron microscope. It's required that the foams should be of uniform bubble size and good shape, which was taken as a preliminary basis for judging whether the amount of raw materials and the pouring process are reasonable.
Table 1. Chemical composition of raw materials (mass fraction, %)
|
Materials |
SiO2 |
Al2O3 |
Fe2O3 |
FeO |
MgO |
CaO |
K2O |
Na2O |
SO3 |
LOI |
|
QTS |
93.22 |
2.14 |
0.86 |
0.28 |
0.31 |
0.81 |
0.62 |
0.32 |
0.43 |
1.05 |
|
OPC |
25.04 |
6.12 |
3.30 |
0.22 |
3.89 |
55.54 |
0.96 |
0.54 |
- |
4.14 |
|
Lime |
5.45 |
3.85 |
1.68 |
0.08 |
3.59 |
78.76 |
1.25 |
0.39 |
0.45 |
3.93 |
|
FGDG |
2.85 |
0.79 |
0.26 |
0.02 |
0.48 |
40.23 |
0.13 |
0.08 |
33.22 |
- |
Table 2. Physical properties of OPC
|
Fineness (residue on 80 μm sieve) /% |
Normal consistency /% |
Setting time /min |
Stability |
Flexural strength /MPa |
Compressive strength /MPa |
|||
|
Initial setting |
Final setting |
3d |
28d |
3d |
28d |
|||
|
21.09 |
26.4 |
158 |
204 |
qualified |
4.9 |
8.6 |
30.1 |
57.3 |
Water-to-material ratio. An appropriate water-material ratio can ensure certain fluidity of the slurry and a proper critical shear stress, so as to provide necessary conditions for foaming and expansion, forming a good porous structure, so that the final products can have a higher strength and a lower shrinkage value. Too large water-to-material ratio could result in deformation of the pores, and the mold will be easily collapsed; while too small water-to-material ratio could result in unsmooth and uneven foaming. The preliminary test determined that the water-to-material ratio was 0.60.
FGDG amount. Gypsum can extend the thickening time of the slurry and make the temperature rise smoothly. The needle-shaped crystals ettringite (AFt) produced by the reaction can increase the strength of the product and reduce the shrinkage. However, excessive gypsum may cause the thickening to be too slow so that the foams might fall and the mold might collapse. This experiment determined that the amount of FGDG was $5 \%$ of the total mass of the dry materials.
Aluminum powder amount. The amount of aluminum powder can be calculated according to the design unit weight of the product. From the foaming reaction of aluminum powder, it is known that 2 mol pure metal aluminum can produce 3 mol hydrogen, and the gas production for per gram of pure metal aluminum under standard conditions is:
$\mathrm{V}_{t0}=(22.4 \times 3) /(2 \times 27)=1.27 \mathrm{L} \cdot \mathrm{g}^{-1}$ (1)
The theoretical gas production for per gram of pure metal aluminum is:
$\mathrm{V}_{\mathrm{t}}=1.24 \times(273+\mathrm{t})$ (2)
Where t represents the temperature of the slury.
Take the content of active aluminum as $90 \%$ and the temperature of the slurry as $50^{\circ} \mathrm{C}$, the unit gas output of the aluminum powder was: $1.24 \times(273+50) / 273 \times 0.9=1.32 \mathrm{L} \cdot \mathrm{g}^{-1}$
Based on the water-to-material ratios of the basic materials, it's determined that the amount of aluminum powder for $1 \mathrm{m}^{3} \mathrm{AAC}$ was $0.057 \%$ of the total mass of the dry materials.
Water: Considering that there is a difference in the heat loss between the small mold pouring in the laboratory and in the actual production, we can consider to raise the temperature of the mixing water to adjust the difference, and the water temperature was set to $55^{\circ} \mathrm{C}$.
(1) Preparation of AAC containing QTS with varying fineness
The amounts of QTS, OPC, lime, FGDW (mass percentage) are $65 \%, 21 \%, 9 \%, 5 \%,$ respectively. And the amounts of water reducer are $0.03 \%$ by mass percentage of the dry materials.
The dry mixtures were stirred in warm water (55 ºC) for 120 s; then added aluminum paste and foam stabilizer and continued to stir the mixtures for 40 s. Poured the slurry into the triple-mold molds (100 mm×100 mm×100 mm), then cured at 70 ºC for 2 h. After de-molded, the hardened body was put into a autoclave for autoclaving. The auto- clave system was as follows: temperature rise and pressure increase for 2 h, constant temperature and pressure increase for 8 h, and tempera- ture drop and pressure decrease for 2 h. The highest autoclave pressure is 1.25 MPa and the highest temperature is 180 ºC. After autoclaving, AAC with different fineness of QTS are prepared, and their numbers are F1, F2, F3, F4, F5, F6 and F7.
(2) Preparation of AAC with different amounts of QTS
QTS with the optimal fineness was used and its blend amounts are as follows: 57%, 59%, 61%, 63%, 65%, 67% and 69%. And the amounts of OPC, lime and FGDG were adjusted correspondingly. These AAC samples are labeled as P1~P7 according to different QTS contents. Other parameters are the same as the amount of QTS AAC with differ- ent fineness.
2.2.2 Sample test
LMS-30 laser particle size analyzer was used to measure the particle size distribution of ground QTS, and CZB-9 automatic specific surface area meter was used to measure the specific surface area of grinding QTS.
The SSA is measured using dynamic specific surface area analyzer (SSA-3200). The compressive strength of samples was measured using hydraulic pressure testing machine (YES-300) with a maximum load of $300 \mathrm{KN}$ and a loading rate of $2.0 \pm 0.5 \mathrm{kN} / \mathrm{s} .$ The $\mathrm{XRD}$ spectra of $\mathrm{QTS}$ and AAC were obtained using a D/Max-RC diffractometer (Japan) with Cu-K $\alpha$ radiation, voltage of $40 \mathrm{kV},$ current of $150 \mathrm{mA}$ and $2 \theta$ scanning ranging between $5^{\circ}$ and $90^{\circ},$ and the wavelength is $1.5406 \mathrm{nm}$. The functional groups vibration of each sample was qualitatively analyzed by NEXUS70 Fourier transform infrared (FT-IR, test range $350 \sim 4000$ $\mathrm{cm}^{-1}$ ). FE-SEM observation was performed to analyse the mineral phase and the hydration products of the paste samples using a Zeiss SUPRA $^{\mathrm{TM}} 55$ scanning electron microscope coupled with a Be4-U92 energy spectrum.
3.1 Effect of the fineness of QTS on AAC properties
The reactivity of QTS is relatively low, we can make use of the me- chanical-chemical effect to reduce the reaction activation energy of the materials and enhance the reactivity [18-21]. In the system of products that have been cured by autoclaving, the incorporation of finely ground siliceous raw materials is beneficial to the hydrothermal synthesis reac- tion, forming the main phase of AAC. The grinding fineness of the siliceous raw material is a key factor in the preparation of AAC, and it directly affects the stability of slurry pouring and the reactivity of AAC [22].
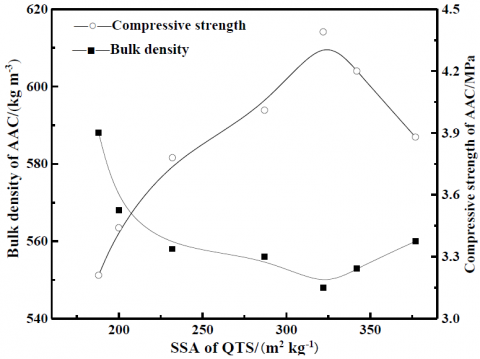
Fig. 2 shows the effects of different fineness QTS on the properties of AAC. It can be seen from the figure that as the specific surface area of QTS increases, the compressive strength of AAC samples first in- creases and then decreases, while the oven-dry density decreases first and then increases. The oven-dry density of the 7 groups of samples were all less than 625 kg·m-3, meeting the requirements of B06. The compressive strength of samples F2, F3, F4, F5, F6 and F7 were all greater than 3.5 MPa, which met the requirements of A3.5. The com- pressive strength of sample F1 was 3.21 MPa, which didn’t meet the requirements of A3.5. It can be seen that the fineness of QTS plays a vital role in the performance of AAC. Just like cementitious materials such as OPC, increasing the fineness can enlarge the specific surface area of the particles in contact with water, thereby accelerating the issolution rate, and enhancing the ability of materials to participate in chemical reactions. It was found in the test that, for the sample F7 whose specific surface area was 377 m2 ·kg-1, its slurry had the largest consistency during the pouring, it showed the phenomenon of slight bubbling, and the appearance of the product was not good, indicating that the smaller the fineness of the QTS, the larger the specific surface area of the particles participating in the reaction, the higher the reactivi- ty, and the slurry fluidity is better; however, when the fineness is too small, the slurry is too thick, resulting in that the product cannot form a good porous structure, and thus affecting the performance of the prod- uct; for the sample F1 whose specific surface area was m2 kg-1, the fluidity of the slurry during the pouring was poor, showing bubbling phenomenon, indicating that the particles of QTS were large, the fitness was small, and the fluidity of the slurry was poor, after pouring, the slurry settled fast, easily causing mold collapse and sinking. The results of this test prove that when the specific surface area of the lead-zinc tailings was 322 m2 kg-1, the slurry had good fluidity and pouring sta- bility, and the enhancement effects on the product's oven-dry density and compressive strength both reached the optimal, and the appearance of the obtained AAC products was in the best form. Therefore, in con- sideration of the economics and the performance, the optimal specific surface area of the tailings in subsequent tests was determined to be 322 m2 ·kg-1.
Figure 2. Effect of fineness of QTS on AAC properties
3.2 Effect of the content of QTS on AAC properties
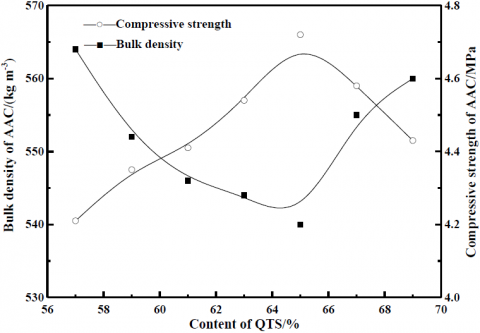
Fig. 3 shows the effects of different QTS contents on the perfor- mance of ACC under the same conditions. It can be seen from the fig- ure that as the content of QTS increases, the oven-dry compressive strength of ACC products generally increases first and then decreases, and the oven-dry density decreases and then increases. With the in- crease of the QTS content, the hydration reaction of the system is rela- tively complete, the crystalline morphology of the hydration product tobermorite is good, and the hydration products combined more tightly with the unreacted particles in the system, which increases the com- pressive strength of the product and decreases the oven-dry density. However, when the QTS content is too large, there are more accumu- lated unreacted particles left in the system, so the gaps between the particles are decreased, which is not conductive to the growth and crys- tallization of the hydration products, leading to a reduction in the com- pressive strength and an increase in the oven-dry density. When the content of QTS was 67% and 69%, the excessive QTS reduced the fluidity of the slurry, making the porosity structure of AAC uneven. For sample P7 whose QTS content was 69%, there were even some tiny cracks on the outer surface of the product along the direction that is vertical to the gas outlet, indicating that the QTS content in the test should not be greater than 65%. When the QTS content was 65%, the oven-dry density of the product was 540 kg m-3, and the compressive strength reached 4.72 MPa. By comprehensively considering the per- formance of the products, with maximizing the usage of QTS and re- ducing the costs as the goals, we had chosen sample P5, whose contents of QTS, lime, OPC, and FGDG were 65%, 21%, 9%, and 5%, as the optimal ratio.
Figure 3. Effect of QTS content on AAC properties
3.3 Phase analysis
3.3.1 XRD analysis
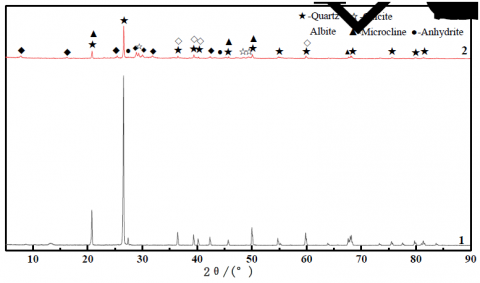
Fig. 4 shows the XRD spectra of AAC products with the optimal content ratio of the materials. X-ray diffraction was used to study the phase compositions of QTS and autoclaved P5 products. It can be seen from curve 1 that the main minerals in QTS are quartz, microcline, and albite, which are high-quality siliceous raw materials for hydrated silica calcium products. As for the autoclaved AAC products (curve 2), new phases such as tobermorite, anhydrite and calcite had appeared in the samples. The XRD diffraction peaks of the main mineral components in raw QTS had weakened, which indicates that when AAC blank was under high-temperature and high-pressure hydrothermal conditions, the Si-O bond in the [SiO4]4-structure of QTS had broken, accelerating the dissolution of SiO2 in QTS, and the dissolved SiO2 reacted with Ca(OH)2, which was formed by the hydration of OPC, to undergo hy- drothermal synthesis reaction, and produce the corresponding hydration product C-S-H gels and tobermorite. The appearance of calcite after autoclaving might be due to the carbonization of AAC; and the anhy- drite was the residue of FGDG in the system. As for curve 2, the char- acteristic peaks of quartz, microcline, and albite had weakened, indicat- ing that the three minerals had participated in the reaction of the sys- tem. The remaining particles after the reaction, together with the anhy- drite and the calcite, had constituted the skeleton of the AAC product, making it have high enough strength. At the same time, the 2θ in the curve is the wide "convex hull"-shaped background under the diffrac- tion peak between 26°~34°, indicating that there were amorphous (non- diffractive) and extremely low-crystallinity substance C-S-H gels in the blank [23].
Figure 4. XRD spectra of P5 sample and lead-zinc tailings, 1-QTS; 2-autoclaved sample
3.3.2 FT-IR analysis
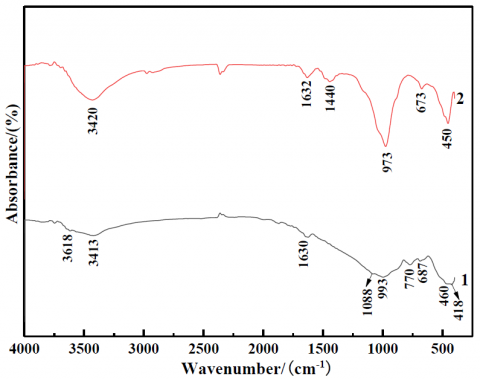
Fig. 5 shows the FT-IR spectra of sample P5 and QTS, it can be seen from the figure that all absorption peaks had moved towards the direc- tion of smaller wave number. In curve 1, the strongest absorption re- gion between 900 and 1200 cm-1 is the absorption band of quartz, which is due to the asymmetric stretching vibration of Si-O bond, con- sisting of a weak band of 1050 to 1200 cm-1 and a strong band of 900 to 1050 cm-1, the absorption band is wide and intense, of which the char- acteristic peak at 993 cm-1 is the asymmetric stretching vibration of Si- O bond, and there is a moderate intensity absorption peak at 770 cm-1, which is the symmetrical stretching vibration of Si-O-Si bond, it is the characteristic peak of quartz group minerals. The characteristic peaks at 687 cm-1, 460 cm-1 and 418 cm-1 are attributed to the bending vibration of Si-O bond [24]. The absorption bands at 3618 cm-1, 3413 cm-1 and 1630 cm-1 are the bending vibration of O-H bond in QTS crystal water. In curve 2, the characteristic peaks representing the quartz group min-erals at 3618 cm-1, 3413 cm-1, 1088 cm-1, 993 cm-1, 770 cm-1, 687 cm-1, 460 cm-1 and 418 cm-1 disappeared, and new characteristic peaks ap- peared at 3420 cm-1, 1632 cm-1, 1440 cm-1, 973 cm-1, 673 cm-1, and 450 cm-1. The characteristic band at 777 cm-1 which characterizes the quartz in curve 2 is weakened. The absorption bands at 3420 cm-1 and 1632 cm-1 are the stretching vibration of the adsorbed water in the hydration product C-S-H gel; the absorption band at 1440 cm-1 is the asymmetric stretching vibration of CO32- in calcite, which is caused by the carboni- zation of AAC; the absorption band at 973 cm-1 is caused by the sym- metrical stretching vibration of Si-O of Q2 in the [SiO4]4- structure, the absorption intensity of characteristic peak at this position is very large, indicating that the vibration has strong infrared reactivity; the charac- teristic peak near 450 cm-1 is caused by the bending vibration of Si-O bond in the [SiO4] structure, among them, the characteristic peaks at 977 cm-1 and 450 cm-1 are attributed to the layered structure of tober-morite.
Figure 5. FT-IR spectrums of samples. 1- QTS, 2- P5 AAC sample after autoclaved.
3.3.3 SEM analysis
Fig. 6 and Fig.7 show the SEM and EDS spectra of the P5 sample. The hydration product marked with region 1 in the Fig. 6 is the loose structured C-S-H gel with poor crystal form, which is consistent with the phase in the XRD and FT-IR spectra in Fig. 4 and Fig. 5. Fig. 6(b) is an enlarged image of region 2, from which we can see a lot of plate- shaped tobermorite crystals with good crystal form and large- crystallinity, the width is about 1~2 μm, and the thickness is about 60~80 nm, the crystallinity of the plate-shaped tobermorite increased largely, the crystals intertwined with each other, forming the skeleton structure of the AAC product, so that the product had enough strength; meanwhile, cavities were formed between the plates, making the ACC product have the thermal insulation property. After autoclaving, the active component SiO2 in QTS had increased solubility in alkaline hydrothermal environment, its reactivity had been improved, and played a positive role in improving the crystallinity of hydration prod- ucts.
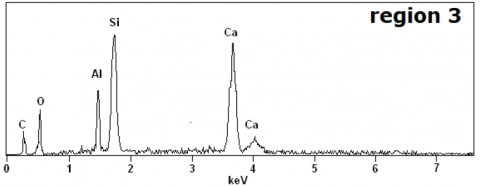
From the EDS spectrum of region 3 in Fig. 6 (b) we can know that, there are Al elements existing in the hydration products, this is mainly because of the addition of aluminum powder to the raw material sys-tem, which caused part of the [SiO4] tetrahedra to be replaced by the [AlO4] tetrahedra [22]. In region 3, the hydration product nCa/n(Si+Al) = 0.8326, which is basically the same with the nCa/n(Si) = 0.8333 of the tobermorite (Ca5 (OH) 2Si6O16! 4H2O).
Figure 6. SEM micrographs of P5 AAC sample. (a) 5,000-fold enlargement of hydration products of samples, (b) 50,000-fold enlargement of hydration products of region 2 in Fig. 6 (a)
Figure 7. EDS spectrums of marked region 3 in the Fig. 6 (b)
(1) With QTS as the main siliceous raw material, qualified products of A3.5 and B06 grade AAC that meet the national standards can be prepared. The optimal ratio is: the specific surface area of QTS is 322 m2·kg-1; the mass ratio of QTS, lime, OPC and FGDG is 65: 21: 9: 5; and the water-to-material ratio is 0.57; and the contents of aluminium powder and water agent are 0.057% and 0.03% of the total mass of the dry materials, respectively.
(2) Reduction in the fineness of QTS improves the reactivity and solubility of SiO2 in the tailings, which is beneficial to the pouring stability and the mechanical properties of the product. However, if the fineness is too small and the slurry is too thick, the product cannot form a good porous structure, which will affect its properties. The increment of QTS content provides sufficient active SiO2 for the hydration reac-tion of the system; but too much QTS content will result in the increase in the accumulated unreacted residual tailings particles in the system, the gaps between the particles are reduced, which is not conducive to the growth and crystallization of the hydration products.
(3) According to XRD, FT-IR and FE-SEM analysis, it can be known that the hydration products in the AAC products produced by QTS are tobermorite and C-S-H gels. After the reaction, the remaining particles of quartz, microcline, and albite, together with anhydrite and calcite, had constituted the skeleton of the AAC products, so that the products can have enough strength.
The authors gratefully acknowledge financial support from China Postdoctoral Science Foundation (2016M602082), supported by Natu-ral Science Foundation of Hebei Province (E2018402119), supported by Natural Science Foundation of Shaanxi Province (2019JLM-49), supported by Shaanxi Science and Technology Benefit People Project (2018ZY-HM-01), supported by Science and Technology Research Project of Higher Education Universities in Hebei Province (ZD2016014, QN2016115), supported by Comprehensive Utilization of Tailing Resources Key Laboratory of Shaanxi Province (2017SKY-WK008), supported by Jiangxi Postdoctoral Daily Fund Project (2016RC30), supported by Jiangxi Postdoctoral Research Project (2017KY19), supported by State Key Laboratory of Solid Waste Reuse for Building Materials (SWR-2019-008).
[1] Wang Y, Jiang X X, Wu S Y., Science and Technology of Overseas Building Materials, 29(2), 16 (2008).
[2] Cao M., Hefei: Hefei University of Technology, 2017.
[3] Li J T, Liu Y F, Zhuang S K, Li K B., Chemical Research and Ap-plication, 29(2), 283 (2017).
[4] Cao W K., Sicuan Cement, 1, 49 (2006).
[5] Wang C H, Ge J L, Qin Y Y, Wang Y L, Wang P, Shi C M, Wang B Y., Cement, 11, 11 (2008).
[6] Guo S S, Ruan D M, Zou H H, Wang Q, Yan S, He L L, Wang S Y., Materials Research and Application, 9(2), 130 (2015).
[7] Wang C H, Ge J L, Qin Y Y., Shanghai Environmental Sciences, 28(5), 200 (2009).
[8] Chen N C, Wang W, Li Z, Wu W H., Non-metals Mines, 32(3), 47 (2009).
[9] Deng H Y, Yu Z W., China Powder Science and Technology, 6(3), 22 (2000).
[10] Narayanan N, Ramamurthy K., Cement and Concrete Research, 30(3), 457 (2000).
[11] Narayanan N, Ramamurthy K., Cement and Concrete Composites, 22(5), 321 (2000).
[12] Lin G, Wang C L, Qiao C Y, Cui H L, Chen L, Yu S., Romanian Journal of Materials, 46(3), 334 (2016).
[13] Cui X W, Wang C L, Ni W, Di Y Q, Cui H L, Chen L., Romanian Journal of Materials, 47(1), 46 (2017).
[14] Liang X Y, Yuan D X, Li J, Wang C L, Lin X R, Chang N., Roma-nian Journal of Materials, 48(3), 381 (2018).
[15] Wang C L, Ni W, Zhang S Q, Wang S, Gai G S, Wang W K., Con-struction and Building Materials, 104, 109 (2016).
[16] Kurama H, Topcu I B, Karakurt C., Journal of Materials Processing Technology, 209(2), 767 (2008).
[17] Walczak P, Szymański P, Różycka A., Procedia Engineering, 122, 39 (2015).
[18] Roman A B, Victor V M, Vladimir V B., Catalysis Today, 144(3-4), 212 (2009).
[19] Sydorchuk V, Khalameida S, Zazhigalov V, Skubiszewska-Zięba J, Leboda R, Wieczorek-Ciurowac K., Applied Surface Science, 257(2), 446 (2010).
[20] Senneca O, Salatino P, Chirone R, Cortese L, Solimene R., Pro-ceedings of the Combustion Institute, 33(2), 2743 (2011).
[21] Yi Z L, Sun H H, Li C, Sun Y M, Li Y., International Journal of Minerals, Metallury and Materials, 17(1), 116 (2010).
[22] Huang X Y, Ni W, Cui W H, Wang Z J, Zhu L P., Construction and Building Materials, 27(1), 1 (2012).
[23] Bensted J, Barnes P., Structure and performance of cements, 2nd edition, New York: Spon Press, 2002.
[24] Zhang N, Liu X M, Sun H H, Li L T., Journal of hazardous materi-als, 185(1), 329 (2011).