Jiali Liu | Kai Li*
© 2020 IIETA. This article is published by IIETA and is licensed under the CC BY 4.0 license (http://creativecommons.org/licenses/by/4.0/).
OPEN ACCESS
In traditional Chinese medicine (TCM), symptoms are mostly differentiated subjectively by doctors. This approach of symptom differentiation lacks objective basis. Moreover, it is difficult to differentiate between symptoms and treat them through electrical stimulation rehabilitation (ESR) in the absence of TCM doctors. To solve these problems, this paper designs an intelligent symptom differentiation (ISD)-ESR system, which includes a software part for dialectical analysis, and a hardware part for electric stimulation of acupoints. The system was designed with the aid of the following technologies: fuzzy analytic hierarchy process (AHP), chromatographic decomposition, spatiotemporal slicing, optical flow field method, collaborative filtering based on deep neural network (DNN), and software-hardware fusion techniques (e.g. electrical stimulation signal control and Bluetooth multi-pass control). The proposed system was applied to treat 30 patients with primary insomnia in the sleep center of a tertiary hospital. The results show that the proposed system achieved an accuracy of 93.3% in symptom differentiation, and significantly improved the effect of electroacupuncture on insomnia (P<0.05). Overall, the proposed system makes up for the defects of existing devices, and improves the effect of rehabilitation treatment.
intelligent symptom differentiation (ISD), electrical stimulation rehabilitation (ESR), artificial intelligence (AI), system design, insomnia
Traditional Chinese medicine (TCM) advocates the principle of treating patients with the same disease differently, according to their specific symptoms. The differentiated treatment has unique advantages in treating diseases with unique characteristics. However, the symptom differentiation method of TCM lacks objective indices, and mainly relies on the empirical judgement of doctors. The fuzziness of the diagnostic procedure has bottlenecked the modernization and globalization of TCM [1, 2].
The advent of artificial intelligence (AI) has enabled computers to simulate the thinking and reasoning of doctors, providing a reliable basis for diagnosis and treatment [3, 4]. For example, Rajpurkar et al. [5] detected and classified arrhythmias in dynamic electrocardiograms, using a deep neural network (DNN). Esteva et al. [6] proposed a deep learning (DL) app called Face2Gene, which can recognize rare genetic diseases through facial features. The Mayo Clinic combined convolutional neural network (CNN) and long short-term memory (LSTM) to intelligently screen for cardiac systolic dysfunction [7]. Intelligent image processing has been widely applied to recognize modern medical images [8], providing a certain objective basis for TCM diagnosis. However, the intelligent image recognition of face features, tongue features, and pulse in TCM is still in its infancy.
At present, the facial colors are mainly characterized by three-dimensional (3D) indices in a specific color space, namely, red green blue (RGB), hue saturation value (HSV) [9], and Commission Internationale de l’Eclairage (CIE). In many image processing tasks, the redundant and sparse representations often yield better results than compact representations. For instance, many image quality assessment algorithms choose to decompose the original image into several sub-bands [10, 11] in the preprocessing stage, including visual information fidelity (VIF), multiscale structural similarity (MS-SSIM) [12], full reference-difference of Gaussian (FR-DOG) [13], and most apparent distortion (MAD) [14].
Currently, tongue and face images are commonly used by TCM doctors to judge physical fitness. But not a single disease has been diagnosed through intelligent image recognition [15]. Neither has any TCM doctor managed to detect the health state of patients based on their eye movements and facial expressions. The new direction for TCM diagnosis is to apply AI to symptom differentiation of the same disease, and establish a standardized and information-based diagnosis and treatment model. Therefore, this paper puts forward a multi-anchor color feature analysis technique based on chromatographic decomposition, aiming to effectively detect tongue and face features, and combines spatiotemporal slicing with optical flow field method to detect eye expressions, thereby achieving multi-modal comprehensive symptom differentiation.
In recent years, there is a growing demand for portable, home-based, and intelligent medical rehabilitation. Bluetooth, as a wireless communication technology, provides technical support to wireless, multi-point simultaneous electrical stimulation. With extraordinary portability and intelligence, Bluetooth bridges each point with another or multiple other points. The wireless network connected by Bluetooth consists of a master device and several slave devices [16].
Based on the piezoelectric effect of the human body, electroacupuncture is a novel acupuncture and moxibustion therapy that fully integrates electrical stimulation to traditional acupuncture. With the development of electronics and TCM, electrical stimulation devices are increasingly smart and versatile, and evolving into the main equipment in hospital diagnosis/treatment and home rehabilitation. Intelligent electrical stimulation devices have been developed for hemiplegia rehabilitation, acupuncture simulation [17], electrical stimulation treatment, and digital music electroacupuncture [18].
The existing electrical stimulation devices face several defects: the parameters are often adjusted inaccurately, the treatment is not sufficiently personalized, and the man-machine interface is not user-friendly [19]. To solve these defects, this paper designs an intelligent symptom differentiation (ISD) and ESR (ISD-ESR) system based on high-precision and refined control techniques like electrical stimulation signal control, and Bluetooth multi-pass control.
For the medical industry, it is an inevitable trend to develop auxiliary diagnosis and treatment systems that couple AI with medical theory. The earliest auxiliary diagnosis and treatment system is the American MYCIN system, which deals with infectious diseases. Then came the Blue Box for the diagnosis and treatment of depression, CASNET (causal associational networks) for glaucoma, and IBM Watson, the most famous auxiliary diagnosis and treatment system of Western medicine [20, 21]. In China, Institute of Automation, Chinese Academy of Sciences (CAS), joined hands with China Academy of Chinese Medical Sciences (CACMS) to develop the earliest TCM assistant decision-making system: Chinese Medicine Inheritance Assistant Platform, facilitating the recommendation of TCM prescriptions [22]. Prescription recommendation is also realized in the following systems: the TCM expert system based on case-based reasoning [23], the TCM symptom differentiation and treatment system, and the TCM self-prescription system [24]. However, all of them operate independently from TCM devices.
To sum up, this paper designs an ISD-ESR system, which consists of a software part for dialectical analysis, and a hardware part for electric stimulation of acupoints. The proposed system makes up for the defects of the existing TCM devices, and improves the effect of rehabilitation treatment.
2.1 Fundamentals of hardware design
Acupuncture is an important means in TCM to evaluate the health state of the patient. During acupuncture treatment, a needle is injected via a meridian acupoint to observe the physiological indices like acidity, swelling, and heat, and dredge the channels to regulate the functions of viscera, blood, and material energy (qi).
Modern TCM theories hold that, thanks to biological piezoelectric effect, the electromagnetism parameters of each organ fall in the optimal range. The organs will appear abnormally, i.e. fall ill, if any parameter moves beyond or below that range. Due to the special connections between the organs and acupoints, the collaterals between an ill organ and its corresponding acupoints will exhibit abnormally high or low resistance.
As mentioned before, electroacupuncture is a novel acupuncture and moxibustion therapy that fully integrates electrical stimulation to traditional acupuncture. During the treatment, the simulation parameters (e.g. waveform, frequency, pulse width, intensity, and time) are configured to simulate the effect of the acupuncture needle. Then, a current will apply on the acupoints via the needle or electrode, causing physiological changes to the body. Along the low-resistance collaterals between acupoints and organs, the voltage change quickly propagates to the tissues around the acupoints and the corresponding organs. In this way, the pathological imbalance will be converted into a physiological equilibrium. Meanwhile, the neurons around the acupoints will generate biological currents, which will rapidly flow to the brain under the reverse biological piezoelectric effect, and regulate the disordered function of cerebral cortex.
2.1.1 Electric current
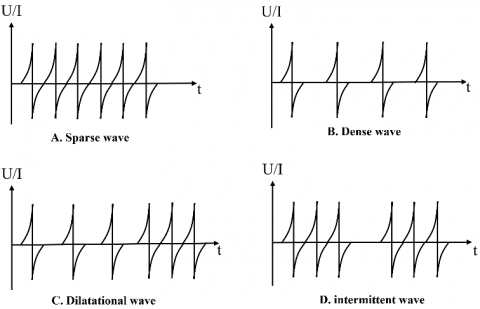
Electrical pulse stimulation is the foundation of electroacupuncture. The pulse wave could be continuous, dilatational, or intermittent. The continuous wave can be further split into sparse wave and dense wave (Figure 1).
Figure 1. The regular pulse waves
(1) Continuous wave
Continuous wave is an unmodulated sequence of electric pulses with a fixed frequency If the frequency is below 30Hz, the continuous wave is a sparse wave suitable for neuromuscular function recovery. The sparse wave causes muscles to vibrate and contract, pushes up the tension of ligament, induces the contraction of blood vessels, and promotes blood circulation. If the frequency is above 30Hz, the continuous wave is a dense wave suitable for easing the pain in certain areas of body surface.
(2) Dilatational wave
Dilatational wave, a combination of alternating sparse and dense waves, enhances blood and lymphatic circulations, regulates ion operation and nutrient metabolism, brings rhythmic muscle relaxation, and causes back strain and neuromuscular paralysis. This wave has good curative effect on soft tissue and fascia injuries and other diseases.
(3) Intermittent wave
Intermittent wave is a sequence of electric pulses obtained by rectangular pulse modulation of a continuous wave. Capable of inducing significant muscle tremor, this wave can effectively improve neuromuscular excitability.
2.1.2 Stimulation parameters
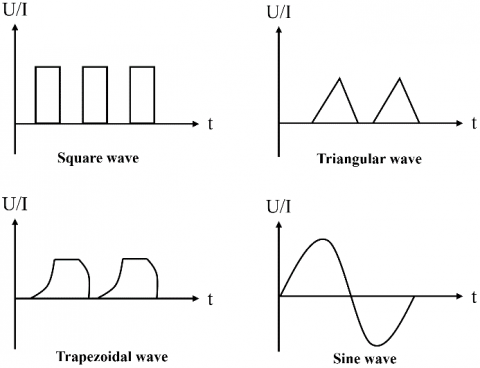
(1) Waveform
Figure 2. The basic waveforms
As shown in Figure 2, the pulse wave for electroacupuncture could be triangular, sinusoidal, square, and trapezoidal. The waveforms are either unidirectional or bidirectional, and symmetrical or asymmetrical. Figure 3 presents the clinically applicable completely asymmetrical, or symmetrical bidirectional pulse waves with zero direct current (DC) component, and alternating positive and negative outputs.
Figure 3. The asymmetrical and symmetrical pulses
(2) Intensity
According to the Chinese national standards for medical electrical equipment, the maximum output voltage of electrical stimulation devices should not surpass 40V, and the current acting on human body should be controlled within 5mA; otherwise, the electrical intensity will endanger patient safety.
(3) Frequency
Pulse frequency refers to the number of pulses per second. Considering the stimulation effects of electrical pulses on nerve fibers, the clinical pulse frequency was divided into low frequency (1-1,000Hz), intermediate frequency (1,000-100,000Hz), and high frequency (>100,000Hz). The suitable frequency should be selected as per the specific disease.
2.2 Fundamentals of software design
A classic principle of TCM is different treatments for the same disease, that is, the treatment must be pertinent to the nature of the disease and sufficiently effective. TCM theories believe that the surface changes of the tongue and the appearance of human body are closely related to the qi and blood function of the viscera. Hence, symptom differentiation of the same disease can be realized based on the features of tongue surface and facial expressions. After the differentiation, the suitable acupoints and electrical stimulation parameters can be selected to implement personalized rehabilitation. Drawing on the previous research, this paper sets up an index system for tongue, face, and eye expressions, as shown in Figure 4.
2.2.1 Intelligent differentiation
The AI has gradually permeated into the medical field [25]. The AI application in intelligent identification of TCM symptoms helps to promote the standardization of TCM diagnosis and treatment, and facilitate home-based symptom differentiation. The following techniques were adopted to intelligently differentiate between TCM symptoms.
(1) Intelligent recognition of face and tongue colors
To intelligently recognize face and tongue colors, this paper proposes a chromatographic analysis algorithm, which makes sparse representations of colors. The algorithm maps each point into an eigenvector in the 3D color space, and quantifies the symptoms of tongue and face colors in the color spectrum. The variance, skewness, and kurtosis were taken as different statistical features. Compared with traditional methods that directly analyze the 3D color coordinates in the color space (e.g. RGB and HSV), the proposed chromatographic analysis algorithm can accurately describe the similar colors, and distinguish between different colors of the face and tongue.
Figure 4. The index system for tongue, face, and eye expressions
(2) Intelligent recognition of eye expressions
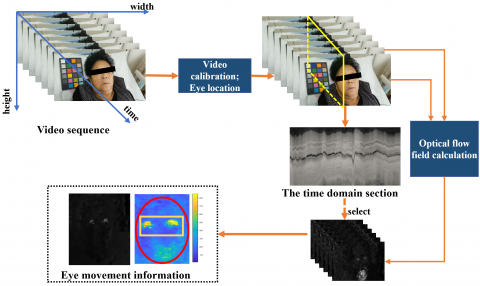
To intelligently recognize eye expressions, this paper combines spatiotemporal slicing with the optical flow field method to identify the eye state of the patient. Spatiotemporal slicing creates a motion detection model in the (x, y, t) space, and perceives the motions in various directions by computing the spectral energy of each spatiotemporal slice. Every slice is a two-dimensional (2D) image composed of a column or row of pixels extracted at the same position from a sequence of continuous images (without changing the x or y coordinate). Two steps are required to extract a slice: the images in the sequence are arranged in chronological order to form a cube, and the cube is meshed perpendicularly to or horizontally along the time axis, producing a time-varying slice.
The optimal flow field method determines the movement of each pixel, according to the time variation and correlation of pixel intensity in the image sequence, that is, captures the relationship between time variation in grayscale and the target structure or movement. As a mirror of image change, the optical flow is calculated based on the movement of the corresponding pixels between the two frames at the start and the end of the image sequence. The target movement can be deciphered from the optical flow.
2.3 Prescription recommendation
The human body has multiple of acupoints to choose from. Besides, there is no unified standard on the electrical stimulation parameters for different symptoms. To facilitate home use of electroacupuncture, this paper determines the prescription of electrical stimulation through fuzzy analytic hierarchy process (AHP), drawing on the experience of TCM clinicians. The prescription recommendation can be implemented as follows.
Firstly, an evaluation index system (EIS) was established for electrical stimulation prescription. A total of three primary indices were selected for the EIS: U={U1, U2, U3}. Then, each primary index Ui={i=1,2,3} was broken down into Mi secondary indices Ui={Ui1, Ui2,…,Uij} (i=1,2,3;j=1,2,…,m), where Uij is the j-th secondary index under Ui.
Let ai={i=1,2,3} be the weight of Ui. Then, the primary level weight set can be expressed as $A=\left\{a_{1}, a_{2}, a_{3}\right\}, 0 \leq a_{i} \leq 1, \sum_{i=1}^{3} a_{i}=1$. Let $a_{i j}(i=1,2,3 ; j=1,2, \ldots, m)$ be the weight of Uij. Then, the secondary level weight set can be expressed as $\begin{aligned} A_{i} &=\left\{a_{i 1}, a_{i 2}, \ldots, a_{i m_{i}}\right\}, 0 \leq a_{i j} \leq 1, \sum_{j=1}^{m_{i}} a_{i j}=1, i= 1,2,3 ; j&=1,2, \ldots, m_{i} \end{aligned}$.
To evaluate the prescription, five levels were designed for the EIS:
v={strongly fit, slightly fit, neutral, slightly unfit, strongly unfit}.
The weight coefficient of each secondary index was calculated based on the judgement by a team of hypertension clinicians. According to expert judgement, each secondary index Uij was given a membership to each level (rij1, rij2,…, rij5). Then, the evaluation results of Mi factors can be expressed as a fuzzy single-factor evaluation matrix Ri of order Mi´5 for the primary level fuzzy comprehensive evaluation (FCE) of Ui:
$R_{i}=\left[\begin{array}{cccc}r_{i 11} & r_{i 12} & \cdots & r_{i 15} \\ r_{i 21} & r_{i 22} & \cdots & r_{i 25} \\ \vdots & \vdots & \ddots & \vdots \\ r_{i m_{i} 1} & r_{i m_{i} 2} & \cdots & r_{i m_{i} 5}\end{array}\right](i=1,2,3)$,
where, rijn is the membership of Uij to level n(n=1,2,…,5). According to the weight set Ai, the primary level FCE matrix of y can be established as:
$C_{i}=A_{i}{ }^{\circ} R_{i}=\left(a_{i 1}, a_{i 2}, \ldots, a_{i m_{i}}\right) \circ\left[\begin{array}{cccc}r_{i 11} & r_{i 12} & \cdots & r_{i 15} \\ r_{i 21} & r_{i 22} & \cdots & r_{i 25} \\ \vdots & \vdots & \ddots & \vdots \\ r_{i m_{i} 1} & r_{i m_{i} 2} & \cdots & r_{i m_{i}}\end{array}\right]=\left(c_{i 1}, c_{i 2}, \ldots, c_{i m_{i}}\right)$,
where, ° is a composition operator.
The single-factor evaluation matrix R of FCE can be constructed by merging the fuzzy judgment matrices Ci=(i=1,2,3) of the primary indices:
$R=\left[\begin{array}{l}C_{1} \\ C_{2} \\ C_{3}\end{array}\right]=\left[\begin{array}{ll}A_{1}{ }^{\circ} R_{1} \\ A_{2}{ }^{\circ} R_{2} \\ A_{3}{ }^{\circ} R_{3}\end{array}\right]=\left(c_{i m}\right)_{3 \times 5}$ .
Therefore, the secondary level FCE set can be established as:
$C=A^{\circ} R=\left(a_{1,} a_{2,} a_{3}\right)^{\circ}\left[\begin{array}{ll}A_{1}{ }^{\circ} R_{1} \\ A_{2}{ }^{\circ} R_{2} \\ A_{3}{ }^{\circ} R_{3}\end{array}\right]=\left(c_{1}, c_{2}, \cdots, a_{5}\right)$ .
Finally, the electrical stimulation prescription corresponding to the index with the largest weight in the evaluation results was selected as the most suitable prescription.
3.1 Overall framework
One of the defining trends in the medical industry is the coupling between AI and medical theory in the development of auxiliary diagnosis and treatment systems. This paper develops an ISD-ESR system by virtue of TCM theories and modern technologies.
Figure 5. The overall framework of the proposed system
As shown in Figure 5, the system mainly encompasses a software part, and a hardware part. The hardware part collects the health data of the patient (e.g. tongue color, and face color). Then, the software part analyzes the collected data to identify the specific symptom. After that, the result is fed back, and used to control the electroacupuncture devices, laying the basis for personalized pulse stimulation.
3.2 Hardware design
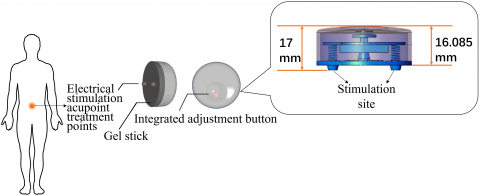
Traditional electrical stimulation devices must be operated and adjusted manually by professionals. None of them is suitable for home use by ordinary users. To solve the problem, this paper designs a wearable noninvasive ESR device based on the electrical stimulation parameters (Section 2), which is portable and fit for home use.
As shown in Figure 6, the designed ESR device is 40mm in diameter and 17mm in height. The device can be applied on acupoints via a magnetic electrode combined with a gel sheet. Bluetooth multi-pass control was adopted to control multiple acupoints simultaneously. In this way, the proposed device could provide personalized electrical stimulation to each patient, in the light of the results of symptom differentiation.
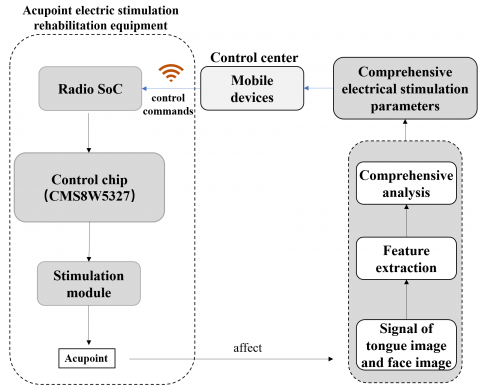
After the software part fully analyzes the health data, the ESR device will intelligently adjust the waveform, frequency, width, time, and other parameters of electrical stimulation. Figure 7 explains the working mechanism of the device, and Table 1 lists its key technologies.
The ESR device accepts the feedback control commands from the host, and flexibly adjust the stimulation parameters to output electrical pulse or pulse sequences with the corresponding constant current or voltage.
Figure 6. The proposed ESR device
Figure 7. The working mechanism of the ESR device
As shown in Figure 8, the stimulation module consists of a high-precision controller, a command processor, a digital/analog converter, and a pulse amplifier. Among them, the command processor generates multi-channel electrical stimulation signals with highly precise frequency, amplitude, width, and time; the D/A converter transforms the control commands into high-precision analog stimulation signals. Two-way electrical pulse signals were used to balance the electric charge generated by electrical stimulation. In addition, an isolation protection circuit was added to ensure safety.
Table 1. The key technologies of the ESR device
|
Stimulation module |
Closed loop control module |
Purpose |
|
1. Bluetooth multi-pass control 2. Fast, high-precision control of small electrical stimulation signals |
Through real-time estimation of key parameters of the dialectical system, a closed-loop observer based on unscented Kalman filter generates a control signal according to the error between the estimated parameter and the preset standard parameter. |
Intelligent adjustment of electrical stimulation parameters as per the patient’s health state |
Figure 8. The sketch map of the stimulation module
3.3 Software design
The software part of the proposed ISD-ESR system contains two modules: symptom differentiation module, and prescription recommendation module. The former differentiates between symptoms through color and texture analyses on tongue and face images. The latter establishes the mapping between symptom features and prescriptions through big data analysis and DL, and recommends the prescription that fully matches insomnia features.
3.3.1 Symptom differentiation module
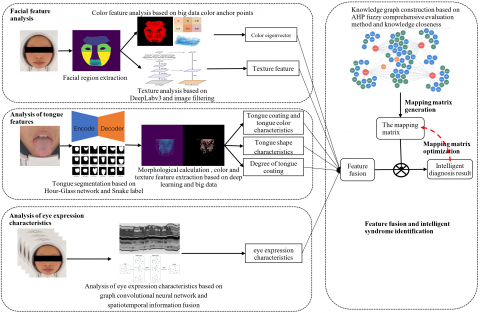
To intelligently differentiate between TCM symptoms, it is necessary to collect multi-modal health data, and normalize the multi-dimensional features of the face, tongue, and eye expressions. Figure 9 explains the mechanism of the proposed symptom differentiation module.
(1) Facial feature analysis
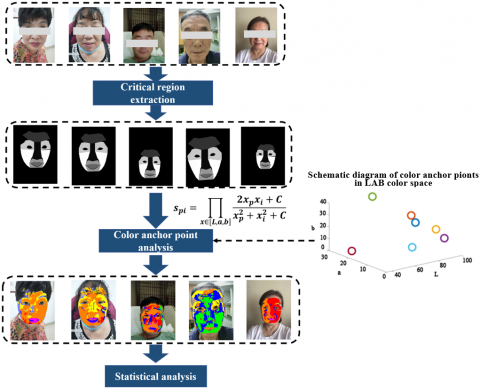
Drawing on empirical evidence and unsupervised learning of massive patient data, this paper selects red, yellow, and other colors as the colors of N anchors in the CIE Lab color space:
$\left[\begin{array}{ccc}L_{0} & a_{0} & b_{0} \\ L_{1} & a_{1} & b_{1} \\ L_{2} & a_{2} & b_{2} \\ \cdots & \cdots & \cdots \\ L_{N-1} & a_{N-1} & b_{N-1}\end{array}\right]$.
For a pixel p of facial color, its chromaticity in the CIE Lab color space can be denoted as $\left[\begin{array}{lll}L_{p} & a_{p} & b_{p}\end{array}\right]$. Then, then the similarity $S_{p i}$ of this pixel to the i-th color anchor can be calculated by:
$S_{p i}=\prod_{x \in[L, a, b]} \frac{2 x_{p} x_{i}+C}{x_{p}^{2}+x_{i}^{2}+C}$.
Then, the similarity of the color of pixel p to each of the N color anchor was calculated iteratively, and the highest similarity was chosen as the feature of that pixel.
During the facial feature analysis, the face region was detected in the input image of the patient, and segmented into the subregions of the cheeks, forehead, nose, mouth, and eyes. Then, color similarity calculation was performed to obtain the distribution of color features across the face and in each subregion. Then, the facial color features were reconstructed from the distribution information by a restricted Boltzmann machine (RBM).
Figure 9. The mechanism of symptom differentiation module
Figure 10. The workflow of facial feature extraction and analysis
The facial color features are real-valued column vectors. Each feature represents a specific facial color, such as, red, yellow, and faint, to name but a few. The value of each feature belongs to the interval of [0, 1]. If the value is zero, the relevant feature does not exist; if the value is 1, the relevant feature is salient.
Textures like wrinkles and pouches were extracted through Gaussian interpolation, corrosion expansion, and other morphological operations. The traditional image filters cannot robustly estimate facial acnes, under the disturbance from glasses, hair, and ecchymosis. Here, DeepLabv3 is improved into a robust DNN through the training on numerous facial acne images. Through cavity convolution and spatial pyramid pooling, the DNN can pinpoint acnes of varied sizes, without sacrificing the resolution of the predicted image. Figure 10 explains the process of facial feature extraction and analysis.
(2) Tongue feature analysis
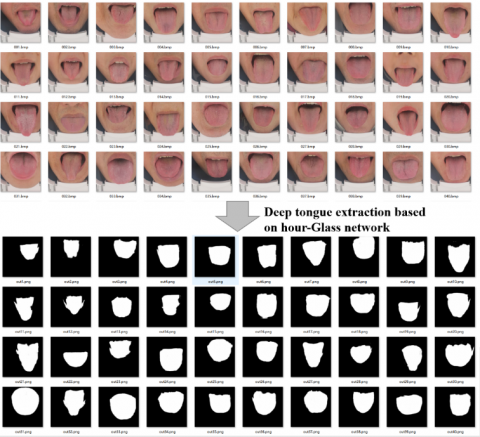
The premise of tongue feature analysis is to extract the tongue body. For accurate and automatic segmentation of tongue body, an active contour algorithm, i.e. snake-based tongue body extraction algorithm, were trained with many images where the tongue is labeled. The training model is a CNN with Pixel2Pixel hourglass design. The trained algorithm can accurately capture the tongue body. Figure 11 presents part of the test results on tongue body extraction.
To improve the prediction accuracy, face detection was carried out on each input tongue image first. If the input image was found to cover the entire face, the subregion of tongue would be roughly segmented based on the positions of cheeks and nose; otherwise, the input image was directly imported to the tongue segmentation network.
By similar extraction methods for facial color features, the tongue body and tongue coating color eigenvectors were extracted, and features like the greasiness and degree of tooth marks were calculated through DL and morphological operations.
Figure 11. The test results on tongue body extraction
(3) Eye expression analysis
Through spatiotemporal slicing and optical flow field method, the information on the eye movements of the patient was captured, and synthetized by the LSTM to estimate his/her eye expression. The spatial relationship between key positions (e.g. eyes, nose, and mouth) was described by graph network, and the eye expressions were analyzed and judged by spatiotemporal graph convolutional network. Figure 12 specifies the workflow of eye expression analysis.
Figure 12. The workflow of eye expression analysis
(4) Feature aggregation
The authors prepared a knowledge map of insomnia through AHP and FCE. The mapping from feature indices to symptoms was constructed according to the knowledge base. Let f be a feature index (column vector), and i, j, and k elements of f be the three features of a symptom in the knowledge base. Then, the judgement criterion CA of whether the patient has symptom A can be expressed as:
$c_{A}=f^{T} w_{A}$,
where, wA is the weight column vector with the same dimension as f. Under the prior constraints in the knowledge base, there exist $w_{A}^{(i)}>0, w_{A}^{(j)}>0, w_{A}^{(k)}>0,$ and $w_{A}^{(l)}=0, l \notin\{i, j, k\}$. If CA is greater than a certain threshold, the patient is very likely to have symptom A. The inverse is also true.
To realize accurate differentiation and ensure the interpretability of the model, the feature matrix KA was introduced to characterize the antagonistic relationship between the features of symptom A. Without loss of generality, it is assumed that feature fi contributes to symptom A, while fi does not contribute to symptom A, i.e. $w_{A}^{(i)}>0, w_{A}^{(j)}=0$. However, the probability of symptom A is not affected, when both fi and fj are salient. In this case, $c_{A}=f^{T} w_{A}$ can be expanded to:
$c_{A}=f^{T} K_{A} f+f^{T} w_{A}$.
To describe the complementary relationship between features, it is further assumed that $K_{A}^{(i, j)}=K_{A}^{(j, i)}=-1 * w_{A}^{(i)}$. If there is no antagonistic relationship between the features of symptom A, then KA is the identity matrix.
In the premise of satisfying the prior knowledge, the parameters in KA and wA were finetuned through the training on big data samples, thereby optimizing the diagnosis model.
3.3.2 Prescription recommendation module
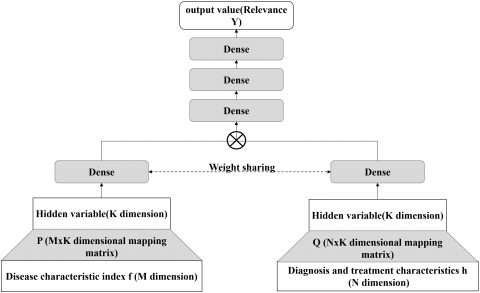
The prescription recommendation module is rooted on the proposed electroacupuncture device. The module intelligently searches for the most suitable prescription that matches the symptom feature index f of the patient. Firstly, one-hot coding was adopted to map the prescriptions made by medical experts to different prescription features h. Then, a big data platform was established to provide massive training samples $\mathrm{S}=\left\langle f^{(i)}, h^{(i)}\right\rangle, i=1 \ldots L$ . The i-th training sample is composed of symptom feature index $f^{(i)}$ obtained from the symptom differentiation module, and the prescription feature $h^{(i)}$ obtained through one-hot coding.
Figure 13. The DNN-based collaborative filtering framework
Figure 14. The realization logic of the proposed ISD-ESR system
Next, a DNN-based collaborative filtering framework (Figure 13) was introduced to map the symptom feature index $f^{(i)}$ and the prescription feature $h^{(i)}$ to the same hidden variable space. The distance measurement function of hidden variables was optimized through the DNN. The first i symptom feature indices $f^{(i)}$ and the first j prescription features $h^{(i)}$ were mapped into matrices P and Q, respectively, in the k-dimensional hidden variable space. Through the link sharing layer, the left and right sides of the eigenvectors were subject to point multiplication, producing the degree of correlations between $f^{(i)}$ and $h^{(i)}$ . After multiple nonlinear mappings, the comprehensive degree of correlation was obtained. The predicted degree of correlation $y^{(i, j)}$ can be expressed as:
$y^{(i, j)}=\delta_{L}\left(W_{L} d_{L-1}+b_{L}\right)$,
$d_{L-1}=\delta_{L-1}\left(W_{L-1} d_{L-2}+b_{L-1}\right)$ ,
$\cdots$
$d_{0}=\delta_{0}\left(W_{0} P f^{(i)}+b_{0}\right) \odot \delta_{0}\left(W_{0} Q h^{(j)}+b_{0}\right)$.
The training label $^{(i, j)}$ can be obtained by:
label $^{(i, j)}=1$ if $i==j$ or $h^{(i)}==h^{(j)} ; 0$ otherwise.
By minimizing the mean squared error (MSE) of label $^{(i, j)}$ and $y^{(i, j)}$, the above network was trained to intelligently measure the degree of correlation, i.e. the degree of matching, between the symptom features and prescription features. In actual application, the degree of matching between the symptom features and the features of each prescription needs to be calculated in turn. Then, the several prescriptions with the highest degrees of matching should be recommended to the patient.
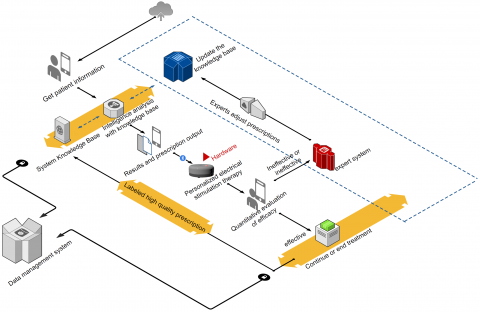
The proposed ISD-ESR system aims to provide the patient with suitable electric stimulation prescriptions from the knowledge base, according to his/her health data extracted from face images. To realize personalized intelligent control, the mobile terminal is matched with the electric stimulation device via Bluetooth. The periodic data obtained by the system serve as the quantitative index of efficacy. Through efficacy evaluation, the prescriptions with no or limited effect are pushed to the expert system for analysis. Then, the experts adjust the prescriptions in a timely manner. The optimal prescription is identified by fuzzy evaluation algorithm, and updated to the knowledge base. The high-quality prescriptions are labeled in the knowledge base, providing a reference for future diagnosis. Figure 14 shows the realization logic of the proposed ISD-ESR system.
4.1 ESR device
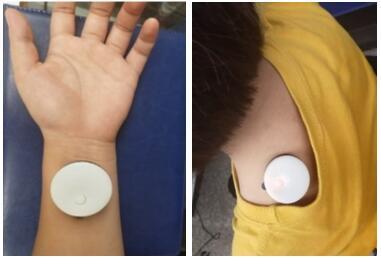
Figure 15 presents the photos of the proposed wearable ESR device, and Table 2 lists its performance indices.
Figure 15. The photos of the proposed wearable ESR device
Table 2. The performance indices of the wearable ESR device
|
Parameter |
Description |
|
Power supply |
3.7V, 100mAh, polymer battery (with protective plate) |
|
Power loss |
<30MW |
|
Charging voltage |
5V |
|
Charging current |
<500mA |
|
Charging mode |
Wireless charging |
|
Wireless connection |
Bluetooth 5.0 |
|
Output electrode |
Magnetic type |
|
Output direction |
A-B; B-A; Two-way; |
|
Output frequency |
1-100 (Hz) |
|
Output pulse width |
100-600 (μs) |
|
Output timing |
10-30 (min) |
|
Output mode |
Continuous wave; dilatational wave; intermittent wave; mixed wave |
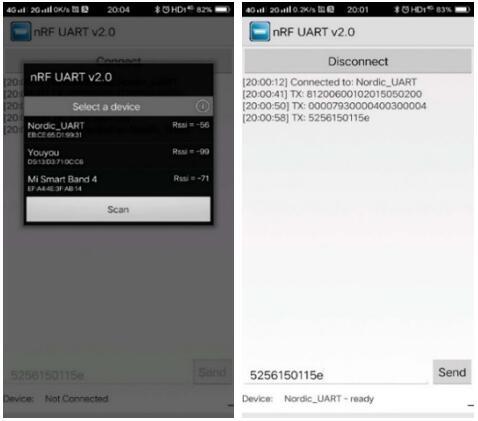
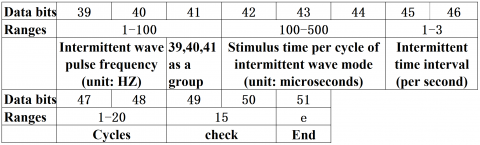
The wearable ESR device adopts the latest Bluetooth 5.0 technology to communicate with the smartphone of the patient. The operation and parameter output of the device are controlled by 51 characters, which represent each parameter index. Figure 16 illustrates the parameter control of the wearable ESR device, and Figure 17 defines the data bits and value ranges of parameters.
4.2 Symptom differentiation and prescription recommendation
The intelligent recommendation of electrical stimulation prescriptions and feedback of the curative effect of electrical stimulation will generate a massive amount of data. For efficient and unified management of the mass data, this paper builds a modular and standardized virtual cloud management platform, featuring high independence, computability, safety, controllability, and intelligence. In the platform, the modules can be selected and combined freely, and the architecture and interfaces can be expanded easily. In addition, the platform supports distributed services and load balancing.
In the cloud management platform, the datacenter is composed of functional modules like cloud service delivery, cloud resource scheduling and management, automated operation and maintenance, intelligent monitoring, and business processes. Each functional module is loosely coupled and highly modular. The modules can be combined and deployed on demand to reduce the procurement cost. Moreover, the system design is highly scalable, such that additional modules can be developed to satisfy personalized needs of the patient.
Figure 16. The parameter control of the wearable ESR device
Figure 17. The definition of data bits and value ranges of parameters
Figure 18. The cloud management platform
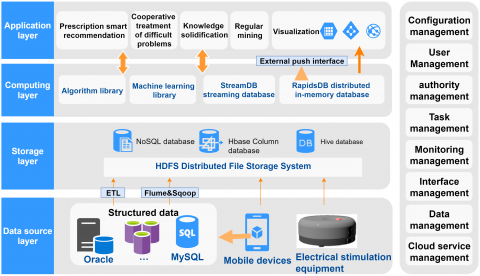
As shown in Figure 18, the cloud management platform consists of a data source layer, a storage layer, a computing layer, and an application layer.
(1) Data source layer
This layer collects the sensor data during electrical stimulation, as well as the data on tongue, face, and eye images, and loads the structured data into a large distributed storage system after batch extraction or ETL (extract, transform, load) processing.
(2) Storage layer
The big data storage platform is based on Rapids Hadoop. The core components are Hadoop Distributed File System (HDFS), NoSQL, HBase, and Hive. Together, the storage components can process and analyze big data, and realize data operations like import, integration, conversion, processing, analysis, reporting, and output.
(3) Computing layer
The computing layer calculates and mines massive historical data through streaming computing under distributed memory architecture. A customized algorithm library is employed to recommend prescriptions that befit the insomnia symptoms, and empower collaborative treatment of intractable diseases. The knowledge base is enriched through knowledge consolidation. Meanwhile, a general machine learning library is used to deeply mine historical cases, and standardize electrical stimulation prescriptions.
(4) Application layer
The application layer recommends prescriptions based on the ISD-ESR system, collaborative treatment of intractable diseases, and the knowledge consolidation. In addition, this layer visualizes the analysis results and push prescriptions to the patient.
According to the Evidence-Based Guidelines of Chinese Medicine for Insomnia (WHO/WPO) (2016 edition), the symptom differentiation criteria of insomnia include the common deficiency of heart and spleen, the qi deficiency of heart and gallbladder, heart disturbing phlegm-heat, and the stagnation of liver qi.
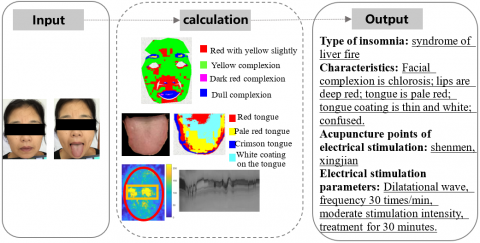
Taking 30 patients with primary insomnia from the sleep center of a tertiary hospital as subjects, this paper verifies the feasibility and effectiveness of the proposed ISD-ESR system through online TCM symptom identification and electroacupuncture. The tongue features, facial features, and eye expressions of the patients were imported to the proposed system via a smartphone. The results show that our system accurately predicted 93.3% of the insomnia symptoms. Only 2 cases were misinterpreted. An example of symptom differentiation is displayed in Figure 19.
Figure 19. An example of symptom differentiation
Table 3. The comparison between the two groups before and after treatment
|
Group |
PSQI |
SF-36 |
||
|
Before treatment |
After treatment |
Before treatment |
After treatment |
|
|
Test group (n=15) |
12.76±1.92 |
4.13±0.86 |
54.81±10.38 |
83.63±9.34 |
|
Control group (n=15) |
12.65±2.06 |
7.79±1.27 |
56.85±11.72 |
70.25±9.47 |
|
t-value |
0.864 |
3.498 |
1.353 |
4.762 |
|
P-value |
>0.05 |
<0.05 |
>0.05 |
<0.05 |
Furthermore, 30 insomnia patients were randomly divided into a control group (15 cases) and a test group (15 cases). The control group was treated with conventional Western medicine, and the test group was treated with symptom differentiation and electrical stimulation in addition to conventional treatment. The treatment cycle was 4 weeks. After the treatment, the two groups were compared in sleep quality and life quality, respectively measured by Pittsburgh Sleep Quality Index (PSQI) and 36-Item Short Form Survey (SF-36). The PSQI score, ranging from 0 to 21 points, is positively correlated with sleep quality. The SF-36 scores were converted into a percentage system. As shown in Table 3, the two groups had statistically significant differences (P<0.05) in both sleep quality and life quality after the treatment.
Under the TCM principle of symptom differentiation, electrical stimulation with acupoints and parameters matching the specific symptom of the patient can effectively alleviate or cure diseases. However, the existing electrical stimulation devices are unable to treat a single symptom or handle diverse symptoms. To solve the problem, this paper designs an ISD-ESR system which facilitates home rehabilitation in a wearable and intelligent way, and improves the life quality of patients. On the one hand, the proposed system recommends the best prescriptions based on online health data (e.g. tongue features and eye expressions), realizing personalized on-demand treatment. On the other hand, the proposed system can adjust the parameters of electrical stimulation in real time based on the feedbacks of the curative effect, which further improves the effect of symptom differentiation and electrical stimulation.
This research was supported by "Integrated equipment package for individualized intelligent rehabilitation diagnosis and treatment of traditional Chinese medical encephalopathy at home -- Take insomnia and epilepsy as an example based on traditional Chinese medical intelligent syndrome differentiation for treatment" which is the medical device special item (2021C03116) in Zhejiang Province key research and development plan.
[1] Wang, H., Liu, X., Lv, B., Yang, F., Hong, Y. (2014). Reliable multi-label learning via conformal predictor and random forest for syndrome differentiation of chronic fatigue in traditional Chinese medicine. PloS One, 9(6): e99565. https://doi.org/10.1371/journal.pone.0099565
[2] Guo, Y., Ren, X., Chen, Y.X., Wang, T.J. (2019). Artificial intelligence meets Chinese medicine. Chinese Journal of Integrative Medicine, 25(9): 648-653. https://doi.org/10.1007/s11655-019-3169-5
[3] Liu, Y. (2020). Artificial intelligence–based neural network for the diagnosis of diabetes: Model development. JMIR Medical Informatics, 8(5): e18682. https://doi.org/10.2196/18682
[4] Li, X. (2020). Artificial intelligence neural network based on intelligent diagnosis. Journal of Ambient Intelligence and Humanized Computing. https://doi.org/10.1007/s12652-020-02108-6
[5] Rajpurkar, P., Hannun, A.Y., Haghpanahi, M., Bourn, C., Ng, A.Y. (2017). Cardiologist-level arrhythmia detection with convolutional neural networks. arXiv preprint arXiv:1707.01836. https://doi.org/10.1038/s41591-018-0268-3
[6] Esteva, A., Robicquet, A., Ramsundar, B., Kuleshov, V., DePristo, M., Chou, K., Cui, C., Corrado, G., Thrun, S., Dean, J. (2019). A guide to deep learning in healthcare. Nature Medicine, 25(1): 24-29. https://doi.org/10.1038/s41591-018-0316-z
[7] Attia, Z.I., Kapa, S., Lopez-Jimenez, F., McKie, P.M., Ladewig, D.J., Satam, G., Pellikka, P.A., Enriquez-Sarano, M., Noseworthy, P.A., Munger, T.M., Asirvatham, S.J., Scott, C.G., Carter, R.G., Friedman, P.A. (2019). Screening for cardiac contractile dysfunction using an artificial intelligence–enabled electrocardiogram. Nature Medicine, 25(1): 70-74. https://doi.org/10.1038/s41591-018-0240-2
[8] Choi, J.Y. (2017). Improved deep face identification with multi-class pairwise discriminant loss. Electronics Letters, 53(20): 1356-1358. https://doi.org/10.1049/el.2017.2108
[9] Sural, S., Qian, G., Pramanik, S. (2002). Segmentation and histogram generation using the HSV color space for image retrieval. Proceedings. International Conference on Image Processing, Rochester, NY, USA, pp. II-II. https://doi.org/10.1109/ICIP.2002.1040019
[10] Antonini, M., Barlaud, M., Mathieu, P., Daubechies, I. (1992). Image coding using wavelet transform. IEEE Transactions on Image Processing, 1(2): 205-220. https://doi.org/10.1109/83.136597
[11] Muhammad, G., Al-Hammadi, M.H., Hussain, M., Bebis, G. (2014). Image forgery detection using steerable pyramid transform and local binary pattern. Machine Vision and Applications, 25(4): 985-995. https://doi.org/10.1007/s00138-013-0547-4
[12] Wang, Z., Simoncelli, E.P., Bovik, A.C. (2003). Multiscale structural similarity for image quality assessment. The Thrity-Seventh Asilomar Conference on Signals, Systems & Computers, 2003, Pacific Grove, CA, USA, pp. 1398-1402. https://doi.org/10.1109/ACSSC.2003.1292216
[13] Pei, S.C., Chen, L.H. (2015). Image quality assessment using human visual DOG model fused with random forest. IEEE Transactions on Image Processing, 24(11): 3282-3292. https://doi.org/10.1109/TIP.2015.2440172
[14] Larson, E.C., Chandler, D.M. (2010). Most apparent distortion: full-reference image quality assessment and the role of strategy. Journal of Electronic Imaging, 19(1): 011006. https://doi.org/10.1117/1.3267105
[15] Sun, H., Liu, Z., Wang, G., Lian, W., Ma, J. (2019). Intelligent analysis of medical big data based on deep learning. IEEE Access, 7: 142022-142037. https://doi.org/10.1109/ACCESS.2019.2942937
[16] Oh, S.J. (2013). Design of a smart application using ad-hoc sensor networks based on Bluetooth. The Journal of the Institute of Internet Broadcasting and Communication, 13(6): 243-248. https://doi.org/10.7236/JIIBC.2013.13.6.243
[17] Lee, D.Y., Jiu, Y.R., Hsieh, C.L. (2020). Electroacupuncture at Zusanli and at neiguan characterized point specificity in the brain by metabolomic analysis. Scientific Reports, 10: 10717. https://doi.org/10.1038/s41598-020-67766-0
[18] Zhan, H.R., Hong, Z.S., Chen, Y.S., Hong, H.Y., Weng, Z.B., Yang, Z.B., Shi, J.L., Chen, Z.B. (2016). Non-invasive treatment to grade 1 essential hypertension by percutaneous laser and electric pulse to acupoint with music: a randomized controlled trial. Chinese Journal of Integrative Medicine, 22(9): 696-703. https://doi.org/10.1007/s11655-016-2502-5
[19] Zhou, X., Chi, Z., Xiong, J., Huang, G., Li, Z., Yang, Y., Zhou, S., Yang, R., Mao, Q., Wu, D., Shen, Y. (2020). Effectiveness and safety of electroacupuncture for insomnia: A protocol for an overview of systematic reviews and meta-analysis. Medicine, 99(40): e22502. https://doi.org/10.1097/MD.0000000000022502
[20] Ferrucci, D., Brown, E., Chu-Carroll, J., Fan, J., Gondek, D., Kalyanpur, A.A., Lally, A., Murdock, J.W., Nyberg, E., Prager, J., Schlaefer, N., Welty, C. (2010). Building Watson: An overview of the DeepQA project. AI Magazine, 31(3): 59-79. https://doi.org/10.1609/aimag.v31i3.2303
[21] Ferrucci, D.A. (2012). Introduction to “this is Watson”. IBM Journal of Research and Development, 56(3.4): 1:1-1:15. https://doi.org/10.1147/JRD.2012.2184356.
[22] Yang, H.J., Shen, D., Xu, H.Y., Lu, P. (2012). A new strategy in drug design of Chinese medicine: theory, method and techniques. Chinese Journal of Integrative Medicine, 18(11): 803-806. https://doi.org/10.1007/s11655-012-1270-x
[23] Yang, L., Zhou, X., Lanxin, B. I., Zhang, R., Wang, Y., Liu, B., Xie, Q. (2014). Clinical decision support system on basis of case-based reasoning for Traditional Chinese medicine. World Science and Technology-Modernization of Traditional Chinese Medicine, (3): 474-480.
[24] Li, F.G., Ni, Z.W., Hao, L. (2010). Automatic generation of prescription of the traditional Chinese medicine based on case based reasoning and multi-strategy similarity retrieval. Application Research of Computer, 27(2): 544-547.
[25] Deo, R.C. (2015). Machine learning in medicine. Circulation, 132(20): 1920-1930. https://doi.org/10.1161/CIRCULATIONAHA.115.001593