Gokul Chandrasekaran* | Vanchinathan Kumarasamy | Gnanavel Chinraj
OPEN ACCESS
A System-on-Chip (SoC) is an integrated circuit that combines various electronic components in a single die. The SoC components mostly involve user-defined logic, embedded memories, analog, digital and mixed-signal blocks. The testing of an SoC for manufacturing defects is an important task due to IC design complexity, further, it also affects the final cost of the chip. Due to the high complexity involved in SoC test scheduling, various techniques were suggested to reduce the testing time. This paper introduces a novel SoC test scheduling technique based on a Modified Ant Colony Optimization (MACO) algorithm. The testing is performed on the benchmark circuits of ITC’02. The experiments performed on d695 and p22810 SoC benchmark circuits. The results show that the MACO algorithm can achieve reduced test time compared to the ACO algorithm. When compared with ACO, the proposed algorithm MACO reduces the testing time by 47% and 10% for d695 and p22810 SoC benchmark circuits respectively.
system-on-chip (SoC), test access mechanism (TAM), ant colony optimization (ACO), artificial intelligence, modified ant colony optimization
Currently, Integrated Circuits (ICs) are embedded in a variety of products and systems. IC’s comprises of a huge number of transistors and hardware modules. Millions of transistors and hardware modules can be manufactured on a single chip called a System on Chip (SoC). An SoC chip consists of peripheral devices, processors and controllers. The complexity of ICs is a major challenge in SoC design. Intellectual Property (IP) cores used for SoC designs are embedded in system chip and it is impossible to access it directly. Testing cost highly depends on the testing time which increases when the system becomes more complex. After manufacturing to test individual cores on system-level Test Access Mechanism (TAM) is necessary. The major parts in test access architecture of SoC are TAM and Test wrapper. These components have an impact on the vector memory required on Automatic Test Equipment (ATE). The wrapper is a thin shell surrounding the core acting as an interface between the core and TAM [1-3].
The wrapper is linked to core inputs, outputs and scan chains outside the core. The TAM wires are used to apply test vectors to the wrapper. ATE stores the test vectors which are to be applied to SoCs and are applied through TAM wires. The cores are scheduled for testing in order to obtain minimum test time. Due to the increase in SoC size, Test Application Time (TAT), test data volume and test resource usage also increase.
To reduce TAT, SoC test resources should be designed and used effectively. The main aim is to reduce the test time of SoCs by efficient scheduling techniques. In this research paper, a Modified Ant Colony Optimization (ACO) technique is used to optimize the testing time for various ITC’02 SoC benchmark circuits. The results show that the Modified ACO technique provides better results compared to other techniques.
The ITC'02 SoC Test Benchmark circuits are a set of benchmark circuits presented at the IEEE International Test Conference (ITC'02). Table 1 gives the details of the ITC’02 benchmark circuits. Tables 2 and 3 give the details of the d695 and p22810 ITC’02 benchmark circuits respectively.
The task of the optimization algorithm is to minimize the test time taken as the objective function represented in the following equation (1).
$T\left(W_{i}\right)=(1+\max (S i, S o) \cdot t p i+\min (S i, S o)$ (1)
where, Si and So are the length of the input and output scan chain and tpi is the test pattern for the SoC benchmark circuit optimization of core i.
Table 1. Benchmark circuit details
|
SOC |
d695 |
p22810 |
|
|
Number of Modules |
11 |
29 |
|
|
Number of Tests |
10 |
30 |
|
|
Number of Levels |
2 |
3 |
|
|
Number of I/Os |
1845 |
4283 |
|
|
Number of SFFs |
6384 |
24723 |
|
|
Pattern Count |
Minimum |
12 |
1 |
|
Average |
88 |
830 |
|
|
Maximum |
234 |
12324 |
|
|
Number of Scan Chain Length |
137 |
196 |
|
|
Scan Chain Length |
Minimum |
32 |
1 |
|
Average |
46 |
126 |
|
|
Maximum |
55 |
400 |
|
|
Contributor |
Duke University |
Philips Semiconductors |
|
|
Core |
No. of inputs |
No. of Outputs |
Internal Scan Chains |
Min Chain Length |
Max Chain Length |
No. of Tests Patterns |
|
#1 |
32 |
32 |
0 |
0 |
0 |
12 |
|
#2 |
207 |
108 |
0 |
0 |
0 |
73 |
|
#3 |
34 |
11 |
1 |
32 |
32 |
75 |
|
#4 |
36 |
39 |
4 |
52 |
54 |
105 |
|
#5 |
38 |
304 |
32 |
44 |
45 |
110 |
|
#6 |
62 |
152 |
16 |
39 |
41 |
234 |
|
#7 |
77 |
150 |
16 |
33 |
34 |
95 |
|
#8 |
35 |
48 |
4 |
44 |
46 |
97 |
|
#9 |
35 |
320 |
32 |
54 |
54 |
12 |
|
#10 |
28 |
106 |
32 |
51 |
55 |
68 |
|
Core |
No. of inputs |
No. of Outputs |
Internal Scan Chains |
Min Chain Length |
Max Chain Length |
No. of Tests Patterns |
|
#1 |
10 |
67 |
0 |
0 |
0 |
10 |
|
#2 |
10 |
67 |
0 |
0 |
0 |
89 |
|
#3 |
28 |
56 |
10 |
14 |
15 |
785 |
|
#4 |
47 |
33 |
0 |
0 |
0 |
12324 |
|
#5 |
38 |
26 |
0 |
0 |
0 |
3108 |
|
#6 |
48 |
64 |
0 |
0 |
0 |
222 |
|
#7 |
90 |
112 |
29 |
39 |
41 |
202 |
|
#8 |
80 |
64 |
0 |
0 |
0 |
712 |
|
#9 |
84 |
64 |
0 |
0 |
0 |
2632 |
|
#10 |
36 |
16 |
0 |
0 |
0 |
2608 |
|
#11 |
116 |
123 |
24 |
51 |
55 |
175 |
|
#12 |
50 |
30 |
4 |
13 |
15 |
38 |
|
#13 |
56 |
23 |
8 |
16 |
18 |
94 |
|
#14 |
40 |
23 |
11 |
21 |
23 |
93 |
|
#15 |
68 |
149 |
4 |
12 |
12 |
1 |
|
#16 |
22 |
15 |
3 |
26 |
31 |
108 |
|
#17 |
84 |
42 |
6 |
21 |
23 |
37 |
|
#18 |
13 |
43 |
1 |
23 |
31 |
8 |
|
#19 |
223 |
69 |
4 |
12 |
21 |
25 |
|
#20 |
53 |
11 |
5 |
26 |
28 |
644 |
|
#21 |
38 |
29 |
3 |
9 |
9 |
58 |
|
#22 |
45 |
40 |
4 |
12 |
14 |
124 |
|
#23 |
115 |
76 |
10 |
16 |
17 |
465 |
|
#24 |
54 |
40 |
3 |
7 |
8 |
59 |
|
#25 |
31 |
8 |
7 |
14 |
14 |
40 |
|
#26 |
73 |
23 |
5 |
18 |
19 |
27 |
|
#27 |
58 |
46 |
18 |
23 |
24 |
215 |
|
#28 |
66 |
33 |
31 |
34 |
35 |
181 |
|
#29 |
285 |
94 |
1 |
4 |
6 |
2 |
|
#30 |
48 |
43 |
5 |
9 |
10 |
26 |
The different test scheduling methods include non-partitioned, partitioned technique, and preemptive test scheduling. In non-partitioned test scheduling, the new test can not begin until al tests in a session have been completed. Therefore, an improvement in the test time while the partitioned test is scheduled as early as possible. Preemptive test scheduling minimizes idle time.
For core-based systems to reduce test time previous work based on earliest TAM optimization and wrapper design. Based on the core terminals requirement wrapper design algorithm was developed. The Integer Linear Programming (ILP) model was proposed for the "Test Bus Assignment Problem" [4] by the optimal allocation of test buses. A new technique was proposed by Iyengar et al. [5, 6] which was based on a 2-Dimensional rectangle packing problem for the wrapper and TAM co-optimization that uses parity-optimal points.
In open shop scheduling [7] given shop consists of m processors. Each work is performed on more than one processor for each job. The objective of open shop scheduling is to reduce finish time which is the latest completion time of individual schedules for each processor. The 2D bin packing problem was solved by a Simulated Annealing (SA) algorithm [8] which minimizes TAT.
RAIN (RAndom INsertion) algorithm [9] where the core is represented as a rectangle. The rectangle width is TAT and the rectangle height is TAM width. The method of wrapper design has been used to generate a rectangle sequence by using the formulation of a Genetic algorithm. From the collection of rectangles generated for that core, one rectangle must be chosen in order to reduce the overall test time.
The hierarchy aware test planning method used to optimize the TAM of hierarchical SoC has been discussed by Chakrabarty et al. [10]. Two practical scenarios 1) Wrappers and TAM architecture for the child cores are fixed and parent cores are determined. 2) Wrappers and TAM are soft for both the parent and child cores.
A multi-level TAM architecture was proposed by Chakrabarty et al. [10], explaining the use of multi-level TAM optimization flattened SoCs. The new wrapper architecture for parent cores with two disjoint test modes for child and parent core testing is proposed by Goel et al. [11].
3.1 Ant colony optimization (ACO) algorithm
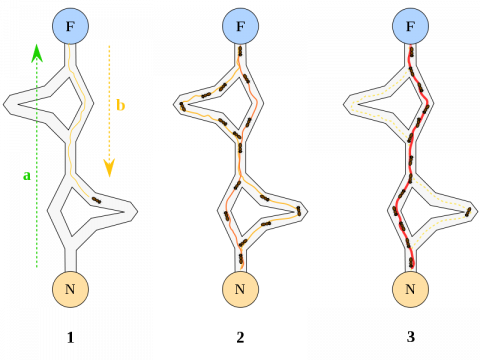
Ant Colony Optimization (ACO) [12, 13] is a population-based approach to solving computational problems. This is based on the social behavior of ants in finding the best route to the nesting food source through indirect communication between the ants using the chemical substance pheromone.
Ants leave pheromones as they move so that other ants can detect and follow this pheromone which is shown in Figure 1.
Figure 1. Ant colony optimization
In ACO, artificial ants use heuristic information and a combination of artificial pheromones to develop new solutions. ACO has been shown to have been very successful in solving many problems.
3.2 Modified ant colony optimization (MACO)
In the Modified Ant Colony Optimization (MACO) [14-16], the core scheduling of the selection is based on 'maxtw' and partly relies on the probability. First, the core is selected based on the probability, and then tested using the constraints. If the conditions are satisfied, the core will be chosen. Otherwise, the next highest probability core will be tested. This step will be repeated until all conditions have been satisfied. Let us assume that an ant begins with a core i and has to reach out to other cores. The first core i is chosen at random and then the next core j is selected with probability ‘prob’. This process will be repeated until all cores have been scheduled. This algorithm uses an ant density model. According to the ant density model, the quantity of the pheromone trail left by the ants remains constant throughout the path.
$\operatorname{prob}_{i j}=\frac{\tau_{i j} \eta_{i j}^{\beta}}{\sum_{i=n}^{n} \tau_{i j} \eta_{i j}^{\beta}}$ (2)
where, probij=Probability of core j being scheduled as the next core
$\tau_{i j}$ = Trail value for pheromones from route i to j >= 0
$\eta_{i j}$ = Heuristic value, which depends on the core test time >= 0
$\eta i j$ = 1/tt where tt is the test time of the core.
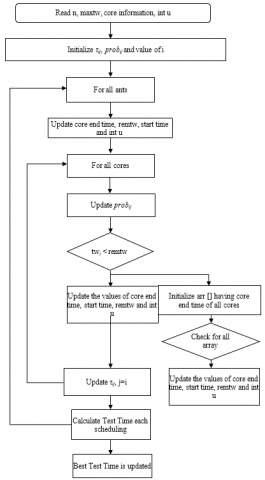
Figure 2. Flowchart for modified ant colony optimization
In ACO cores are selected randomly whereas in MACO cores are selected based on the probability and the cores satisfying the constraints are chosen.
$\beta$ is a parameter for heuristic value enhancement. Its value for hierarchical cores is higher than for flat cores so that the hierarchical cores can be tested first. When an ant travels from core i to j, the pheromone route needs to be updated. This process is referred to as trail intensification. The following Eq. (3) can be used for the formulation of trail intensification.
$\tau_{(i t o j)}=\left\{\begin{array}{l}{Q, \text { if ant goes from } i \text { to } j} \\ {0, \text { otherwise }}\end{array}\right.$ (3)
Q is a parameter that is constant. It is the amount of trail left when an ant moves from core i to j. The trail intensification is done at the time of core selection. After scheduling, using an ant, the test time is calculated. The scheduling process is repeated for no. of ants and the best test time of all is selected. The results using ITC’02 benchmark circuits are shown in the next chapter. This algorithm schedules the cores with a fork and merge technique and provides the optimal solution.
Input: Let there be n number of cores with maximum tam width available which is ‘maxtw’. Each core has a core number, tam width ‘tw’. The test time ‘tt’ of each core is calculated using the wrapper algorithm and the int u which is used to verify whether the core is scheduled or not.
Output: best_time is the minimum test time attained after a number of iterations. The test time is calculated for each iteration and the best_test time represents the minimum test time of all the test times.
Table 4. Input parameters for core initialization
|
Number of Cores |
10 (d695 SoC) 30 (p22810 SoC) |
|
Ant Count |
20 (d695 SoC), 60 (p22810 SoC) i.e. twice the core count |
|
Number of Iterations |
100 |
|
TAM width |
varies between 16 and 64 |
|
Alpha $\alpha$ |
1 (pheromone trail control parameter) |
|
Beta $\beta$ |
1 (parameter used to enhance the heuristic value) |
|
Rho $\rho$ |
1 (Trial persistence) |
Figure 2 shows the MACO algorithm flow chart. Initially, the input parameters are read followed by parameter initialization and for all the ants updating of the parameter is done. The probability for a core i is updated and check the test condition. If the condition is true, the values are updated else if it is false, initialize the array of all cores. Then update pheromone trial and assign i value to j. Test time is calculated and updated with the best test time.
The results obtained using $\mathrm{C} \#$ software and the comparison of the test time obtained using different algorithms are made and the algorithm is evaluated, which gives the minimum test time.
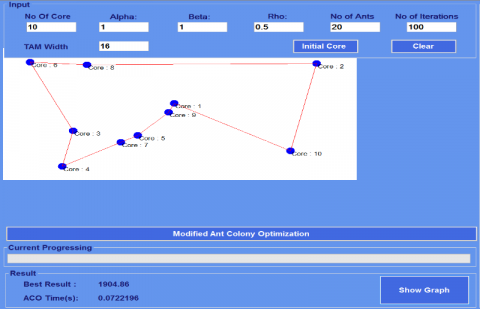
Figures 3 and 4 show the core initialization of the d695 SoC benchmark circuit using ACO and MACO algorithm respectively.
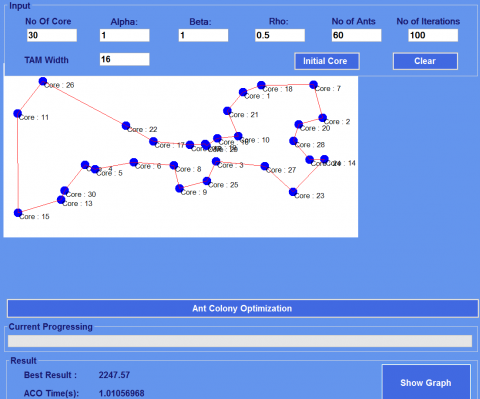
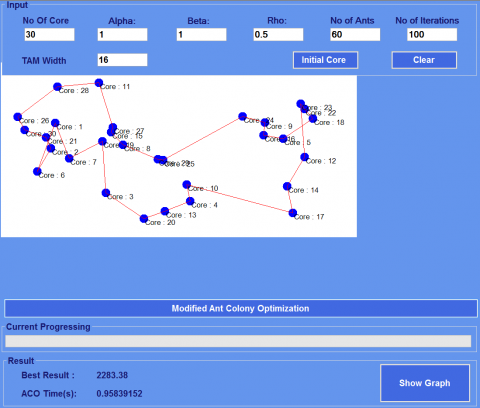
From Figures 3 and 4, it is observed that for the core initialization of d695 using ACO and MACO algorithm several input parameters have been considered and the testing time is obtained as output. Figures 5 and 6 show the core initialization of the p22810 SoC benchmark circuit for TAM width 16 using ACO and MACO algorithm respectively.
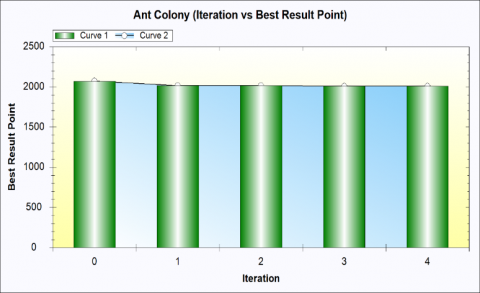
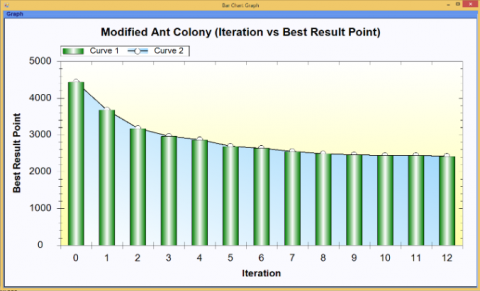
From Figures 5 and 6, it is observed that for the core initialization of p22810 using ACO and MACO algorithm several input parameters have been considered and the testing time is obtained as output. Figures 7 and 8 show the graphical representation of Iteration vs Best Result Point for d695 SoC using ACO and MACO algorithm respectively.
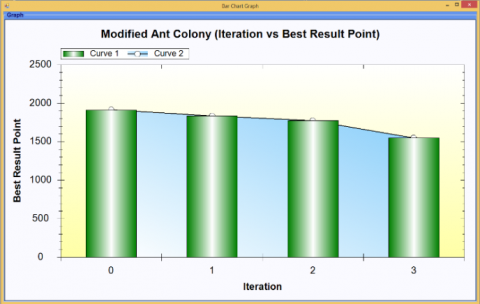
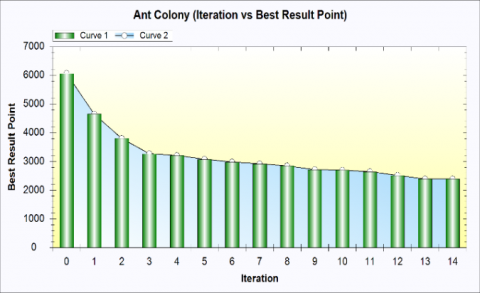
From Figures 7 and 8 it is observed that Best Result Point using ACO and MACO for d695 SoC was achieved at iteration 4 and 3 respectively. Figures 9 and 10 show the graphical representation of Iteration vs Best Result Point for p22810 SoC using ACO and MACO algorithm respectively.
From Figures 9 and 10 it is observed that Best Result Point using ACO and MACO for p22810 SoC was achieved at iteration 14 and 12 respectively. Table 3 shows the comparison of testing time values obtained using the ACO algorithm and MACO algorithm of d695 and p22810 SoC algorithm for various TAM widths 16, 24, 32, 40, 48, 56, 64.
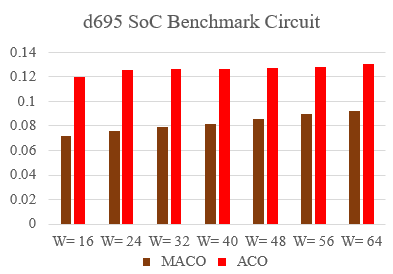
Table 5 shows the result comparison between the ACO and the modified ACO algorithm in terms of their testing time. From Table 5 it is observed that the testing time using the Modified Ant Colony algorithm improved 47% for d698 SoC and improved 10% for p22810 SoC benchmark circuits.
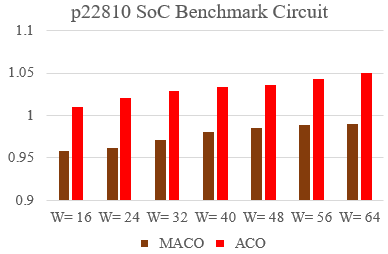
From Figure 11 it is observed that for d695 ITC’02 SoC benchmark circuit, testing time is reduced when the MACO algorithm is used compared to the ACO algorithm. Here the testing time obtained using the MACO algorithm is minimum for the different TAM widths. Similarly, Figure 12 shows the testing time for the p22810 ITC’02 SoC benchmark circuit using ACO and MACO algorithm in graphical format. From Figure 12 it is observed that among the proposed optimization algorithms, the MACO algorithm performs test scheduling with minimum testing time for the different TAM widths.
Table 5. Testing time comparison between ACO and MACO algorithm
|
SoC |
TAM Width |
Testing Time(s) |
|
|
MACO |
ACO |
||
|
d695 |
16 |
0.07221963 |
0.1202265 |
|
24 |
0.07578022 |
0.1257289 |
|
|
32 |
0.07919108 |
0.1263917 |
|
|
40 |
0.08185115 |
0.1268058 |
|
|
48 |
0.08599822 |
0.1272225 |
|
|
56 |
0.08984332 |
0.1281162 |
|
|
64 |
0.09221849 |
0.1302590 |
|
|
p22810 |
16 |
0.95839152 |
1.0105696 |
|
24 |
0.96186944 |
1.0208739 |
|
|
32 |
0.97092460 |
1.0288309 |
|
|
40 |
0.98114871 |
1.0331053 |
|
|
48 |
0.98479880 |
1.0363759 |
|
|
56 |
0.98924347 |
1.0425869 |
|
|
64 |
0.99039125 |
1.0505697 |
|
Figure 4. Core initialization of the d695 benchmark circuit using the MACO algorithm (W=16)
Figure 5. Core initialization of the p22810 benchmark circuit using the ACO algorithm (W=16)
Figure 6. Core initialization of the p22810 benchmark circuit using the MACO algorithm (W=16)
Figure 7. Graph showing iteration vs best result point of ant colony algorithm for d695 SoC
Figure 8. Graph showing iteration vs best result point of modified ant colony algorithm for d695 SoC
Figure 9. Graph showing iteration vs best result point of ant colony algorithm for p22810 SoC
Figure 10. Graph showing iteration vs best result point of modified ant colony algorithm for p22810 SoC
Figure 11. Graphical illustration of testing time using ACO and MACO for d695 SoC
Figure 12. Graphical illustration of testing time using ACO and MACO for p22810 SoC
In this article nature-inspired, Modified ACO optimization algorithm is used to reduce the test time of SoCs. The efficiency of the Modified ACO algorithm is realized by comparing it with the ACO algorithm. Experiments with d695 and p22810 SoC comparisons have shown that the modified ACO algorithm is better than the ACO algorithm. In the case of d695, the Modified ACO algorithm achieves a reduction in test time of 47% when compared to the ACO algorithm, wherein the p22810 case, the Modified ACO algorithm achieves a reduction in test time of 10% when compared to ACO algorithm. The results of the experiment clearly indicate that the modified ACO algorithm is better suited to reducing the test time. In future recent algorithms like Grey Wolf Optimization Algorithm, Whale Optimization Algorithm, Dragonfly Algorithm and Artificial Fish Swarm Algorithm can be used to minimize the test time further.
[1] Pouget, J., Larsson, E., Peng, Z.B. (2005). Multiple-constraint driven system-on-chip test time optimization. Journal of Electronic Testing, 21(6): 599-611. https://doi.org/10.1007/s10836-005-2911-4
[2] Kang, W.J., Hwang, S.Y. (2014). A test wrapper design to reduce test time for multi-core SoC. The Journal of Korean Institute of Communications and Information Sciences, 39(1): 1-7. https://doi.org/10.7840/kics.2014.39B.1.1
[3] Marrouche, W., Farah, R., Harmanani, H.M. (2018). A strength pareto evolutionary algorithm for optimizing system-on-chip test schedules. International Journal of Computational Intelligence and Applications, 17(02): 1850010. https://doi.org/10.1142/S1469026818500104
[4] Chakrabarty, K. (2000). Test scheduling for core-based systems using mixed-integer linear programming. IEEE Transactions on Computer-Aided Design of Integrated Circuits and Systems, 19(10): 1163-1174. https://doi.org/10.1109/43.875306
[5] Iyengar, V., Chakrabarty, K. (2002). System-on-a-chip test scheduling with precedence relationships, preemption, and power constraints. IEEE Transactions on Computer-Aided Design of Integrated Circuits and Systems, 21(9): 1088-1094. https://doi.org/10.1109/TCAD.2002.801102
[6] Chakrabarty, K., Marinissen, E.J. (2003). Test access mechanism optimization, test scheduling, and tester data volume reduction for system-on-chip. IEEE Transactions on Computers, 52(12): 1619-1632. https://doi.org/10.1109/TC.2003.1252857
[7] Wang, Z., Chakrabarty, K., Wang, S. (2009). Integrated LFSR reseeding, test-access optimization, and test scheduling for core-based system-on-chip. IEEE Transactions on Computer-Aided Design of Integrated Circuits and Systems, 28(8): 1251-1264. https://doi.org/10.1109/TCAD.2009.2021731
[8] Zou, W., Reddy, S.M., Pomeranz, I., Huang, Y. (2003). SOC test scheduling using simulated annealing. In Proceedings IEEE VLSI Test Symposium, 325-330. https://doi.org/10.1109/VTEST.2003.1197670
[9] Im, J.B., Chun, S., Kim, G., An, J.H., Kang, S. (2004). RAIN (Random INsertion) scheduling algorithm for SOC Test. IEEE Asian Test Symposium, 242-247. https://doi.org/10.1109/ATS.2004.71
[10] Chakrabarty, K., Iyengar, V., Krasniewski, M.D. (2005). Test planning for modular testing of hierarchical SOCs. IEEE Transactions on Computer-Aided Design of Integrated Circuits and Systems, 24(3): 435-448. https://doi.org/10.1109/TCAD.2004.842816
[11] Goel, S., Marinissen, E.J., Sehgal, A., Chakrabarty, K. (2008). Testing of SoCs with hierarchical cores: common fallacies, test access optimization, and test scheduling. IEEE Transactions on Computers, 58(3): 409-423. https://doi.org/10.1109/TC.2008.169
[12] Yang, Q., Chen, W.N., Yu, Z., Gu, T., Li, Y., Zhang, H., Zhang, J. (2016). Adaptive multimodal continuous ant colony optimization. IEEE Transactions on Evolutionary Computation, 21(2): 191-205. https://doi.org/10.1109/TEVC.2016.2591064
[13] Dorigo, M., Blum, C. (2005). Ant colony optimization theory: A survey. Theoretical Computer Science, 344(2-3): 243-278. https://doi.org/10.1016/j.tcs.2005.05.020
[14] Wang, Z.Y., Xing, H.L., Li, T.R., Yang, Y., Qu, R., Pan, Y. (2015). A modified ant colony optimization algorithm for network coding resource minimization. IEEE Transactions on Evolutionary Computation, 20(3): 325-342. https://doi.org/10.1109/TEVC.2015.2457437
[15] Liu, J.H., Yang, J.G., Liu, H.P., Tian, X.J., Gao, M. (2017). An improved ant colony algorithm for robot path planning. Soft Computing, 21(19): 5829-5839. https://doi.org/10.1007/s00500-016-2161-7
[16] Dorigo, M., Stützle, T. (2019). Ant colony optimization: overview and recent advances. In Handbook of Metaheuristics, Springer, Cham, 311-351. https://doi.org/10.1007/978-3-319-91086-4_10