Jamil Al Asfar* | Ahmad Atieh | Razan Al-Mbaideen
OPEN ACCESS
Microgrid is a practical way to integrate conventional and renewable energy sources in small premises. This paper mainly performs a techno-economic analysis of microgrid deployment in Jordan, and analyzes the performance and economic impact of hybrid renewable energy systems for a selected household within the University of Jordan region. Different scenarios were constructed based on the maximum, minimum and average of solar radiation and wind speed data in 2007~2016. In addition, three hybrid renewable energy systems were investigated for the microgrid to the household, namely, (1) photovoltaic generator, wind turbine, diesel generator and battery bank, (2) photovoltaic generator, wind turbine and battery bank, and (3) diesel generator. The comparison shows that the lowest net present cost (\$33,547) and lowest electricity cost (\$0.237/kWh) were observed in the first hybrid renewable energy system in the scenario of the maximum solar radiation and wind speed. Therefore, the optimal configuration of the hybrid renewable energy system for the microgrid includes: a 1.3kW photovoltaic generator, a 9kW wind turbine, a 1.6kW diesel generator, and a bank of 6 batteries.
hybrid renewable energy systems, Homer software, microgrid, optimization
Utilization of renewable energy resources is needed to meet the requirements of increasing demand on energy, reduction of fossil fuel resources, and increased environmental destruction happening in the world. In recent years, renewable energy sources have become viable alternative sources that meet environmental protection requirement and electricity demands. Renewable energy sources do not emit any additional carbon dioxide and do not introduce any risk such as nuclear waste.
The growing population in Jordan and the accompanying increase in the energy bill are causing a long-term challenge on the Jordanian economy due to scarcity of conventional energy resources in the country. Jordan depends on imports of oil and gas to satisfy its growing energy needs, thus the search for other energy sources such as renewable energy is essential. In addition, there is an urgent need to raise the amount of electricity production capacity in Jordan due to unpredictable increase in population. The huge increase in Jordan population causes frequent interruptions of electricity delivered to customers over the past few years. Electricity production in Jordan uses conventional petroleum products such as diesel oil or natural Gas in many stations deployed in the country. Using petroleum a product in electricity generation imposes a long term challenge and stress Jordan’s operational budget.
Microgrid is a practical way to enable integration between renewable energy sources and conventional source in small premises. Renewable energy sources play an important role in reducing CO2 emissions, and achieves higher reliability of electricity supply [1]. Several microgrid projects have been implemented around the world; those projects demonstrated high impact of social, economic, and environmental benefits to different countries.
Chmiel and Bhattacharyya [2] studied existing system in Scotland and suggested alternative configurations to improve electricity generation. They found that the existing overcapacity has been instrumental in ensuring a reliable supply but continued reliance on diesel generators adds to the cost. Rehman and Al-Hadhrami studied a solar PV-diesel-battery hybrid power system for a remotely located population in Saudi Arabia. They found out that microgrids consisting only of diesel generators were cost-competitive when fuel prices below \$0.60 /L, while renewables such as solar is more economical if fuel prices exceeded \$0.80 / L [3].
Díaz et al. performed comparative analysis between diesel, hydro-diesel, and photovoltaic-diesel technologies to analyze field performance of different off-grid generation technologies applied to the electrification of rural area based on data collected from systems installed in the rural area of the province of Jujuy, northwest of Argentina. They found that sensitivity of the supply reliability on the load demand is greater than grid connected networks, and the normalized fuel consumption (liter per kWh) of diesel generation strongly depends on the machine size [4].
Wu et al. studied the applications of microgrid and the major concerns for the development of microgrid in China. They also described some of pilot projects, like Tianjin University, Hefei University of Technology and Xi’an Jiaotong University. They found that foundation of Microgrid technology is weak in China and needs time to realize commercial operation, especially with the support of national policies [5].
The need for reliable electrification in remote sites in developing countries with lowest energy cost is the main reason to support microgrid projects [6]. From the customer point of view, microgrid provides electricity needs, enhance local reliability, and reduce emissions. From the grid’s point of view, microgrid may be regarded as a controlled entity within the power system that can be operated as a single aggregated load or generator [7].
In this work, the performance of different implementations of renewable energy sources was studied to find the characteristics of preferred and optimal HyRES that may be used for a selected household. The economic impact of deploying microgrid in Jordan was also investigated by performing a comparative study of possible usage of energy sources for a hybrid energy system. The energy sources considered were: diesel generator, photovoltaic, wind and lead-acid storage batteries. The main aim of using renewable sources is minimizing the lifecycle energy cost under Jordanian climatic conditions. The remainder of this paper is organized as follows: Section 2 presents solar and wind energy in Jordan, section 3 describes the governing equations used for mathematical modeling and simulation software, section 4 deals with cost analysis, section 5 talks about hybrid renewable energy system optimization, whereas section 6 presents the results of this work, and section 7 states the conclusions of this study.
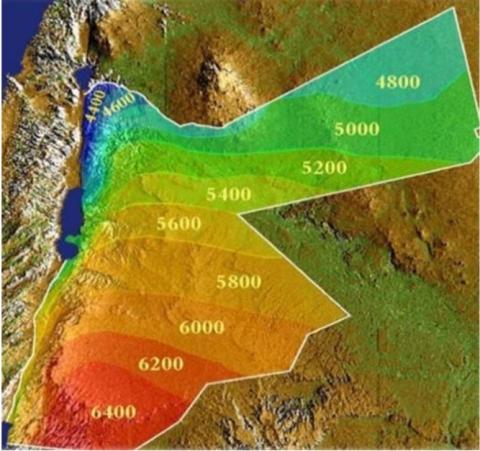
In Jordan, Solar radiation is relatively high, where the annual daily average of solar irradiation is 4-7 kWh/m2 when it is taken on average insulation intensity on a horizontal surface. In addition, the number of sunny days in Jordan are around 300 days per year [8]. Figure 1 shows the solar map of Jordan.
Figure 1. Solar map in Jordan [8]
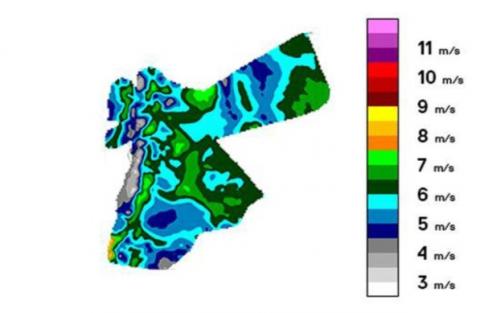
Figure 2. Wind speed map in Jordan [9]
On the other hand, the wind speeds in Jordan range from 5 to 6.5 m/s, and exceeds 7 m/s in some areas. Figure 2 represents the wind speed map in Jordan. Jordan can be classified into three wind regions according to prevailing wind speed: less than 4 m/s, 4- 6 m/s, and more than 6 m/s for low, medium and high regions, respectively. Most attractive sites are Hofa, in the northwestern corner, Fjeij near Showbak, and Wadi Araba in the southern part. Jordan’s first wind farm with a gross capacity of 320 kW consists of four 80 kW wind turbines in Ibrahimyya. Hofa wind farm station consists of five wind turbines each of 225 kW with a rated wind farm power of 1125 kW. The annual rate of power generation from the different wind-turbines used in Jordan is 2.9 GWh before adding Altafila's and other recent Wind Farms to the grid system. Altafila's farm has a total capacity of 117 MW generated by 38 wind turbines manufactured by Vestas with a capacity of 3.1 MW power by each turbine [9].
The hybrid microgrid system investigated in this work was modeled and simulated using Homer software. Homer (hybrid optimization modeling software for electric renewable) is a computer modeling software developed by the U.S National Renewable Energy Laboratory (NREL) to aid in the design and analysis of hybrid systems such as microgrid [10]. This software is also used to simulate and optimize hybrid power systems considering both technical and economic issues. HOMER models the power system physical behavior and its life-cycle cost of installing and operating over its lifetime. Three principal capabilities can be performed using homer software: simulation, optimization, and sensitivity analysis. The complicated part in HOMER’s simulation is how to include system components such as diesel generator and batteries. The main principle that HOMER follows when dispatching the system is to minimize the cost [11]. For the diesel generator, the fixed and marginal costs are defined as cost per hour of simply running the generator without producing any electricity, and additional cost per kWh of electricity produced from the generator [12]. The fixed cost for batteries is assumed zero since there is no cost related to operating the batteries, they just produce energy.
Dispatch strategy is considered as a side of microgrid operation. Based on Barley and Winn [13], two options of battery control strategies are provided by HOMER simulation including whether and how the generator should charge the batteries. These dispatch strategies are called load following (LF) and cycle charging (CC) [11]. In load following case, the generator produces just enough power to serve the load, and does not charge the batteries. Charging batteries is left to the renewable energy sources. While in cycle charging case, whenever the generator operates, it runs at its maximum rated capacity and charges the batteries with the excess produced power.
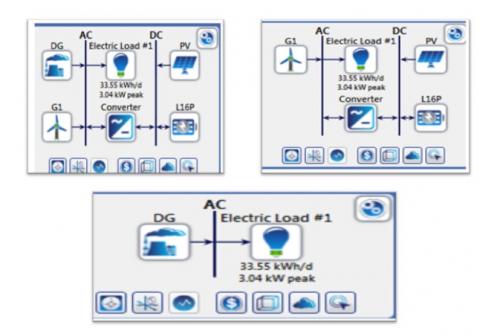
In this work, the cycle charging has been considered and the hybrid model was simulated and optimized. The microgrid hybrid system consists of a diesel generator, wind turbines, converter /inverter, solar panels (photovoltaic) and batteries. The inputs to the HOMER model were weather data, economic and technical data of the different components used for the generation and storage, limitations, and dispatch strategy. Then, the hybrid model is simulated for the operation of 8,760 hours in a year guaranteeing balanced energy supply [14]. After that, optimization of all feasible system configurations is obtained and ranked based on net present cost (NPC). Figurer 3 illustrates the system models that are used in the simulated and optimized system.
The governing equations used in the calculation of energy supplied by PV array; wind turbine; battery charge and discharge are described in the next section [15].
Figure 3. The proposed system models
The optimal system configuration based on cost minimization was determined in the simulation process. Two principal economic parameters: Net present cost (NPC), and the levelized cost of electricity (COE) characterizing the energy system generated are estimated. The levelized cost of electricity is the average cost per kilowatt-hour of useful electricity produced by the hybrid system. The net present cost represents the life cycle cost of the system, which contains cost of installation and operation over the project lifetime with future cash flows discounted to present time. The NPC includes the initial capital cost of the system components, the cost of any component replacements that occur over the project lifetime, the cost of maintenance and fuel cost [16]. The NPC is the main parameter used in the optimization process carried out by HOMER software, which ranks the feasible system configurations to their NPC and sorts the data output of the simulation and optimization. Based on the lowest value of NPC, the hybrid system with lowest NPC was selected as the most suitable configuration.
Capital recovery factor of the hybrid system can be obtained using the following formula [11]:
$C R F(i, N)=\frac{i(1+i)^{N}}{(1+i)^{N}-1}$ (1)
The COE can be calculated using the following equation:
$COE=\frac{Cann,tot}{Eserved}$ (2)
4.1 Hybrid model inputs
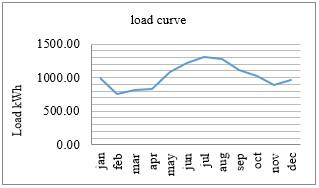
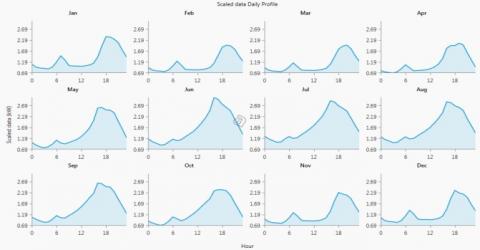
The input data to HOMER software include information about the control method, economic constraints, and resources. In this section, the load data, wind and solar resources, cost of the system components and type of dispatch strategy are presented. The main load is obtained from the electricity bill data of a selected household consumption. The monthly load curve obtained and analyzed is shown in Figure 4. HOMER requires the amount of primary load in kW for each hour of the year, so SAM (System Advisor Model) is used to estimate the synthetic hourly data from electricity bill. The data was then used to create different daily profiles for the different months. Figure 5 shows the daily load curves of electricity for the household. The annual demand of the house is 12,244.10 kWh. The average (kWh/day), average (kW), and peak (kW) were calculated as: 33.55 kWh, 1.4 kW, and 3.04 kW, respectively.
Figure 4. Monthly load curve for selected household
Figure 5. Daily estimated load curves
Finally, the hourly raw data of the global horizontal radiation (GHI) and wind speed [17, 18] for the University of Jordan region is used to find the monthly hourly maximum, average, and minimum curves of global radiation and wind speed for each month during the last 10 years (2007-2016). The wind speed is measured at 10 m above ground level. The methodology used in this study to calculate the required data used in the simulation is the following:
4.1.1 Minimum data curves
Minimum graphs show the monthly hourly minimum values of global horizontal radiation (GHI) and wind speed. Each data point represents the relevant data across one hour, which is calculated by finding the lowest value for every hour among all days for each month for 10 years. For example, the data at 11:00 represents the lowest value among all days in January at this time. Figures 6 and 7 show the hourly variations in GHI and wind speed over 24hrs period for the months of July, where the time period is represented on the horizontal x-axis of the graphs as hours, with a time of zero presenting 12:00 AM and a time of 1 presenting 01:00 AM, and so on. The GHI data is presented on the vertical y-axis, in Wh/m2.
Figure 6. Minimum hourly variations in GHI for 10 years over 24 hrs in July
4.1.2 Average data curves
The hourly averaged global horizontal radiation (GHI) and wind speed data for each month during 10 years are computed by finding the relevant data averages for each hour during a month and every year. The data across each hour are calculated by adding the data at 12:00 (for example) for every day in the month of January (for example) then divide the sum by 31 days. The global radiation and wind speed data are calculated over 10 years (2007-2016). Figures 8 and 9 show the calculated average data for January.
Figure 7. Minimum hourly variations in wind speed for 10 years over 24 hrs in July
Figure 8. Hourly average GHI radiation curves for January for 10 years
Figure 9. Hourly average wind speed for January for 10 years
4.1.3 Maximum data curves
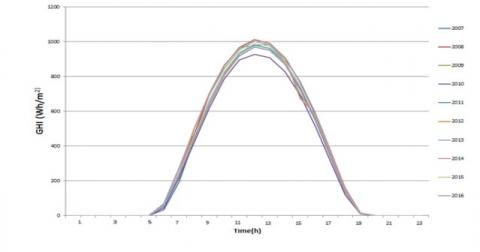
The maximum monthly hourly data curves of GHI and wind speed are calculated by finding the highest value of data for every hour among all days for each month for 10 years. The highest GHI and wind speed data at 08:00 AM "for example" among all days in January for 10 years is represented Figures 10 and 11, which show the maximum data curves for the month of January for 10 years.
Figure 10. Maximum hourly variations in GHI for 10 years over 24 hrs for January
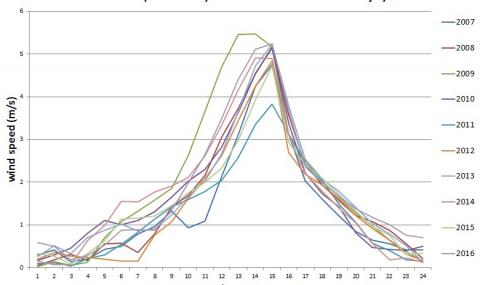
Figure 11. Maximum hourly variations in wind speed for 10 years over 24 hrs in January
4.1.4 Minimum, average, and maximum data curves
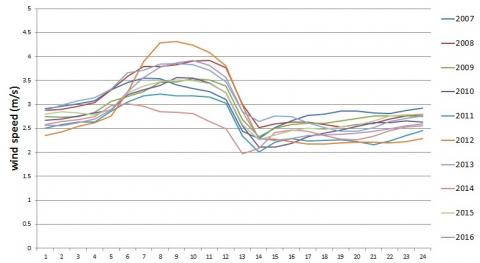
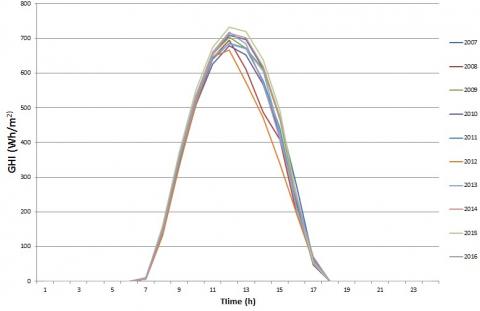
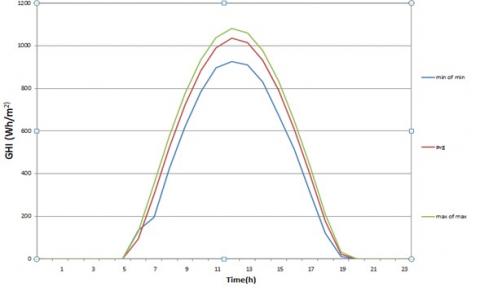
The monthly hourly minimum, average, and maximum data curves of GHI and wind speed during 10 years (2007-2016) are computed as follows: For minimum and maximum curves, the lowest and highest value for every hour among all days for each month among 10 years is found, respectively. As an example, the highest data at 08:00 AM among all days in January over 10 years is represented in the following graphs.
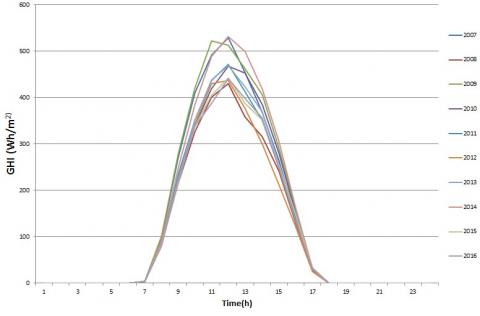
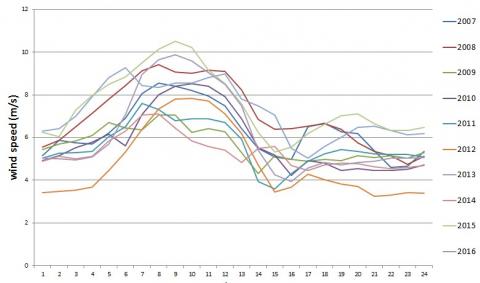
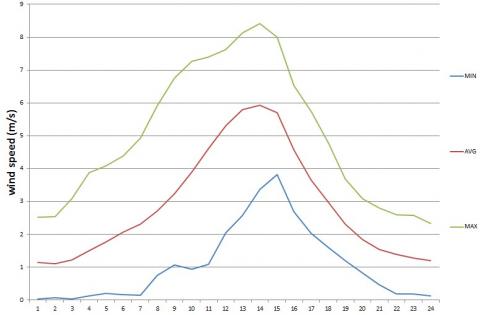
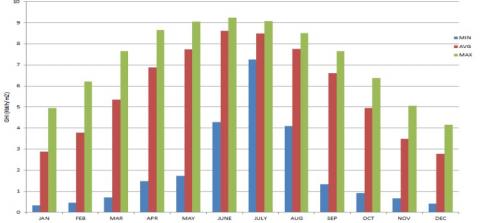
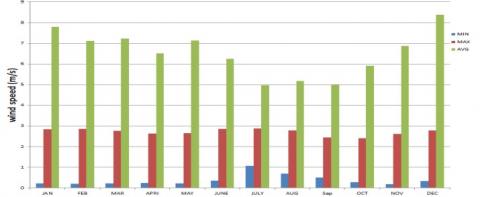
In addition, the average curves are calculated by finding the average for each hour during a month over10 years. The curves that represent the hourly GHI and wind speed data the month of July over 10 years are shown in Figures 12 and 13. A bar graph of the monthly minimum, average and maximum GHI and wind speed data over 10 years are shown in Figures 14 and 15.
Figure 12. Minimum, Average and Maximum hourly variations in GHI for 10 years / July
Figure 13. Minimum, average, maximum hourly variations in wind speed for 10 years / July
Figure 14. Minimum, Average, Maximum monthly variations in GHI radiations for 10 years
Figure 15. Min, average, max monthly variations in wind speed for 10 years
4.2 Photovoltaic Panels (PV) parameters
The peak capacity of solar panel is 300W. The prices for 1 kWp is \$1000 and the replacement cost is \$889, while the operating and maintenance cost is \$20 per year [10]. The lifetime is assumed 25 years with derating factor of 90 %. The derating factor is used to account for wiring losses, shading, snow coverage… etc.
4.3 Diesel generator parameters
The used diesel generator is a 5 kW rated power with minimum load ratio of 30% and 15,000 hours of operating time. The capital cost is \$3475 [19] and the cost of replacement is \$3275, while the operating and maintenance cost is \$0.02 per hour is assumed.
4.4 Battery parameters
Lead-acid batteries are used of l16p type, which is an LA battery type that is mostly used type for most applications due to relatively lower cost. The capital cost is \$300 [20], while the replacement cost is \$300. The minimum state of charge (SOC) parameter of the battery sets the limit for how low the batteries are allowed to be discharged. This setting is important since very low and frequent discharge will damage the batteries and reduce their lifetime. For lead acid batteries, a minimum SOC of 30 % is a common limit. The main characteristics of the batteries are:
Nominal capacity (kWh) 2.34
Minimum stat of charge (%) 30
The maximum charge current (A) 18
Round-trip efficiency (%) 85
4.5 Converter parameters
The converter was modeled as bidirectional i.e. it works as an inverter (converting PV DC power to AC) and a rectifier (to convert diesel generator and wind turbine AC power to DC to charge the batteries when necessary). The price for 1 Kw converter is \$300 [14] and the replacement cost is \$300. The characteristics of the generic converter are 90 % for inverter input efficiency, and 85 % for rectifier input efficiency.
4.6 Wind turbine parameters
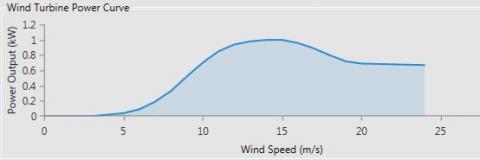
A generic wind turbine with a capacity of 1 kW has been considered with a hub height of 10 m. The capital cost is \$650/turbine [21] and the cost of replacement is \$650. The operating and maintenance cost are \$6.5 per year. Figure 16 shows the wind turbine output power at different wind speeds.
4.7 System constraints and economics
Cycle charging is the dispatch strategy considered in the model in this study with set point state of charge of 80 %, annual interest rate of 6 %, 20 years project lifetime and \$0.69/L fuel price [22].
Figure 16. Wind turbine power curve
There are different parameters that could be used to represent the economic performance of HyRES system such as annualized capital cost (ACC), annualized system cost (ASC), cost of energy (COE), total net present cost (NPC), etc. In this study, the system configuration with lowest net present cost is considered as the optimal choice.
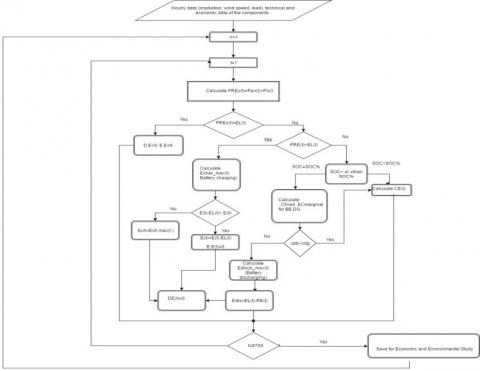
The operation of HyRES with a wide variety of configurations will be simulated using HOMER software. The flowchart of the proposed hybrid system (PV/diesel/wind/battery) is described in Figure 17.
There are few scenarios depending on the power REs and CE generated by wind, PV, diesel generator tin the system:
• The total energy generated by renewable resource (PREs) is greater than the load (El). In this case, the excess energy is stored in the Batteries (Echarge).
• The demand of the load (El) is greater than the total energy generated by renewable source (PREs). In this case, the load must be served by either the diesel generates or the batteries after calculation of maximum amount of energy discharged (Edischarge) from batteries.
• The total renewable energy produced equals to the load demand while the batteries capacity remains unchanged.
• The state of charge of batteries is less than the minimum SOS% and the load demand is greater than the produced energy of the renewable resource. In this case, the diesel generator must operate to cover the load and charge the batteries until batteries reach the set point state of charge.
Figure 17. Flowchart of Hybrid PV/Wind/ Diesel System [24]
Optimal design of the different configurations to supply power to a house in Jordan has been investigated. Each of these systems is analyzed for different scenarios of solar radiation and wind speed data profiles obtained over 10 years. The data was used to create different scenarios of solar radiation and wind speed profiles. The different scenarios include different combinations of minimum, maximum and average data of GHI and wind speeds. These combinations are investigated for different energy system options:
1. Renewable energy sources (solar, wind) + batteries bank+ diesel generator.
2. Renewable energy sources (solar, wind) + batteries bank.
3. Diesel generator only.
Based on the solar radiation and wind speed data analyzed, nine different data scenarios of solar radiation and wind speed profiles are applied for the first and second energy system implementation options. The results for each implementation option were obtained and the performances of all possible systems are presented in Table 1 below.
Table 1. Summary of optimal configuration for excess electricity without curtailment
|
Solar/Wind (GHI)/(m/s) |
PV power kWp |
Wind power kW |
DG rated capacity kW |
Number of batteries |
COE (\$/kWh) |
NPC (\$) |
PV kWh% |
DG kWh% |
Wind kWh% |
Renewable contribution % |
|
Avg / Max |
1.41 |
9 |
1.5 |
7 |
0.238 |
33709 |
12.11 |
37.39 |
50.5 |
46% |
|
Min / Max |
0.3 |
10 |
1.5 |
6 |
0.242 |
34438 |
1.01 |
41.28 |
57.7 |
42% |
|
Max / Avg |
3.54 |
1 |
1.85 |
5 |
0.266 |
37761 |
39.4 |
60.22 |
0.38 |
26% |
|
Min / Avg |
5.52 |
1 |
1.8 |
6 |
0.304 |
43174 |
23.93 |
75.64 |
0.43 |
18% |
|
Max / Min |
3.32 |
0 |
1.85 |
5 |
0.262 |
37182 |
37.73 |
62.27 |
0 |
25% |
|
Avg / Avg |
3.47 |
1 |
1.8 |
6 |
0.271 |
38428 |
36 |
63.61 |
0.39 |
24% |
|
Max / Max |
1.3 |
9 |
1.6 |
6 |
0.237 |
33547 |
12.27 |
37.58 |
50.15 |
46% |
|
Avg / Min |
3.46 |
0 |
1.8 |
6 |
0.267 |
37824 |
36.03 |
63.97 |
0 |
24% |
|
Min / Min |
5.6 |
0 |
1.8 |
6 |
0.287 |
45442 |
24.28 |
75.72 |
0 |
18% |
6.1 Performance of energy system scenarios
After conducting the simulation for three scenarios, it was found that the system consisting of renewable energy sources/ diesel generator/ batteries is the optimal economic choice for microgrid design for this study. The summaries of the results of optimal configuration for the three scenarios are shown in Tables 2 to 4.
Table 2. Optimal configuration for the three scenarios
|
Component |
First cenario |
Second scenario |
Third cenario |
|
Diesel generator, kW |
1.6 |
0 |
3.04 |
|
PV, kWp |
1.3 |
4.78 |
0 |
|
Wind Turbine, kW |
9 |
17 |
0 |
|
Number of Batteries |
6 |
33 |
0 |
|
Configuration |
Unmet load % |
Excess load % |
NPC (\$) |
COE (\$/kWh) |
|
Diesel generator only |
0 |
0 |
62775 |
0.397 |
|
PV/WT/ Batteries |
0 |
43 |
44660 |
0.315 |
|
PV/ WT/ DG/ Batteries |
0 |
26.9 |
33547 |
0.237 |
|
Energy Source |
Configuration / Production(kWh/yr) |
||
|
Diesel generator only |
PV / WT/ Batteries |
PV / WT/DG / Batteries |
|
|
Diesel generator (DG) |
12250 |
0 |
6661 |
|
Solar PV |
0 |
7990 |
2176 |
|
Wind turbine (WT) |
0 |
16793 |
8890 |
It can be seen from Table 3 that the Diesel only system gives total NPC of 62,775\$ and COE \$0.397, which are the highest cost among all three scenarios.
The NPC for the PV-wind-batteries system is \$44,660 (and COE of \$0.315), which is lower than the NPC for diesel generator only. In addition, the PV/WT/DG/BATTERIES system configuration has the lowest NPC as well as COE, which are 33,547\$ and \$0.237/kWh respectively. The present electricity tariff for residence in Jordan is about \$0.37, which is higher than the cost of optimal configuration obtained in this study.
Table 4 presents the comparisons of electrical production for three scenarios. It can be seen that the energy production from PV/WT/Batteries system is higher than others; since solar and wind are non–dispatchable and the system fully depends on these sources. In PV/WT/DG/Batteries, the electricity production is reduced compared to PV/WT/Batteries, since the presence of diesel generator reduces the dependence on renewable resources.
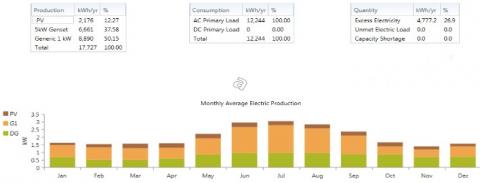
It was found that the lowest net resent cost (NPC) as well as COE for the first option can be achieved when the system is designed based on maximum global solar radiation and maximum wind speed as shown in row 7 of Table 1. This optimal system consists of 1.3 kW PV subsystem, 9 kW wind turbine subsystem, 1.6 kW rated capacity of diesel generator; and 6 batteries with zero capacity shortage, and 26 % excess electricity.
Figures 18 to 20 show the monthly electric production of the optimal system, with PV and Wind turbine outputs.
Figure 18. Monthly average electric production
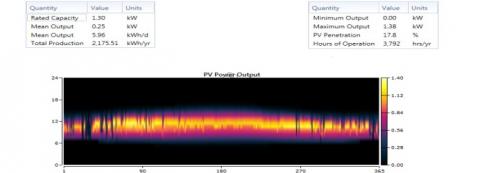
Figure 19. PV power output over a year
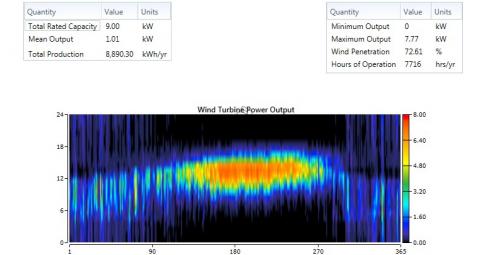
Figure 20. Wind turbines power output over a year
6.2 Validation of results
According to Royal Scientific Society of Jordan (RSS, 2017), the average monthly solar irradiation equals to 130 kWh/kWp.month, which is equal to 1560 kWh/kWp.year. In addition to that, the average optimal production per day is equal to 4.27 h/day. Therefore, each kWp PV will produce 4.27 kWh/day.
Based on simulation result of second scenario in this study, the optimal configuration consists of 10 kWp PV with mean output of 41.47 kWh/day.
$\frac{41.47 k W h / d a y}{10 k W p}=4.147 k W h / d a y$
Therefore, each kWp PV in proposed system of this work will produce 41.47 kWh/day, which is close to above published value, with a relative error of 2.9 % only.
It was found that a HyRES microgrid consisting of PV/WT/DG/batteries bank is a reasonable and proven solution that can be applied in Jordan under the current tariff of electricity \$0.37/kWh, which is significantly higher than the optimal configuration of this study, which is \$0.237/kWh.
The microgrid consisting of PV/WT/DG/batteries bank (first option) has the lowest net present cost as well as cost of electricity for all nine different scenarios of data of solar radiation (GHI) and wind speed with or without excess electricity.
|
$f_{p v}$ |
The PV derating factor |
|
$Y_{p v}$ |
Rated capacity of the PV array |
|
$I_{T}$ |
The solar radiation incident on the PV array in the current time step |
|
$I_{S}$ |
The incident radiation at standard test conditions |
|
$F_{0}$ |
Fuel curve intercept coefficient |
|
$F_{1}$ |
Fuel curve slope |
|
$Y_{g e n}$ |
Rated capacity of a diesel generator |
|
$P_{g e n}$ |
Electrical output of a diesel generator |
|
$C_{o m, g e n}$ |
Operating and maintenance cost of a diesel generator |
|
$C_{r e p, g e n}$ |
Replacement cost of a diesel generator |
|
$R_{g e n}$ |
Generator lifetime. |
|
$C_{fiel,eff}$ |
Effective price of fuel |
|
$R_{b a t t}$ |
Expected battery life |
|
$\mathcal{Q}_{\text {lifetime}}$ |
Lifetime throughput of single battery |
|
$\mathcal{Q}_{\text {thrpt}}$ |
Total energy that cycles through the battery bank in one year |
|
$R_{\text {batt,f}}$ |
Float life of the battery |
|
$C_{r e p, b a t t}$ |
Replacement cost of the battery |
|
$N_{b a t t}$ |
Number of batteries |
|
$Ƞ_{rt}$ |
Round-trip efficiency |
|
$C_{be,n}$ |
Storage energy cost in time step n |
|
$C_{c c, i}$ |
Cost of cycle charging the storage in time step i |
|
$E_{b c, i}$ |
Amount of energy that went into the storage bank in time step i |
|
$C_{a n n, t o t}$ |
Total annual cost |
|
$C_{R F}$ |
Function returning the capital recovery factor. |
|
i |
Interest rate |
|
$R_{p r o j}$ |
Project lifetime |
|
N |
Number of years |
|
$E_{\text {served}}$ |
Total electrical load served |
[1] Hafez, O. (2011). Some aspects of microgrid planning and optimal distribution operation in the presence of electric vehicles. Master Thesis, the University of Waterloo, Canada.
[2] Chmiel, Z., Bhattacharyya, S. (2015). Analysis of off-grid electricity system at isle of Eigg (Scotland): Lessons for developing countries. Renewable Energy, 81: 578-588. http://dx.doi.org/10.1016/j.renene.2015.03.061
[3] Rehman, S., Al-Hadhrami, L. (2010). Study of solar PV–diesel–battery hybrid power system for a remotely located population near Rafha, Saudi Arabia. Energy, 35(12): 4986-4995. https://doi.org/10.1016/j.energy.2010.08.025
[4] Díaz, P., Arias, C., and Sandoval, D. (2010). FAR from the grid: A rural electrification field study. Renewable Energy, 35(12): 2829-2834. http://dx.doi.org/10.1016/j.renene.2010.05.005
[5] Wu, X., Yin, X., Wei, Q., Jia, Y., Wang, J. (2013). Research on microgrid and its application in China. Energy and Power Engineering Magazine, 5(4): 171-176. http://dx.doi.org/10.4236/epe.2013.54B033
[6] http://www.microgridinstitute.org, accessed on Jul. 23, 2019.
[7] Liu, C., McArthur, S., Lee, S. (2016). Smart Grid Handbook (1st ed.). New Jersey, John Wily and Sons Inc.
[8] http://www.rss.jo, accessed on Nov. 20, 2018.
[9] WECSP, www.nerc.gov.jo/DetailsPage/NERCEN/ProjectsDetailsEn.aspx?ID=75, accessed on Jul. 23, 2017.
[10] https://www.nrel.gov/analysis/tech_lcoe_re_cost_est. html, accessed on Nov. 12, 2018.
[11] Farret, F., Simoes, M. (2006). Integration of Alternative Sources of Energy. New Jersy, John Wily and sons Inc.
[12] Kim, C. (2013). Lecture notes on design and simulation of micro-power systems of renewables. http://www.mwftr.com, accessed on Jul. 23, 2019.
[13] Barley, C., Winn, C. (1996). Optimal dispatch strategy in remote hybrid power systems. Elsevier Solar Energy, 58(4-6): 165-179. https://doi.org/10.1016/S0038-092X(96)00087-4
[14] http://www.homerenergy.com, accessed on Dec. 20, 2018.
[15] HOMER Help Manual. (2015).
[16] Herman, D. (2001). Investigation of the technical and economic feasibility of micro-grid- based power systems. http://assets.fiercemarkets.net, accessed on May. 2, 2019.
[17] http://www.soda-pro.comweb-servicesradiationcams-radiation-service, accessed on, 4, 2018.
[18] http://www.soda-pro.comweb-servicesmeteo-datamerra, accessed on Oct. 4, 2018.
[19] https://www.centralmainediesel.com/order/Slow-Turning-Kohler-5kW-Diesel-Generator.asp?page= yanmar_4kw, Nov. 13, 2018.
[20] https://www.ecodirect.com/Trojan-Battery, accessed on Nov. 13, 2018.
[21] https://www.alibaba.com/product-detail/China-Yaneng-cheap-price-high-cost_60036653447.html?spm= a2700.7724838.0.0.SoRdjR, accessed on Nov. 15, 2018.
[22] http://www.globalpetrolprices.com/diesel_prices/#hl127, accessed on May. 15, 2019.
[23] http://www.nepco.com.jo/electricity_tariff_ar.aspx, Jul. 16, 2019.
[24] Ahmed, S., Othman, H., Anis, S. (2010). Optimal sizing of a hybrid system of renewable energy for a reliable load supply without interruption. European Journal of Scientific Research, 45(4): 620-629.