Zhilin Sun | Gang Lv* | Zongyuan Luo | Chenyu Xie | Wei Wang
OPEN ACCESS
The single line-to-ground (SLtG) fault is difficult to locate or troubleshoot rapidly by traditional methods, posing a serious threat to the safety and stability of the power system. Since the transient negative sequence current (NSC) is immune to the arc-suppression coil of the grid, this paper sets up an automatic detection model for the SLtG fault in the grid. Firstly, the positive sequence fault current and negative sequence fault current were extracted from the transient process current of the grid, and combined into the transient NSC. After that, the characteristic region of the NSC was determined by the change of the transient NSC. To further define this region, the matrix algorithm was introduced to extract the exact feature points of the fault region. Taking the feature points as the input vectors, the neural network (NN) was adopted to identify the fault position. Simulation results show that our model achieved a 4 % lower false acceptance rate (FAR), a 10 % lower false rejection rate (FRR), and a much higher efficiency than the traditional detection model. The research findings lay the basis for fault data analysis and online fault diagnosis and improve the reliability of grid operations.
single line-to-ground (SLtG), transient negative sequence current (NSC), fault, detection
With the continuous development of industry and economy, the power and energy devices in China are increasingly complex, raising stricter requirements on grid reliability and safety. This kicks off the transform from traditional grid to smart grid. Being the terminal of the power system, the grid directly supplies electric power to users. The safe and stable operation of the grid are critical to the entire power system, and directly affects the quality of power supply.
Most grids in China are non-effectively grounded via neutral-to-earth connection. This distribution method does not generate much short-circuit current, and ensures the stability of the line voltage. However, more and more distribution lines have emerged in the recent boom of urban grids, which increases the risk of single line-to-ground (SLtG) fault and zero-sequence current. If left untreated, the fault will escalate into two- or multi-point grounding failure in the long run. The failure will damage power devices, posing a threat to the safe operation of the power system [1]. This calls for an automatic detection model for SLtG fault in the grid.
The supply lines form a complex network, in which each part involves numerous lines. For power safety, current transformers (CTs) are often the only devices installed on power transmission lines. Therefore, the region of ground fault current can only be located based on multiple current signals. Traditionally, the fault position is identified by comparing the amplitude or phase of the transient currents (fault signals) measured at different points, that is, contrasting the feature points of the fault. The transient current-based method poses strict requirements on the synchronization rate between fault samples of relevant electrical devices, and has a poor fault detection efficiency despite its complex operations.
To achieve reliable and efficient fault detection, this paper designs an automatic detection model for SLtG fault in the grid based on negative sequence current (NSC). The NSC consists of both positive and negative sequence components. Firstly, the positive sequence fault current and negative sequence fault current were extracted from the transient process current of the grid, and combined into the transient NSC. After that, the characteristic region of the NSC was determined by the change of the transient NSC. To further define this region, the matrix algorithm was introduced to extract the exact feature points of the fault region. The parameters of these feature points were treated as the input vectors of the neural network (NN). On this basis, the author constructed the automatic detection model for SLtG fault in the grid. Simulation results show that our model achieved a 4 % lower false acceptance rate (FAR), a 10 % lower false rejection rate (FRR), and a much higher efficiency than the traditional detection model [2].
The remainder of this paper is organized as follows: Section 2 constructs the NSC-based automatic detection model for SLtG fault in the grid; Section 3 compares our model with the traditional detection model through simulations; Section 4 puts forward the research conclusions.
This section sets up the automatic detection model for transient NSC fault. The model adds up the positive and negative sequence currents of the transient component in the fault region, and directly locates the fault region based on the effective value of the sum [3].
2.1 Division of the NSC
Considering the symmetry of current components, the fault components were obtained from the arc-suppression coil grounding system (the small current system) of the SLtG fault. The obtained results are presented in Figure 1, where Es is the single-phase supply for the entire grid; UA1, UA2 and UA3 are the positive sequence supply voltage, negative sequence supply voltage and zero-sequence voltage of the short dot A, respectively; X1 and X2 are the overall supply inductance and the line capacitance of the lines in the power system, respectively; Z1, Z2 and Z3 are the positive sequence impedance of the brand supply of the power transformer, the negative sequence impedance of the branch supply of the power transformer and the overall current of the arc-suppression coil, respectively.
Figure 1. The fault components
The data in Figure 1 show that the supply inductance of the arc-suppression coil only appears in the zero-sequence supply of the grid, and does not exist in the positive and negative sequence networks of the supply. Therefore, the positive and negative networks of each NSC fault component have the same structure, their currents share identical construction and transmission structures, and their performance is immune to the grounding current of arc-suppression coil [4]. The same scales and the same lines are adopted for the construction and transmission structures of currents in the positive and negative sequence networks of each fault component. As a result, the level and distribution of resistance impedance is consistent across the current network. In this paper, the positive sequence fault current and negative sequence fault current were extracted from the transient process current of the grid, and combined into the transient NSC:
$\mathbf{i}_{a s}=i_{a 1}+i_{a 2}$ (1)
where, ia1 and ia2 are positive sequence fault and negative sequence fault of the grid, respectively. It can be seen that the transient NSC is the sum of the positive and negative sequence transient currents from the power network [5]. However, the simple addition method may produce a huge error because the transient current easily attenuates in the grid and circulates at complex frequencies. To eliminate the error, the negative sequence current was computed by subtracting the zero-sequence current from the fault current. Then, the calculation method for the transient NSC can be revised as:
$\mathrm{i}_{a s}=i_{a}+i_{a 0}$ (2)
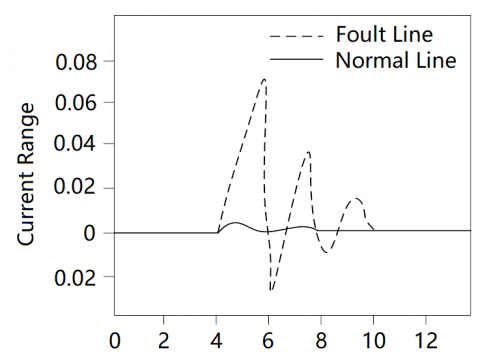
where, ia is the current fault component; ia0 is the zero-sequence fault component. In theory, the SLtG fault component follows the same distribution law as zero-sequence current. In the single-phase system of the grid, however, the NSC extracted from the SLtG fault line is obviously different from the non-fault current. This feature can be adopted to determine whether a current belongs to the SLtG fault. As shown in Figure 2, the transient process of the NSC has a unique feature: the transient NSC on the fault line is obviously higher than that on the non-fault line, and can be used to diagnose the fault line [5]. In addition, the equivalent fluctuation region of the NSC in the fault region of the grid is significantly higher than that of the normal NSC. Therefore, the feature points of the fault region can be directly observed by extracting the transient NSC.
Figure 2. Comparison between NSCs on fault and normal lines
2.2 Extraction of feature points based on matrix algorithm
The preceding subsection determines the characteristic region of the NSC by the change of the transient NSC. To further define this region, the matrix algorithm was adopted to extract the features points from the region. The extracted feature points help to shorten the time to identify the fault and cut off the fault line. In this way, the power supply to non-fault regions will be protected, reducing the loss of the SLtG fault. In this paper, the matrix algorithm-based method mainly extracts the feature points in two steps: setting up a fault information matrix based on the fault feature vectors of the NSC, and computing the structure of the grid [6].
Firstly, the entire grid was formulated into a digital model, in which the bus and end load has a unique number. Suppose there are N digital nodes in the grid. In the light of the network structure, the connections between network nodes can be planned as an N-th order matrix of effective data. Then, the matrix D can be expressed as:
$D=\left[d_{i j}\right]_{N \times N}$ (3)
where, dijis the isotropic nominal element of the i-th row and j-th column in matrix D. The range of this element can be defined as:
$d_{i j}=\left\{\begin{array}{l}{1, i \neq j} \\ {1, i \leq j} \\ {0, i \geq j}\end{array}\right\}$ (4)
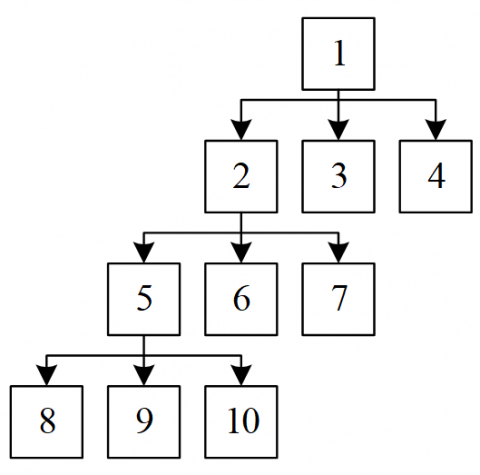
According to the above formula, the grid can be converted into a tree network (Figure 3).
Figure 3. Tree network
In Figure 3, each node is a bus or an end load. The connections between the nodes were numbered. The network matrix of each connection can be directly obtained based on the number and Figure 3. Once the power system fails, the network of supply lines will output a set of special signal vectors, i.e. the effective range of the NSC. This vector set should be uploaded to the central network system of the control center. Then, the computer system can identify a 1D fault data matrix by the characteristic semaphores. To set up this matrix, the characteristic semaphores must be divided into a set of evaluation indices. If these indices are equivalent to one, the node element in the tree network corresponding to the line segment (connection) must be one, and the other elements, zeros [7].
Using the evaluation indices, the effective matrix can be effectively converted into an evaluation matrix. The conversion can be implemented in two steps: computing the two types of elements adjacent in the same region in the effective matrix; modifying the elements in the effective matrix with the equivalent value of one according to the computed results. On this basis, the computer system of the central control station can identify the fault. The NSC circuit diagram is shown in Figure 4, where the SLtG fault line starts from a bus node and ends at an end load node. As shown in Figure 4, the feature points of the SLtG fault include nodes 1~4 [8].
Figure 4. The NSC circuit diagram
2.3 Automatic detection of the SLtG fault under the NN
The automatic detection of the SLtG was realized with an NN in the light of the feature points. The NN is a three-layer backpropagation NN (BPNN). The set of feature points [x1, x2, x3, …, xn] was taken as the input vector of the NN. Let w and v be the initial connection weights of the NN. To improve the total amount of SLtG fault information, the weight element x and the connection weight vector w were directly added to the first layer of the NN. Then, the matching degree between x and w can be computed as:
$d_{i}=\left(x_{i}-w_{i}\right)^{2}$ (5)
Taking dias the input vector of the second layer and the output of the second layer as the input vector of the third layer, the output Y of the entire NN can be expressed as:
$y=\sum_{i=1}^{N} v_{i} f\left(d_{i}\right)$ (6)
where, f(di) is the node function of the second layer. The functional structure can be described by the following radial basis function (RBF):
$f(x, \sigma)=\exp \left(-\frac{x^{2}}{2 \sigma^{2}}\right)$ (7)
where, σ is the network operating rate. The value of σ is negatively correlated with the slope of the function image. Then, the grid threshold λ was introduced to judge if the NN structure is compatible with the other grid data. The data compatibility between y and λ was compared to obtain the matching error vector. For all input vectors of the NN, if the matching errors are all greater than zero, then the NN cannot match the grid data of other grid spaces [9, 10].
In actual detection, the NN structure mainly includes two parts: sample collection and detection. Firstly, the NN collects the feature signals across the fault region of the grid, and acquires the SLtG feature vectors. These vectors are taken as the input vectors of the NN. Then, the measurement error E of the supply line network s reduced by the BPNN [11, 12]. In addition, the grid threshold λ is generally a boundary description parameter (0.1). Through the above process, the SLtG fault samples can be collected from normal grids, and the grid space can be fully covered by the accumulating samples. In actual detection [13], the NN can detect the SLtG fault in real time based on the collected samples. If the error is below zero, the detection model is activated and ready for fault detection [14, 15].
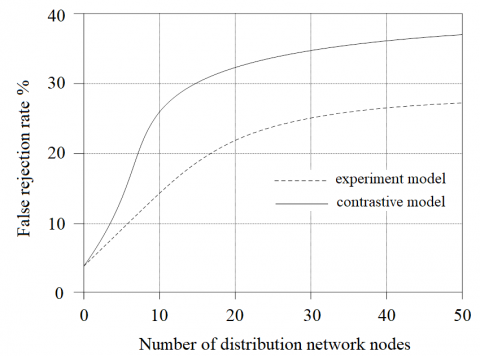
The verify its effectiveness, the proposed model was applied to detect the SLtG fault in an actual grid, and the detected fault was compared with the actual fault. The traditional SLtG fault detection method was also employed for the fault detection. The simulation data on the NSC and the arc-suppression coil are shown in Tables 1 and 2, respectively. To facilitate the comparison, the FRR and FAR of the two models are compared in Figures 5 and 6, respectively.
As shown in Figure 5, our model differed greatly from the contrastive model in the FRR. The contrastive model had an FRR up to 38 %, while our model achieved a less than 30 % FRR, nearly 10 % lower than that of the contrastive model. As shown in Figure 6, it is obvious that our model output a 4% FAR than the contrastive model, indicating the excellent detection efficiency of our model.
Table 1. The simulation data on the NSC
|
Position |
The simulation data on the NSC |
Route selection |
Location |
||||||
|
M1 |
M2 |
M3 |
M4 |
M5 |
M6 |
M7 |
|||
|
1 |
5.987 |
4.879 |
5.965 |
4.268 |
5.692 |
5.682 |
5.123 |
L1 |
1 |
|
2 |
4.665 |
5.264 |
3.696 |
4.186 |
3.174 |
4.369 |
4.686 |
L1 |
2 |
|
3 |
0.257 |
0.187 |
1.128 |
0.258 |
1.268 |
0.158 |
1.269 |
L1 |
3 |
|
4 |
4.158 |
5.698 |
4.268 |
4.141 |
4.571 |
3.257 |
4.293 |
L1 |
4 |
|
Position |
The simulation data on the arc-suppression coil |
Route selection |
Location |
||||||
|
M1 |
M2 |
M3 |
M4 |
M5 |
M6 |
M7 |
|||
|
1 |
5.987 |
4.879 |
5.965 |
4.268 |
5.692 |
5.682 |
5.123 |
L1 |
1 |
|
2 |
4.665 |
5.264 |
3.696 |
4.186 |
3.174 |
4.369 |
4.686 |
L1 |
2 |
|
3 |
0.257 |
0.187 |
1.128 |
0.258 |
1.268 |
0.158 |
1.269 |
L1 |
3 |
|
4 |
4.158 |
5.698 |
4.268 |
4.141 |
4.571 |
3.257 |
4.293 |
L1 |
4 |
Figure 5. Comparison of the FRR
Figure 6. Comparison of the FAR
This paper designs an automatic detection model for SLtG fault in the grid. Firstly, the NSC of the grid was extracted based on the positive and negative fault components of the current. Next, the feature points of grid fault were determined by the matrix algorithm, in the light of the transient NSC. Taking the feature points as the inputs, the NN was adopted to construct the automatic detection model for SLtG fault. The simulation results show that our model greatly outperformed the traditional detection model in the FRR, FAR and efficiency.
This work is supported by the scientific project of Guiyang Bureau of UHV Transmission Company, China Southern Power Grid Co., Ltd.
[1] Yang, F., Guan, H.X. (2017). Design automation of distribution system of single-phase earth fault detection model. Science Technology and Engineering, 17(4): 218-222.
[2] He, Z., Wang, R.F., Hao, X. (2016). Research on single phase to ground fault location for electric power distribution systems with distributed generation. Journal of Zhengzhou University (Natural Science Edition), 48(1): 85-90.
[3] Zong, W.L., Xu, W.Q., Yuan, Y.L., Dai, J.W., Pi, J., Song, T.B. (2016). A new type of single-phase grounding fault line selection and location method for mine distribution network. Industry and Mine Automation, 42(11): 45-50.
[4] Sun, Q.D., Zhang, K.R., Liu, J., Yi, L.F., Song, X.M., Li, Y.Y. (2016). Research on single-phase fault earth fault line selection method for the distribution network based on fifth harmonics and wavelet reconstruction. Electrical Measurement & Instrumentation, 53(16): 1-4.
[5] Zhang, J., He, L.S., Chen, R., Zeng, X.J. (2017). Active arc suppression method for single-phase grounding fault of power distribution network based on self-optimized control. Guangdong Electric Power, 30(2): 129-136.
[6] Liu, J., Zhang, X.Q., Li, P.D., Zhang, Z.H., Quan, L. (2016). A novel approach treating single-phase ground fault in distribution system. Power System Technology, 40(11): 3586-3590. http://dx.chinadoi.cn/10.13335/j.1000-3673.pst.2016.11.045
[7] Sun, Y.C., Tai, N.L., Zheng, X.D. (2016). Research on single-phase grounding fault location of distribution network with DG. Journal of Electric Power Science and Technology, 31(3): 73-80.
[8] Jia, Q.Q., Zheng, X.R., Liu, C., Wang, N., Jiao, J., Sun, L. (2017). A method of fault section location in distribution networks based on fault direction measures. Proceedings of the CSEE, 37(20): 5933-5941. http://dx.doi.org/10.13334/j.0258-8013.pcsee.161489
[9] Zhang, G.J., Du, Y., Bai, Y.H. (2017). Fault line detection simulation single-phase to ground fault in distribution network. Computer Simulation, 34(2): 175-179.
[10] Hong, Y., Tan, Y.H., Yi, H.L., Wen, Q., Jiang, S.Y. (2017). New method of single phase-to-ground fault location based on traveling wave in distribution networks. Proceedings of the CSU-EPSA, 29(2): 14-20.
[11] Yang, L.Y., Shu, Q. (2016). A new multiterminal detecting location method of single-phase grounding to the overhead-line for distribution network based on travelling-wave mutation of line-mode. Power System Protection and Control, 44(9): 22-28.
[12] Wei, G., Chen, H.W., Wang, Y., Zhou, J.M., Fang, T., Huang, Y.H., Chen, S.J. (2017). A protection scheme of single-phase earth fault for distribution network with distributed generators. Journal of Electric Power Science and Technology, (4): 79-83.
[13] Hu, W., Li, Y., Cao, Y.J., Zhang, Z.P., Zhao, Q.Z., Duan, Y.L. (2016). Fault identification based on LOF and SVM for smart distribution network. Electric Power Automation Equipment, 36(6): 7-12.
[14] Huang, M.Y., Sun, G.Q., Wei, Z.N., Zang, H.X., Chen, T., Chen, S. (2016). Three-phase state estimation in distribution systems based on pseudo measurement modeling using spiking neural network. Automation of Electric Power Systems, 40(16): 38-43.
[15] Shang, H.T, Wu, L., Zhao, Y., Lu, J.J. (2017). Reliability evaluation model of distribution network incorporating centralized feeder automation. Electric Power Automation Equipment, 37(5): 129-135. http://dx.chinadoi.cn/10.16081/j.issn.1006-6047.2017.05.020