Suneetha Bulla* | Chirra Venkata Rami Reddy | Panguluri Padmavathi | Turaka Padmasri
© 2020 IIETA. This article is published by IIETA and is licensed under the CC BY 4.0 license (http://creativecommons.org/licenses/by/4.0/).
OPEN ACCESS
Cloud computing for web application is ubiquitous in the global market and represents a generic pattern because rapid elasticity and infrastructure scaling naturally lends itself to the needs of a virtual data center. Server requirement analysis depending on the workload play a very important role in web app development and it leads to availability of service to customer at any cost and cost analysis to the application provider. To achieve proper infrastructure scaling the minimal number of servers are have to satisfy and determine SLO. Thus this paper evaluates an analytical model to formulate prediction or estimation of required servers has to satisfy the QoS performance metrics such as throughput, utilization of cloud datacenter, request loss and required number of servers. The experimental model is used to validate correctness of the analytical model that was hosted on AWS cloud platform. Finally results have presented and conclusions are drawn.
cloud computing, web application, queuing model, AWS
Cloud computing is the emerging technology for offering infrastructure and applications as SaaS on on-demand and also it is base technology of different fields like artificial intelligence, IoT, Machine Learning etc. [1]. Rapid elasticity is one of the important characteristics of CC, it provides right amount of computing resources among pool of resources according to web application needs. It provision and de-provision the resources depends on the incoming traffic without human intervention. The real time cloud providers like Amazon, Google and IBM are also offering this elasticity service using different names like auto scaling, scalability etc... This property is attracting global market for web customers to move their services into clouds [2]. In terms of cloud computing services the elasticity facing two challenges over-provisioning and under-provisioning, then the over-provisioning leads to excess computing cost for infrastructure wastage, while under-provisioning leads unavailability of resources.
Herbst et al. [3] and Aljahdali et al. [4] have suggested scalability, elasticity, and efficiency are used to calculate performance of web based applications. In this situation dynamic scaling shows solution of elastic cloud computing. It has ability to scale up and scale down the resources when the sudden workload at runtime. Most of the cloud providers are offering SaaS applications due to the e-commerce of global market and the use of multi-tenancy. As per the publications scalability are utility perspective [5-7]. There is necessity to understand the effected system components to understand the scalability nature of the data center. Lorido-Botran et al. [8] have conducted survey on scalability of infrastructure and resource estimation challenges. Estimating computing infrastructure and implementing an efficient auto-scaler for web services are challenging tasks due to various factors. These factors are dynamic workload, infrastructure requirement, and cost estimation.
This will be beneficial for the organization, those who are client of cloud applications. CSP is expected to have advanced scalar measures. However, putting scalar measures onto its edge, which is, its customers' networks will estimate the cost of the web application. Threshold is one of the ideas to measure customer usage on cloud and it ensures that customer bill. These services can be considering cloud computing characteristics. There is a necessity to research to fulfill these gaps.
The objective of this paper is two-fold, one is evaluated the analytical model to predict or estimate the required number of servers for web application depending on the workload, at the same time second one is to validate this analytical model with experimental model. The specific objective is to analyze the challenges in the implementation of an auto-scaler in clouds.
The rest of this paper is structured as following; literature of various works related to this paper have discussed in Section 2. Section 3 depicts analytical evaluation process of cloud datacenter architecture. The validated experimental modeled is presented in Section 4. Section 5 discussed about results of analytical and experimental model and finally section 6 drawn about the conclusions.
Several authors contributed their works on CC architecture models as well as resource prediction on web services. The literature mainly focused analytical evaluation work on CC using queuing models and experimental and simulation studies using various cloud providers and tools. This section discussed these two sections briefly.
Scalability is an attractive factor in the cloud. It is represented by the ability to boost or reduce the required resources according to the real needs of the organization. It is achieved by relying on characteristic of server virtualization and it pays attention to one of the most important advantages of adopting the cloud which is flexibility. In this regard, users can add access points according to their needs. Furthermore, enterprise's employees can move freely from the main location of the company. They can work from their homes, or even from another city or country, if they have machines connected to the Internet through a web browser. They can easily access the cloud and use its services wherever and whenever they want to do so. Therefore, they can process their data regardless of their geographical position. This advantage will serve the employee as well as the organization [8-10]. The numerous benefits of the elasticity in the cloud cost efficiency, continuous availability of the service, recovery, scalability.
In the cloud computing technology, resources and services can be provided instantaneously as soon as the user requests them, and these services can be released directly when no longer needed. Moreover, the user will pay only for the used services and resources. The authors define the elasticity as "the degree to which a system is able to adapt to workload changes by provisioning and de-provisioning resources in an autonomic manner, such that at each point in time the available resources match the current demand as closely as possible". However, there are some factors that play an important role in achieving the highest grade of elasticity, such as the workload from the customer's requests, response time of the cloud servers, the resources capability of scaling up or down, and the type of cloud platform. The cloud is not completely elastic, but it is the best technology in this regard compared with any traditional computing system. Moreover, developers are working to improve this feature to further enhance cloud [3, 11, 12].
The most important benefit for enterprises, especially small and mid-sized scale enterprises, which adopt the cloud is the observable decrease in the infrastructure and operational costs related to IT hardware and software. These costs include buying servers and other hardware pieces, the annual payment for buying and updating software licenses, paying salaries to a large number of employees in the IT department who are required to manage the processes, and the large amount of money which should be spent for regular maintenance purposes. In this technology, customers will obtain their IT needs from the provider with cost-effective solutions as they will pay less for purchasing hardware equipment and software applications and licenses, compared with the amount that they would pay if they did not adopt the cloud. Most of the literatures focused on predict the scalability of cloud services from an experimental point of view [13-20]. We note that many comparative studies [21, 22] are conducted a comparative study to analyze the performance of scalable cloud with two applications, three public clouds and three private clouds that have been built using the three mainstream hypervisors. Gao et al. and Vasar et al. [10, 15, 23] have conducted experiments different clouds using different frameworks.
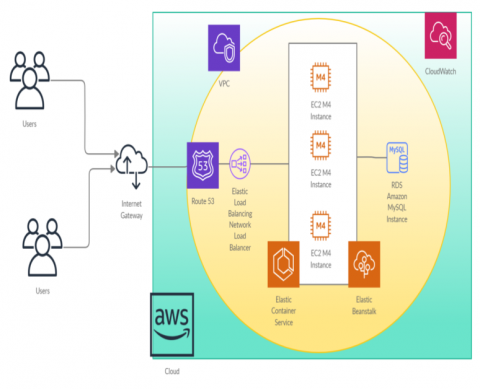
This paper adopted real time cloud provider architecture like Amazon Web application hosting architecture to analyze the elasticity of the web application resource consumption and presented in Figure 1. This architecture contains DNS Resolution, Content Delivery Network, Resources and Static Content, Web Servers, Application Servers, Database Servers. The web application receives load from DNS resolution through load balancer. It distributes incoming load to a midst of resources. The application servers are configured with scaling to which user’s associate triggers. These triggers will give notification to load balancer to scale application server based on server threshold value by a monitoring system. The LB ensures an even distribution of the incoming load among all running VM instances in a group [23, 24].
Figure 1. Web application hosting architecture of Amazon Web Services
The web server’s runs simultaneously depending on the incoming traffic, each server have a buffer to execute workload. The scale up and scale down can be varying automatically based on the QoS parameters such as utilization of computing infrastructure among all running instances [25]. When the average utilization of all running instances exceeds an upper threshold, then a trigger will fire to launch a new server that will be added to the pool of resources and configured at the load balancer. Similarly scale down also. The workload can be distributed midst of available application servers. Like most above architecture, a datacenter has a database server to be used for storing configuration information and incoming workload.
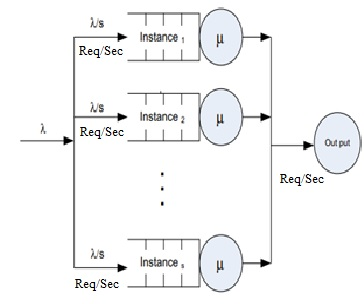
Figure 2 depicts queuing model of Figure 1 web application architecture. In this queuing model arrivals are aggregated before entering the datacenter. The architecture can be divided into 3 parts load balancer, computing tire, storage tire. This paper mainly focuses on computing tire. So, the elastic computing tire modeled as parallel queuing models each server follows as M/M/1. In practical scenario each server has a buffer queue that was indicated as M/M/1/k but this paper assumed it as M/M/1 model for our convenience. This approximation is highly reliable to the real-time environment with large finite buffers, such as datacenter, where the buffer loss probability is negligible [26, 27]. The cloud architecture follows each system as open queue M/M/1 model.
Figure 2. Queuing model of web application hosting architecture
It considers that the request arrival rate and service rate follow a Poisson distribution with where λ arrival rate and µ service time. Where S is represents as total number of running servers and we assumed the queuing-based loss probability is zero. The effective arrival rate ƛ is equals the arrival rate λ/S. The computing tire presented in Figure 2. The load balancer distributes the arrivals midst of available servers. The transition probability will be equal to 1/S for each server. If where All servers have the same computing capacity, μi=μ, and the arrival rate of each instance is λi = λ/S,
Then the mean utilization of resource U is calculated as follows in Eq. (1):
$\mathrm{U}=\frac{\lambda}{\mathrm{S} \mu}$ (1)
where,
U is the utilization,
λ arrival rate,
S total number of servers,
μ service rate.
The utilization of the resources depends on the arrival rate and services rate followed by number of servers.
The little’s formula is used to calculate throughput of datacenter. Based on the Figure 3 when the arrival rate λ will be distributed among S instances, then each server throughput is λ/S. The total number of required servers can be calculated by using utilization, when upper threshold utilization is 100% then the formula is:
$S=\frac{\lambda}{\mu}+1$ (2)
In Eq. (2) the required number of servers is impacted based on arrival rate and server power capacity. The scalability allows servers to be scale up or down based on the QoS metrics. Here the threshold value plays important role to generate trigger when utilization of the datacenter exceeds or decreased. When the server threshold exceeds pre-defined value for example 80% then it generates trigger to scale up resource similarly the server threshold below pre-defined value for example 30% then it generates trigger to scale down resources. Finally, the total required number of servers calculated using this procedure depending on the workload.
Figure 3. Elastic computing of application servers
The scalability depending on the CPU utilization, it can measure using upper and lower threshold, the upper threshold exceeds servers should be scale up depending on network in. Similarly, when it is in lower threshold, the instances should be decreased. The threshold value is depending on the time of request throughput. For example, when we consider adding or removing instances by 10% of the running instances at the time of the threshold triggering, the provisioning can be expressed as follows:
When
U > U_T, Sreq = [S +| 0.1 × S|]
U < L_T, Sreq = [S − | 0.1 × S |]
The required number of servers calculates process depending on the $\lambda$ and utilization of the datacenter. These are the rules to scale and descale virtual servers.
$\frac{\lambda}{\mathrm{S\mu}} \leq \mathrm{U}_{-} \mathrm{T}$ (3)
Thus,
S = U_T −1 × λ/μ + 1 (4)
where, U_T indicates upper threshold, if we assume 80%, then the required servers calculated as follows:
S = 1.25 × λ/μ + 1 (5)
Similarly, lower threshold also calculated as follows above procedure. Thus, number of servers required to be added to depending on the workload of λ is:
S_res = 1.25 × λ/μ + 1 − Srun_res (6)
where, 1.25 indicates the 80% threshold value followed by total datacenter utilization and Srun_res is running instances, these are committed with load balancer.
We have conducted an experiment to analyze the required number of servers for web application depending on the time and workload. The performance metrics are throughput and utilization and number of running servers. This experiment validates our analytical model. Figure 4 illustrates design process of the experimental setup in AWS. This paper was adopted Amazon AWS to conduct experiment on US West Origin region. Different services are used to establish data center on VPC and host web application, those are VPC, EC2 Instances, Elastic Container Service, Elastic Beanstalk, Elastic Load Balancer, RDS server, Route53 and CloudWatch. We used another two EC2 instances to generate the incoming load to web application.
The experiment used different sizes of instances that are optimized for our processing and network connectivity needs. The elastic beanstalk is used to host web application on scalable instances. The AWS allows us to configure scale up and scale down threshold value. In this experiment we were configured scale up resources when the resource utilization exceeds 80% and scale down when the resource utilization below 30%. These instances are scaled up when the utilization of the computing resources exceeds more the 80% and similarly it scales down the resources when the utilization below 30%. Many authors have conducted experiments using these configuration values [28-31]. Web server ran Ubuntu Linux as the underlying operating system for all our instances. The load balanced attached with elastic beanstalk to distribute incoming traffic among available servers and it takes responsibility to scale up and scale down resources based on the trigger. Finally cloud datacenter adopts DNS from Route53, thus it provides availability of the web application to the customers.
The main goal of this experiment is to estimate number of computing resources required for time based on the incoming traffic. for that we used popular Apache JMeter to generate synthetic HTTP traffic which was first directed to a load balancer that was readily available at the AWS. This load balancer distributed load available among available pool of resources evenly in a round robin fashion. All the experiment resources were hosted within the same AWS VPC (Virtual Private Cloud). The virtual machines on the VPC are logically isolated. Siege was configured for windows system and JMeter was configured for Linux System to generate workload simultaneously. The metrics were taken every 15 minutes. In this experiment we considered throughput, network in, network out, CPU utilization, request loss and total number of running instances. The CPU utilization measures were taken in the continuous stable time from 5 to 10 minutes.
Figure 4. Experimental test bed for web service hosting
This paper considers analytical model and experimental model to estimate the computing resources on web application datacenter. Based on the present cloud environment, the analytical model assumed no loss probability of the traffic due to the elasticity property, thus it can handle enough resources when the high traffic occurs. Finally results of the experimental model have been validated to the analytical model. The experimental test bed was hosted on Amazon AWS and it was same structure of the analytical queuing model presented in Figure 1. The network in and out has been taken from two different sources. The input http traffic flow has been following the Poisson distribution. The incoming traffic or arrival rate fixed 400 requests per second and varied up to 20000 requests per second.
The experiment initially started with 5 running instances. Each instance was configured as a web server, and hosted the web application on it, web page size was adjusted to achieve 100% CPU utilization where the 100 requests per second for each instance, which is the target capacity of instance. Initially the experiment will handle 500 requests per second, and it will close to 100% average CPU utilization of auto scaling group. Based on average resource CPU utilization add more instances when high load spike occurs. This experiment used 80% average CPU utilization to add instances and the scaling size to be 2 instances in the default period of auto scaling in Amazon. The incoming traffic varied from 400 to 20000 requests per second.
Figure 5 depicts throughput of cloud datacenter. X-axis indicates different traffic rates. There is significant difference between analytical and experimental model. In the analytical evaluation assumes there is no loss probability of the incoming traffic but in the real time scenario based on the bandwidth or network there may be loss probability occur. For example, from Table 1 when 16500 packets entered in the network based on the bandwidth this experiment allows 15205 requests only.
Figure 5. In relation between incoming traffic and throughput
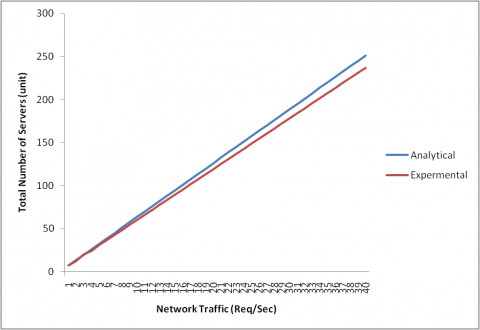
Figure 6 shows that required number of instances allocated during the experimental testbed run and analytical model. When load of 4000 Req/sec entered in the data center, results show that 51 instances is the minimum number of instances required to ensure that the average utilization is below 80%. According to the number of required instances can be calculated analytically as: S = 1.25 × 4000/100 + 1 = 51, which comes in line with the experimental results. In the experimental results there is no significant difference due to the elasticity and throughput of the datacenter. When the incoming traffic increases required servers also increased.
From the Figure 7 results the CPU utilization significantly impacted when the high load spike occurs, such that the workload increases the corresponding utilization also increases. As per our assumptions the results show that the average utilization does not exceed the upper threshold in both analytical and experimental models. In the experimental model throughput significantly varies when compare to the analytical, but utilization do not have significant difference.
Figure 6. In relation between incoming traffic and number of required servers
Figure 7. In relation between incoming traffic and CPU utilization
Table 1 shows that comparison between analytical and experimental results performance metrics. These are throughput, required number of servers and utilization of the computing resources. When the incoming traffic increases required number of servers also increases. Based on this sever optimization the cloud customer will gain knowledge on required number of the servers to maintain datacenter.
Table 1. Comparison of analytical results and experimental results
|
Comparison of experimental results to analysis |
||||||
|
Incoming Traffic |
Servers |
CPU Utilization |
AVG Throughput |
|||
|
Analytical |
Experimental |
Analytical |
Experimental |
Analytical |
Experimental |
|
|
500 |
7.25 |
7 |
68.96551724 |
70 |
500 |
467 |
|
1000 |
13.5 |
12 |
74.07407407 |
72 |
1000 |
840 |
|
1500 |
19.75 |
20 |
75.94936709 |
78 |
1500 |
1424 |
|
2000 |
26 |
24 |
76.92307692 |
73 |
2000 |
1810 |
|
2500 |
32.25 |
30.5 |
77.51937984 |
78 |
2500 |
2289 |
|
3000 |
38.5 |
36.4 |
77.92207792 |
73 |
3000 |
2750 |
|
3500 |
44.75 |
42.3 |
78.2122905 |
77 |
3500 |
3211 |
|
4000 |
51 |
48.2 |
78.43137255 |
79 |
4000 |
3672 |
|
4500 |
57.25 |
54.1 |
78.60262009 |
79 |
4500 |
4134 |
|
5000 |
63.5 |
60 |
78.74015748 |
80 |
5000 |
4595 |
|
5500 |
69.75 |
65.9 |
78.85304659 |
80 |
5500 |
5056 |
|
6000 |
76 |
71.8 |
78.94736842 |
80 |
6000 |
5518 |
|
6500 |
82.25 |
77.7 |
79.02735562 |
79 |
6500 |
5979 |
|
7000 |
88.5 |
83.6 |
79.0960452 |
81 |
7000 |
6440 |
|
7500 |
94.75 |
89.5 |
79.15567282 |
80 |
7500 |
6902 |
|
8000 |
101 |
95.4 |
79.20792079 |
80 |
8000 |
7363 |
|
8500 |
107.25 |
101.3 |
79.25407925 |
80 |
8500 |
7824 |
|
9000 |
113.5 |
107.2 |
79.29515419 |
80 |
9000 |
8285 |
|
9500 |
119.75 |
113.1 |
79.33194154 |
81 |
9500 |
8747 |
|
10000 |
126 |
119 |
79.36507937 |
79 |
10000 |
9208 |
|
10500 |
132.25 |
124.9 |
79.39508507 |
81 |
10500 |
9669 |
|
11000 |
138.5 |
130.8 |
79.42238267 |
78 |
11000 |
10131 |
|
11500 |
144.75 |
136.7 |
79.44732297 |
82 |
11500 |
10592 |
|
12000 |
151 |
142.6 |
79.47019868 |
78 |
12000 |
11053 |
|
12500 |
157.25 |
148.5 |
79.49125596 |
81 |
12500 |
11515 |
|
13000 |
163.5 |
154.4 |
79.51070336 |
79 |
13000 |
11976 |
|
13500 |
169.75 |
160.3 |
79.5287187 |
79 |
13500 |
12437 |
|
14000 |
176 |
166.2 |
79.54545455 |
80 |
14000 |
12898 |
|
14500 |
182.25 |
172.1 |
79.56104252 |
81 |
14500 |
13360 |
|
15000 |
188.5 |
178 |
79.57559682 |
81 |
15000 |
13821 |
|
15500 |
194.75 |
183.9 |
79.58921694 |
79 |
15500 |
14282 |
|
16000 |
201 |
189.8 |
79.60199005 |
80 |
16000 |
14744 |
|
16500 |
207.25 |
195.7 |
79.61399276 |
80 |
16500 |
15205 |
|
17000 |
213.5 |
201.6 |
79.62529274 |
80 |
17000 |
15666 |
|
17500 |
219.75 |
207.5 |
79.63594994 |
81 |
17500 |
16128 |
|
18000 |
226 |
213.4 |
79.6460177 |
80 |
18000 |
16589 |
|
18500 |
232.25 |
219.3 |
79.6555436 |
79 |
18500 |
17050 |
|
19000 |
238.5 |
225.2 |
79.66457023 |
80 |
19000 |
17511 |
|
19500 |
244.75 |
231.1 |
79.67313585 |
79 |
19500 |
17973 |
|
20000 |
251 |
237 |
79.6812749 |
80 |
20000 |
18434 |
This paper evaluates an analytical model to estimate the required number of servers to achieve proper elasticity for web applications. This estimation is depending on the incoming workload in particular time and service rate of server. This prediction analysis must satisfy the QoS metrics such as throughput, computing resources utilization and required number of servers.
The proposed analytical model validated with experimental model that was hosted. Noticeable fluctuation and variability were identified in the real time measurements, but the overall mean performance metrics are agreed with analytical results. When the throughput increases the corresponding utilization increases; thus, it leads to consumption of more resources.
Moreover, we plan to propose different types of novel methods to estimate the number of servers and cost estimations for web applications as feature research directions.
[1] Qu, C.H., Calheiros, R.N., Buyya, R. (2018). Auto-scaling web applications in clouds: A taxonomy and survey. ACM Computing Surveys, 51(4): 73. https://doi.org/10.1145/3148149
[2] Becker, M., Lehrig, S., Becker, S. (2015). Systematically deriving quality metrics for cloud computing systems. In: Proceedings of the 6th ACM/SPEC International Conference on Performance Engineering - ICPE 15. ACM, New York, pp. 169-174. https://doi.org/10.1145/2668930.2688043
[3] Herbst, N.R., Kounev, S., Reussner, R. (2013). Elasticity in cloud computing: what it is, and what it is not. In: Presented as Part of the 10th International Conference on Autonomic Computing, USENIX, San Jose, pp. 23-27.
[4] Aljahdali, H., Albatli, A., Garraghan, P., Townend, P., Lau, L., Xu, J. (2014). Multi-tenancy in cloud computing. 2014 IEEE 8th International Symposium on Service Oriented System Engineering, Oxford, UK, pp. 344-351. https://doi.org/10.1109/SOSE.2014.50
[5] Lehrig, S., Eikerling, H., Becker, S. (2015). Scalability, elasticity, and efficiency in cloud computing: A systematic literature review of definitions and metrics. In: Proceedings of the 11th International ACM SIGSOFT Conference on Quality of Software Architectures - QoSA 15, pp. 83-92. https://doi.org/10.1145/2737182.2737185
[6] Hwang, K., Bai, X., Shi, Y., Li, M.Y., Chen, W.G., Wu, Y.W. (2016). Cloud performance modeling with benchmark evaluation of elastic scaling strategies. IEEE Transactions on Parallel Distributed Systems, 27(1): 130-143. https://doi.org/10.1109/TPDS.2015.2398438
[7] Lorido-Botran, T., Miguel-Alonso, J., Lozano, J.A. (2014). A review of auto-scaling techniques for elastic applications in cloud environments. Journal of Grid Computing, 12: 559-592. https://doi.org/10.1007/s10723-014-9314-7
[8] Jennings, B, Stadler, R. (2015). Resource management in Clouds: Survey and research challenges. Journal of Network and Systems Management, 23: 567-619. https://doi.org/10.1007/s10922-014-9307-7
[9] Gao, J., Bai, X., Tsai, W.T., Uehara, T. (2013). SaaS testing on clouds - issues, challenges, and needs. In: Proceedings - 2013 IEEE 7th International Symposium on Service-Oriented System Engineering, Redwood City, USA, pp. 409-415. https://doi.org/10.1109/SOSE.2013.98
[10] Al-Said Ahmad, A., Brereton, P., Andras, P. (2017). A systematic mapping study of empirical studies on software cloud testing methods. In: Proceedings 2017 IEEE International Conference on Software Quality, Reliability and Security Companion, Prague, Czech Republic, pp. 555-562. https://doi.org/10.1109/QRS-C.2017.94
[11] Geetha, N., Anbarasi, M.S. (2015). Ontology in cloud computing: A survey. International Journal of Applied Engineering Research, 10(23): 43373-43377.
[12] Hu, Y., Deng, B., Peng, F.Y., Hong, B., Zhang, Y.C., Wang, D.X. (2016). A survey on evaluating elasticity of cloud computing platform. In: World Automation Congress Proceedings, pp. 1-4. https://doi.org/10.1109/WAC.2016.7583052
[13] Islam, S., Lee, K., Fekete, A., Liu, A. (2012). How a consumer can measure elasticity for cloud platforms. In: Proceedings of the Third Joint WOSP/SIPEW International Conference on Performance Engineering - ICPE 12. ACM, New York, pp. 85-96. https://doi.org/10.1145/2188286.2188301
[14] Gao, J., Pattabhiraman, P., Bai, X., Tsai, W.T. (2011). SaaS performance and scalability evaluation in clouds. In: Proceedings - 6th IEEE International Symposium on Service-Oriented System Engineering, SOSE 2011. IEEE, Irvine, pp. 61-71. https://doi.org/10.1109/CloudCom.2012.6427555
[15] Herbst, N.R., Kounev, S., Weber, A., Groenda, H. (2015). BUNGEE: An elasticity benchmark for self-adaptive IaaS cloud environments. In: Proceedings - 10th International Symposium on Software Engineering for Adaptive and Self-Managing Systems, SEAMS 2015, pp. 46-56. https://doi.org/10.1109/SEAMS.2015.23
[16] Bauer, A., Herbst, N., Kounev, S. (2017). Design and evaluation of a proactive, application-aware auto-scaler. In: Proceedings of the 8th ACM/SPEC on International Conference on Performance Engineering - ICPE 17. ACM, New York, pp. 425-428. https://doi.org/10.1145/3030207.3053678
[17] Beltran, M. (2016). Defining an elasticity metric for cloud computing environments. In: Proceedings of the 9th EAI International Conference on Performance Evaluation Methodologies and Tools. ICST (Institute for Computer Sciences, Social-Informatics and Telecommunications Engineering), ICST, Brussels, pp. 172-179. https://doi.org/10.4108/eai.14-12-2015.2262685
[18] Kuhlenkamp, J., Klems, M., Röss, O. (2014). Benchmarking scalability and elasticity of distributed database systems. Proc VLDB Endow, 7(12): 1219-1230. https://doi.org/10.14778/2732977.2732995
[19] Ilyushkin, A., Ali-Eldin, A., Herbst, N., Papadopoulos, A.V., Ghit, B., Epema, D., Iosup, A. (2017). An experimental performance evaluation of autoscaling policies for complex workflows. In: Proceedings of the 8th ACM/SPEC on International Conference on Performance Engineering - ICPE 17. ACM, New York, pp. 75-86. https://doi.org/10.1145/3030207.3030214
[20] Jayasinghe, D., Malkowski, S., Wang, Q.Y., Li, J., Xiong, P.C., Pu, C. (2011). Variations in performance and scalability when migrating n-tier applications to different clouds. In: Proceedings - 2011 IEEE 4th International Conference on CLOUD Computing, CLOUD 2011, pp. 73-80. https://doi.org/10.1109/CLOUD.2011.43
[21] Jayasinghe, D., Malkowski, S., Li, J., Wang, Q.Y., Wang, Z.K., Pu, C. (2014). Variations in performance and scalability: an experimental study in IaaS clouds using multi-tier workloads. IEEE Transactions on Services Computing, 7(2): 293-306. https://doi.org/10.1109/TSC.2013.46
[22] Vasar, M., Srirama, S.N., Dumas, M. (2012). Framework for monitoring and testing web application scalability on the cloud. In: Proceedings of the WICSA/ECSA 2012 Companion Volume on - WICSA/ECSA ‘12, pp. 53-60. https://doi.org/10.1145/2361999.2362008
[23] Bellenger, D., Bertram, J., Budina, A., Koschel, A., Pfänder, B., Serowy, C., Astrova, I., Grivas, S.G., Schaaf, M. (2011). Scaling in cloud environments. In: Proceedings of the 15th WSEAS International Conference on Computers, Wisconsin, pp. 145-150.
[24] Idziorek, J. (2010). Discrete event simulation model for analysis of horizontal scaling in the cloud computing model. In: Proceedings of the 2010 Winter Simulation Conference, Baltimore, MD, USA. https://doi.org/10.1109/WSC.2010.5678994
[25] Scheinhardt, W. (1998). Markov-modulated and feedback fluid queues. Ph.D. Thesis, University of Twente, the Netherlands.
[26] Shen, X., Chen, H., Dai, J., Dai, W. (2002). The finite element method for computing the stationary distribution of an SRBM in a hypercube with applications to finite buffer queueing networks. Queueing Systems, 42(1): 33-62. https://doi.org/10.1023/A:1019942711261
[27] Thuraisingham, B. (2020). Cyber security and artificial intelligence for cloud-based internet of transportation systems. 2020 7th IEEE International Conference on Cyber Security and Cloud Computing (CSCloud)/2020 6th IEEE International Conference on Edge Computing and Scalable Cloud (EdgeCom), New York, NY, USA. https://doi.org/10.1109/CSCloud-EdgeCom49738.2020.00011
[28] Al-Haidari, F., Sqalli, M., Salah, K. (2015). Evaluation of the impact of EDoS attacks against cloud computing services. Arabian Journal for Science and Engineering, 40: 773-785. https://doi.org/10.1007/s13369-014-1548-y
[29] Dei Rossi, G.L., Iacono, M., Marin, A. (2015). Evaluating the impact of eDoS attacks to cloud facilities. VALUETOOLS 2015, Berlin, Germany, pp. 188-195. https://doi.org/10.4108/eai.14-12-2015.2262650
[30] Salah, K., Elbadawi, K., Boutaba, R. (2015). An analytical model for estimating cloud resources of elastic services. Journal of Network and Systems Management, 24: 285-308. https://doi.org/10.1007/s10922-015-9352-x
[31] Amazon Web Services, Auto Scaling. http://aws.amazon.com/autoscaling/.