Tingting Shi
OPEN ACCESS
The user behavior and preference can be recognized by analyzing the spatial, temporal and semantic attributes of geographic data, making it possible to reconstruct the real-world travel trajectories of users. This paper collects and preprocesses the Weibo check-in data at A-level scenic spots in two Chinese provinces, namely, Jiangsu and Zhejiang, and analyzed the tourists’ travel behavior from the perspectives of time and space. From the angle of time, the author examined the interannual variations of the check-in data from 2016 to 2018, and explored how the data changed on holidays, weekends and workdays. From the angle of space, the kernel density analysis was performed on the collected data, and the hot spots were determined. Finally, the spatial and location flows and flow directions of holiday travels were investigated, and the travel mode and features on holidays were obtained. The research findings lay the basis for the development of wisdom tourism.
big data analysis, spatial data mining, travel behavior, kernel density analysis
In recent years, mobile positioning devices and location services have become increasingly popular, thanks to the technical development in geographic information system (GIS), global positioning system (GPS) and map visualization. These devices and services have integrated with the traditional social networks into a brand-new social network, namely, the location-based social network (LBSN) [1].
The LBSN combines positioning with social interaction [2], enabling users to record and share their location information anytime and anywhere. The basic units of the LBSN are user and position. Together, the two kinds of units form the social media geographic (SMG) data. Each SMG data describes the historical trajectory of an individual, and the SMG data of multiple users display the travel mode and living pattern of a group of people. Compared with the traditional social networks, the LBSN has added a spatial dimension, allowing users to share their position information. In this way, the social networks in the virtual world become increasingly realistic.
The rapid expansion of the LBSN is greatly promoted by social media apps like Twitter and Weibo. Such apps kick off the era of consumer-generated media (CGM). Everyone is enabled to express opinions and feelings anytime and anywhere. In fact, social media users can be viewed as sensors distributed across the world, which collect and publish the latest news in the real world. The development of social media geography has deepened the integration between social media apps and location services, creating a huge amount of SMG data.
Through the analysis on SMG data, it is possible to disclose the interaction among time, space and attribute(s), and determine the state and variation of geographic elements [3]. Moreover, the SMG data analysis can also reveal the spatiotemporal relationship of human behavior, identify the spatial distribution of people at different time points, and display the spatiotemporal features of the daily activities of a specific group of people. Some scholars have extracted accurate SMG data from the social media, and used these data to predict the position of media or users, whose positions are unknown.
In light of the above, this paper collects and preprocesses the Weibo check-in data at A-level scenic spots in two Chinese provinces, namely, Jiangsu and Zhejiang, and analyzed the tourists’ travel behavior from the perspectives of time and space. From the angle of time, the author examined the interannual variations of the check-in data from 2016 to 2018, and explored how the data changed on holidays, weekends and workdays. From the angle of space, the kernel density analysis was performed on the collected data, and the hot spots were determined.
2.1 Geographical information services
The early geographical information apps were mainly oriented at industrial needs and targeted at user groups with distinct features. By these services, the user demand was obtained through one-on-one interviews. With the proliferation of location services and growth in user scale, it is virtually impossible to determine the need of each user solely by expert interviews. To solve the problem, the network technology has been introduced to design efficient methods like network observation [4] and network investigation [5]. Below is a summary of the latest approaches that extract geographical information of multiple users.
Harrower et al. [6] tested 16 geographers and non-professional users by the traditional testing method. Huang et al. [7] collected 385 valid questionnaires through an online survey and evaluated the usability of GIS apps based on the answers. Gareth et al. [8] estimated the orientations of photos with GPS positions, using satellite maps and street scenes. Taking edge information as visual features of photos, Cao et al. [9] extracted edge information from GPS-tagged photos in photo-sharing sites, and predicted land use through supervised learning. Zheng et al. [10] extracted residence points of users from GPS trajectories, obtained the graph structure through hierarchical clustering of these points, and determined the interests points and hot scenic spots by Hyperlink-Induced Topic Search (HITS) algorithm. Zhang et al. [11] mined interest points from GPS trajectories to determine their correlation with activities. Firstly, the activity-activity association was measured based on the data from external webpages to overcome the sparsity of location-activity labels. Then, the cooperative matrix decomposition was implemented to reconstruct the original matrix from low-dimensional features. Okazaki et al. [12] conducted a questionnaire survey on user satisfaction and preference of the mainstream network map, and then improved the network map based on the survey results. Xiao et al. [13] examined the influencing factors of mobile electronic map, and designed fuzzy comprehensive evaluation model for this type of map.
2.2 Social apps
With the aid of thematic models, Gerber et al. [14] predicted crimes in Chicago through tweet analysis, revealing that the crimes can be predicted more accurately based on tweet content. Sun et al. [15] determined the correlation between the frequency of influenza-related keywords on Weibo and the official data on the disease released by Chinese Center for Disease Control and Prevention (CDC), and tried to forecast influenza occurrence based on this correlation.
2.3 Location prediction
Cheng et al. [16] inferred the position information of Weibo posts after analyzing the vocabularies associated with location in the posts. Trinh et al. [17] categorized locations into catering, shopping, etc. in light of location data, and computed the correlation between locations by user data on historical check-ins.
2.4 Travel behavior analysis
The rise of time geography and GIS technology has turned travel behavior into a research hotspot. Instead of relying on the travel log, Menghini et al. [18] studied the travel behavior of residents using a GPS data recorder. Han et al. [19] analyzed the trajectory data collected from volunteers by spatiotemporal data mining, and successfully acquired spatiotemporal features of travel behavior. Zhou et al. [20] obtained data from geographic information systems for transportation (GIS-T) and travel log, explored the spatiotemporal features of residents’ daily activities, and differentiated between different classes in terms of daily activities. Shen et al. [21] conducted a GPS survey on the daily activities of suburban residents, and probed into the spatiotemporal features of their daily activities.
Check-in, as an important function in location services, offers a chance to sort out information by location. The users of location services record their locations in each check-in, or share their location information by logging with their social media accounts. Thus, the check-in function is the largest generator of the SMG data.
3.1 Data acquisition
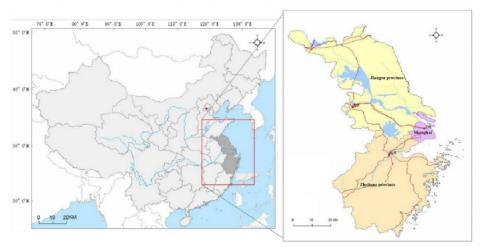
This paper relies on Weibo, a leading social network app in China, to acquire the SMG data from Shanghai, Jiangsu and Zhejiang. The three places were selected in view of their highly active social networks and location services, which must have produced rich SMG data. The check-in data of Shanghai tourists in all A-level scenic spots of Jiangsu and Zhejiang provinces were collected through the application programming interface (API) of Weibo.
The basic geographical information of the three places are presented in Figure 1 below.
Figure 1. The basic geographical information of the study area
Table 1. POI information fields
|
Field |
Description |
|
poi_id |
POI ID |
|
poi_name |
POI name |
|
address |
Address of scenic spot |
|
category |
Attribute ID |
|
latitude |
Latitude of scenic spot |
|
longitude |
Longitude of scenic spot |
Table 2. Check-in data information fields
|
Field |
Explanations |
|
status_id |
Status ID |
|
create_time |
Time of Weibo post |
|
text |
Weibo content |
|
user_id |
User ID |
|
user_name |
User name |
|
city |
City ID |
|
gender |
User gender |
|
latitude |
Latitude of Weibo post |
|
longitude |
Longitude of Weibo post |
The information about the A-level scenic spots in Jiangsu and Zhejiang was downloaded from the official websites of the departments of culture and tourism in the two provinces. The downloaded data specify the location, local city, name and other attributes of the scenic spots. In total, the author obtained 489 A-level scenic spots in Jiangsu and 337 in Zhejiang. The obtained information was used to acquire the spatial location of the scenic spots. To access the check-in data, the point-of-interest (POI) ID must match that in the database of Weibo Open Platform. The information fields of the POIs and check-in data are listed in Tables 1 and 2, respectively.
Here, the interceptor of Baidu Map API is employed to acquire the spatial information of scenic spots. Then, the POIID of the scenic spots was used as the query string to look for the check-in data. The query string is the value returned during the acquisition of the POIID, which contains the POI ID, POI name, as well as the name, address, category, latitude and longitude of scenic spot. In this way, the author obtained 1,360,087 records in Jiangsu and 527,791 records in Zhejiang, all of which were generated between 2016 and 2018.
3.2 Data preprocessing
Weibo is a free and open platform. The users are allowed to have multiple accounts, as well as deleting and revoking their posts. Hence, the SMG data generated in Weibo may be duplicated, erroneous or empty. To ensure the quality of data mining, the acquired data must be preprocessed to eliminate duplicates, errors and empty records.
In this paper, the preprocessing is carried out in two steps. Firstly, the data extracted from the POIID information fields were treated to remove the duplicate and wrong POIID information records. Secondly, the POI categories (e.g. hospital and residential area) unrelated to tourist activities were deleted, leaving only those (i.e. food, lodging, transport, travel, shopping and entertainment) related to our research objective. Through data preprocessing, the author finally obtained 1,360,087 records in Jiangsu and 527,791 records in Zhejiang, all of which were generated between 2016 and 2018.
After preprocessing, statistical comparison was performed to verify the data quality. According to the check-in data collected from Weibo, the top ten provincial administrative regions (hereinafter referred to as provinces) in terms of check-in frequency are determined. The results are plotted as Figure 2 below.
Figure 2. Top-10 provinces in check-in frequency
The results in Figure 2 agree well with the situation on the tourism market in the Yearbook of China Tourism Statistics, which mentions that Jiangsu is the largest tourist destination in China, followed by Shanghai, Beijing, Zhejiang, Anhui, Guangdong, Shandong, Henan and Hubei. Hence, the quality of the acquired data meets the requirements for the analysis of tourist travel behavior.
Before the analysis on tourist travel behavior, the spatial big data (SBD) of the spatial dataset was defined as SBD={O,T,P}, where O={o1, o2, …} is the set of moving objects in the datasets (|O| is the number of moving objects that generate location information), T is the time spent to observe the dataset, and the absolute value of P is the number of position records obtained in |T| time. Each position record p generally consists of moving object o, coordinates (x, y) and recording time t. If the user is active in sharing his/her location data on social media, the record may also include the location-related media information I. Hence, a position record can be expressed as a quintuple p=(o, x, y, t, I).
Considering the big data analysis as a classification problem, the Bayesian network (BN) was introduced to process the collected check-in data. The BN is a probabilistic graphical model that characterizes the dependencies between variables using a directed acyclic graph. The network represents the joint probability distribution of numerous variables in the network. For a BN graph, the set of random variables is denoted as {X1, X2, …, Xn}, with Xi being the node in the graph. Let Pa(Xi) be the parent nodes of node Xi. Then, the joint probability distribution can be expressed as:
$P=({{X}_{1}},{{X}_{2}},...,{{X}_{n}})=\prod\limits_{i=1}^{n}{P({{X}_{i}}|Pa({{X}_{i}}))}$
Each state of the joint probability space can be deemed as a product of the conditional probability, making it possible to compute the probability of each state of each variable can be calculated.
If the BN is applied to a classification problem, the sample category and feature space are often set to C={c1, c2, …, cl} and X={X1, X2, …, Xn}, respectively. For each sample x={x1, x2, …, xn}, the objective of the classification is to determine the category c of the sample through training the sample set D. The category can be determined based on the maximum a posteriori probability $\max _{i=1, \ldots, l}\left\{p\left|\left(c_{i} | x\right)\right\}\right.$, where:
$p({{c}_{i}}|x)=\frac{p({{c}_{i}})\times \prod\limits_{j=1}^{n}{p({{x}_{j}}|{{c}_{i}};\pi ({{x}_{j}}))}}{p(x)}$
where π(xj) is the parent nodes of node xj except node set C. Thus, the learning of the BN is to derive the probability distribution function from training sample D:p(ci)p(xj|ci; π(xj)).
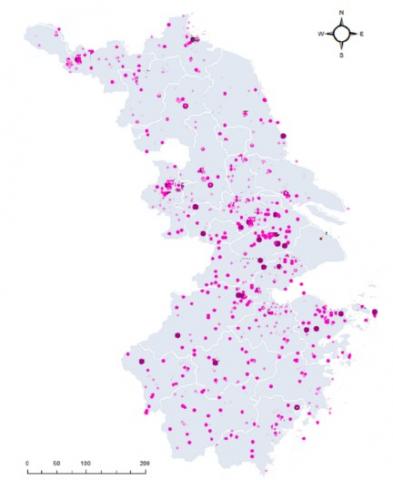
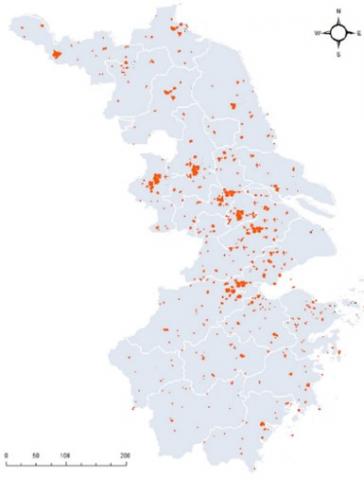
Figure 3. The spatial distribution of A-level scenic spots in Jiangsu and Zhejiang
Figure 4. The spatial distribution of check-in data in Jiangsu and Zhejiang
Based on the above analysis, the interannual variations of check-in data in Jiangsu and Zhejiang were summarized, and the trends of check-in data on festivals and holidays were also obtained. In addition, the trends on different festivals and holidays, weekends and workdays were compared in details.
Figures 3 and 4 respectively show the spatial distributions of A-level scenic spots and check-in data in Jiangsu and Zhejiang.
The check-in data in 2016~2018 were classified by year and level of scenic spots. The results show that 25,317 tourists checked in A-level scenic spots in Jiangsu and Zhejiang. The number changed to 24,178 in 2017 and 43,295 in 2018. The yearly statistics are contrasted in Figure 5 below.
Figure 5. The annual number of check-ins in A-level scenic spots
As shown in Figure 5, the number of check-ins in A-level scenic spots soared in 2018 from the levels in 2016 and 2017, and 4A scenic spots were more popular than their counterparts on other levels. This is mainly attributable to the growing popularity of Weibo in recent years. More and more tourists are accustomed to write about tourism on Weibo with tags on their locations.
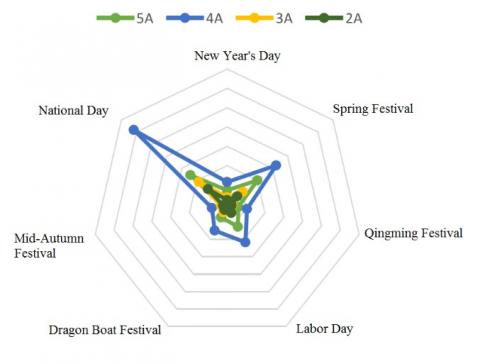
As mentioned before, the check-in data of scenic spots on different levels were also classified by holidays, namely, the New Year’s Day, the Spring Festival, the Qingming Festival, the Labor Day, the Dragon Boat Festival, the Mid-Autumn Festival and the National Day. The classification results are presented in Figure 6.
Figure 6. The check-in data during different holidays
It can be seen that the number of check-ins peaked on National Day and Spring Festival, and reached the minimum values on Qingming Festival and Mid-Autumn Festival.
Next, the check-in data were classified by holidays, weekends and workdays. The results are plotted in Figure 7 below.
Figure 7. Comparison between the number of check-ins on holidays, weekends and weekdays
As shown in Figure 7, more tourists checked in the scenic spots of the study area on holidays than in other periods, and workdays saw the fewest check-ins among all periods. The results are in line with the rhythm of life for most people.
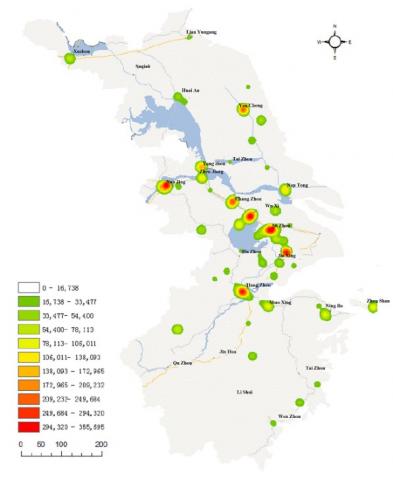
Next, the tourist hot spots in Jiangsu and Zhejiang were explored by kernel density analysis on the check-in data in A-level scenic spots, aiming to mine out the implicit information of the check-in data. The analysis results are visualized as Figure 8 below.
Figure 8. Kernel density of check-in data on A-level scenic spots in Jiangsu and Zhejiang
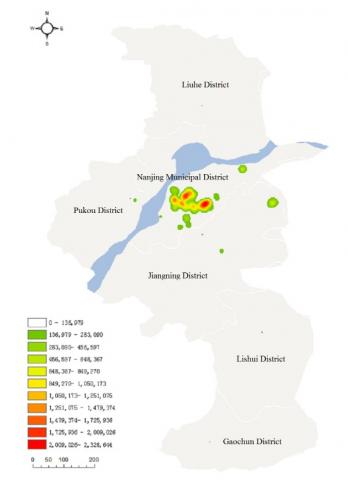
As can be seen from Figure 8, the data density of tourist check-ins peaked in Nanjing, Hangzhou, Suzhou and Wuxi. As a result, the check-in data in Nanjing and Suzhou were subjected to kernel density analysis. The analysis results of the two cities are displayed in Figures 9 and 10, respectively.
Figure 9. Kernel density of check-in data on A-level scenic spots in Nanjing
It can be seen from Figure 9 that the check-in data were highly concentrated in the downtown. The kernel density of check-in data in the downtown was much higher than that in any suburban district. Within the downtown, the check-in data distribution exhibited several peaks. For the suburbs, however, the data were generally scattered but localized in a few places.
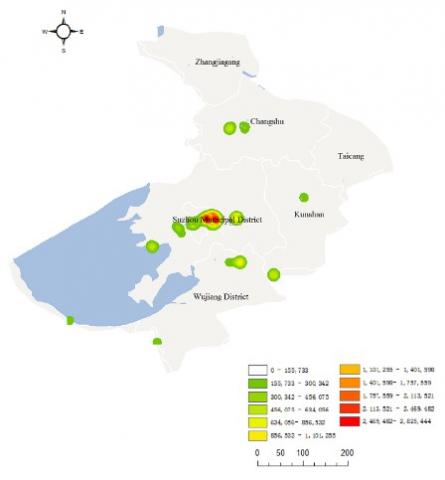
Figure 10. Kernel density of check-in data on A-level scenic spots in Suzhou
According to Figure 10, the kernel density of check-in data peaked in the downtown. There were also some hot spots in Wujiang and Changshu. Overall, the spatial distribution of check-in data was highly polarized. Within the downtown, the check-in data distribution exhibited several peaks. For the suburbs, however, the data were generally scattered but localized in a few places.
In this paper, the Weibo check-in data from 2016 to 2018 at A-level scenic spots in Jiangsu and Zhejiang are collected and preprocessed. Then, the SMG data were analyzed in terms of space and time to determine the trends of tourist check-ins in the study area. The trajectory of various moving objects was also explored to mine out the law of tourists’ travel behavior.
[1] Bao, J., Zheng, Y., Wilkie, D., Mokbel, M. (2015). Recommendations in location-based social networks: A survey. Geoinformatica, 19(3): 525-565. https://doi.org/10.1007/s10707-014-0220-8
[2] Sun, G.X., Bin, S. (2018). A new opinion leader detecting algorithm in multi-relationship online social networks. Multimedia Tools and Applications, 77(4): 4295-4307. https://doi.org/10.1007/s11042-017-4766-y
[3] Wu, H., Liu, Z., Zhang, S., Zuo, X.L. (2011). A spatio-temporal data model for road network in data center based on incremental updating in vehicle navigation system. Chinese Geographical Science, 21(3): 346-353. https://doi.org/10.1007/s11769-011-0446-4
[4] Wang, D.B., Yu, M.L., Yang, W.J., (2013). The establishment of D, E Grade GPS control network and fourth-order leveling network in Laicheng Industrial Zone of Laiwu City. Advanced Materials Research, 846: 888-892. https://doi.org/10.4028/www.scientific.net/amr.846-847.888
[5] Liu, T., Guo, J., Zhou, M. (2012). The application of two dimensional similarity transformation model in compatibility analysis of GPS network datum. Geotechnical Investigation & Surveying, 40(8): 68-71. https://doi.org/10.1007/s11783-011-0280-z
[6] Harrower, M., Keller, C.P., Hocking, D. (1997). Cartography on the Internet: Thoughts and a preliminary user survey. Cartographic Perspectives, 49(26): 1037-1038. https://doi.org/10.14714/CP26.718
[7] Huang, J., Jiang, Y.H., Su, J. (2013). GIS application in the analysis and evaluation of groundwater pollution and skills. Urban Geotechnical Investigation & Surveying, 79(3): 1343-1350. https://doi.org/10.1128/JVI.79.3.1343-1350.2005
[8] Gareth, I., Michele, V., George, P. (2015). Examining the capability of supervised machine learning classifiers in extracting flooded areas from Landsat TM imagery: A case study from a Mediterranean flood. Remote Sensing, 7(3): 3372-3399. https://doi.org/10.3390/rs70303372
[9] Cao, Y., O’Halloran, K. (2015). Learning human photo shooting patterns from large-scale community photo collections. Multimedia Tools and Applications, 74(24): 11499-11516. https://doi.org/10.1007/s11042-014-2247-0
[10] Zheng, Y. (2017). Location-based social networks. Journal of Consumer Marketing, 28: 821-833. https://doi.org/10.1007/978-1-4614-7163-9_319-1
[11] Zhang, C., Wang, K. (2016). POI recommendation through cross-region collaborative filtering. Knowledge and Information Systems, 46(2): 369-387. https://doi.org/10.1007/s10115-015-0825-8
[12] Okazaki, T., Kawano, H. (2015). Evaluation of display and manipulation of network map. Electronics & Communications in Japan, 80(6):83-92. https://doi.org/10.1002/(SICI)1520-6440(199706)80:63.0.CO;2-3
[13] Xiao, W., Luo, X., Li, Q., (2015). Online comment-based hotel quality automatic assessment using improved fuzzy comprehensive evaluation and fuzzy cognitive map. IEEE Transactions on Fuzzy Systems, 23(1): 72-84. https://doi.org/10.1109/TFUZZ.2015.2390226
[14] Gerber, M.S. (2014). Predicting crime using Twitter and kernel density estimation. Decision Support Systems, 61: 115-125. https://doi.org/10.1016/j.dss.2014.02.003
[15] Sun, G.X., Bin, S. (2017). Router-level internet topology evolution model based on multi-subnet composited complex network model. Journal of Internet Technology, 2017, 18(6): 1275-1283. https://doi.org/10.6138/JIT.2017.18.6.20140617
[16] Cheng, Z., Caverlee, J., Lee, K. (2013). A content-driven framework for geolocating microblog users. ACM Transactions on Intelligent Systems and Technology, 4(1): 1-27. https://doi.org/10.1145/2414425.2414427
[17] Do, T.M.T., Gaticaperez, D. (2014). The places of our lives: Visiting patterns and automatic labeling from longitudinal smartphone data. IEEE Transactions on Mobile Computing, 13(3): 638-648. https://doi.org/10.1109/TMC.2013.19
[18] Menghini, G., Carrasco, N., Schüssler, N. (2010). Route choice of cyclists in Zurich. Transportation Research Part A Policy & Practice, 44(9): 754-765. https://doi.org/10.1016/j.tra.2010.07.008
[19] Han, S., Kai, Z., Huang, J., (2015). Calibrating trajectory data for spatio-temporal similarity analysis. Vldb Journal - the International Journal on Very Large Data Bases, 24(1): 93-116. https://doi.org/10.1007/s00778-014-0365-y
[20] Zhou, S., Deng, L. (2010). Spatio-temporal pattern of residents' daily activities based on T-GIS: A case study in Guangzhou, China. Acta Geographica Sinica, 65(12): 1454-1463. https://doi.org/10.11821/xb201012002
[21] Shen, Y., Chai, Y. (2013). Daily activity space of suburban mega-community residents in Beijing based on GPS data. Acta Geographica Sinica, 68(4): 506-516. https://doi.org/10.3969/j.issn.0375-5444.2013.04.006