Roman Y. Korolkov* | Serhii V. Kutsak
© 2021 IIETA. This article is published by IIETA and is licensed under the CC BY 4.0 license (http://creativecommons.org/licenses/by/4.0/).
OPEN ACCESS
The “Evil twin” rogue access point is one of the most serious security threats to wireless LANs. To solve this problem, a practical approach has been proposed for detecting rogue access points using the received signal strength indicator (RSSI). First, a distributed architecture is presented, which consists of three network analyzers. Then, a cluster analysis of the RSSI vectors is performed to determine the attack. The coordinates of the centroids of clusters obtained were converted into the distance by using an empirical model of signal propagation under indoor conditions. The obtained distances are used to determine the localization of a rogue access point (RAP) using the trilateration method. Finally, we are conducting experiments to evaluate the performance of practical RAP detection. The results show that the proposed approach to detecting rogue access points can significantly reduce the frequency of false alarms, while providing an average localization error of 1.5m, which is quite acceptable for RAP localization in real indoor conditions.
access point, attack, clustering, localization, received signal strength, spoofing, trilateration, wireless network
With the evolution of wireless technology and the widespread use of mobile devices, wireless local area network (WLAN) has become an integral part of our daily lives. With the growing popularity of Wi-Fi networks, securing such a network is challenging. WLANs are becoming more and more vulnerable to dangerous attacks. One of the most serious threats to WLAN security in recent years is rogue access points, which violators use for espionage and attacks [1]. An open wireless transmission medium allows an attacker to easily detect the MAC addresses of other devices, which are usually used as unique identifiers for all nodes on the network. In addition, an attacker can use a spoofing attack to create and configure a rogue access point so-called “Evil Twin”. To do this, he forging the SSID and MAC address and also uses the same communication channel as the legitimate access point (LAP). By launching the “Evil Twin”, the attacker aims to connect legitimate users to it and gain access to confidential information [2]. Most client Wi-Fi devices are believed to automatically connect to the network whose ID they remember. In another situation, an attacker may can execute to a deauthentication attack [3], forcibly disconnecting the client from the LAP and further waiting for the client to connect to the RAP. Obviously, in this situation, an effective comprehensive approach is needed to detect a spoofing attack and localization of the rogue access point in order to disable it.
Quite a lot of scientific research articles is devoted to the study of the attacks that use rogue access points in WLAN and methods of their detection. However, this problem still today remains largely open due to certain shortcomings of the proposed solutions. We cannot cover the full scope of works in this section, so we give a brief explanation of the different RAP detection strategies and then indicate the works most closely related to our work. A detailed analysis and classification of existing methods for detecting rogue AP was considered by Alotaibi and Elleithy [4].
Methods based on monitoring network parameters [5] and unique access point identifiers (SSID, BSSID, IP-address) [6, 7] cannot be considered reliable because an attacker can launch a reconnaissance attack before launching a spoofing attack. Having defined network parameters and identifiers, he forges them, accordingly avoiding detection.
On the other hand, some papers [8-11] have been proposed time-based solutions. The basic idea is that a rogue access point relays traffic through legitimate access point, and because of this, there will be additional delay when connecting to a rogue access point. Time-based solutions are also not reliable, because in a WLAN with a high traffic load, various delays are possible due to interference and collisions. An attacker can also avoid detection by providing private connection, avoiding the effect of the delay caused by the additional transition.
Other authors [12-15] used clock skew to detect rogue access points. Because clock skew is a unique property for each access point and is hard to fake, an access point with a different clock skew than the one specified in the database is defined as RAP. However, expanding the network infrastructure and adding new or replacement of existing APs will change the “fingerprint”, which in turn will require changes in the database. In this case, once recorded identifiers cannot be used for long-term detection.
RSSI values can also be used to detect rogue access points. Wang et al. [16] proposed a mechanism for detecting unauthorized APs by analyzing RSSI from a specific SSID using a sliding window algorithm. However, the test revealed so-called “blind areas”, i.e. places where the same RSSI values from two different access points were recorded. This significantly reduces the true positive RAP detection result when using a single monitoring node. The authors in this paper showed that more monitoring nodes is required for reliable RAP detection. Ahmadpour and Kabiri [17] presented a signature-based detection method using RSSI and a distributed set of measurement points. The method has proven to be sensitive to the distance between the attacker and the victim, that leads to low detection rates. In places with a strong shading effect, such as offices with rigid partitions, the accuracy was lower than in places such as empty halls, where the shading effect is much less. Experiments show that the greater the distance between the target and the monitoring node, the greater the loss of frames, which leads to a decrease in accuracy due to the omission of some frames that could have been sent by an attacker. Wu et al. [18] proposed an approach PRAPD to detect rogue access points based on RSSI. The authors presented a scheme of data pre-processing to eliminate missing values in the collected RSSI vectors by filling, filtering and averaging data. The k-medoid algorithm was then used to perform cluster analysis of RSSI vectors, and a distance measurement method was proposed that dynamically uses partial components in RSSI vectors to minimize distance deviation caused by missed values. This approach requires additional sniffers, and complicates the processing of multidimensional RSSI data.
Although there are many proposed approaches, they do not completely solve the problem of protecting WLAN from attacks RAP, as they focus on detecting the very fact of the attack and at the same time do not offer solutions for determining the location of RAP. Therefore, together with this, we have considered the works related to this article, based on RSSI, and which allows to determine the attack and at the same time the location of RAP indoors. Such works are [19, 20] in which the authors proposed a method using spatial correlation of RSSI to detect attacks and localization of spoofing node, performing cluster analysis of RSSI. In their work, the authors showed that the positions of attackers can be determined with an average error of 10 feet, using localization algorithms, area-based [21] and point-based, on the example of the RADAR algorithm [22].
In view of the above, in this work we seek to improve RAP detection methods based on RSSI spatial correlation. In this solution, we propose to use at least 3 distributed analyzers in different locations, which will significantly complicate the task of the attacker to remain unnoticed, and to convert the centroid coordinates of the obtained clusters of RSSI values into distance using the indoor radio-wave propagation model.
2.1 Assumptions
In this paper, we assume that:
(1) Attacker is able to simulate configuration of a legitimate access point, including the SSID, BSSID, and others, implementing the “Evil Twin” attack.
(2) The legitimate AP and the rogue AP are in the same area during the attack process, but their location is different because an unknown device located near the legitimate access point will easily attract the attention of network administrators.
(3) “Evil Twin” can establish a connection using a legitimate access point that is already configured to provide Internet services, or “Evil Twin” can provide a private Internet connection that will allow it to overcome some existing time-based attack detection methodologies.
Therefore, the security strategy should identify and disconnect rogue access points as reliably as possible.
In a “Evil Twin” attack with a BSSID spoofing, the LAP and RAP devices use the same ID to transmit data packets. Accordingly, RSSIs come from each individual node (LAP and RAP) and are mixed in the signal space. Since RSSI from the access point correlates with the distance in physical space, it seems possible to carry out the cluster analysis based on the spatial correlation of RSSI [19]. The signal level of the received frame, which is measured on several analyzers, can be represented as a vector RSSI={RSSI1, RSSI2, ... RSSIN}, where N –is the number of analyzers (sniffers) which capture network frames and collect RSSI values, as shown in Figure 1.
Figure 1. Collecting RSSI values by network analyzers
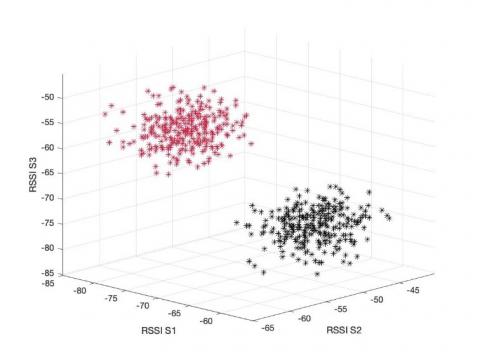
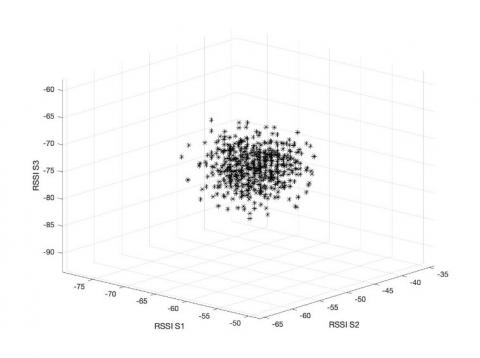
In the absence of an attack, the RSSI values come from the LAP from the same physical location, which will form a sequence of vectors, close to each other, oscillating around the middle vector. At the time when an attacker launches an attack, RSSI values from different locations should eventually form different clusters (LAP and RAP respectively) in N-dimensional space. This assumption is illustrated in Figure 2, which presents RSSI vectors received by three sniffers (N = 3) from one AP and two APs (at different physical locations).
(a) two access points located in different physical locations
(b) one access point
Figure 2. Distribution of RSSI values in the 3D space
In this case, it is possible to determine centroids of clusters obtained and the distance between them, based on which the attack can be detected. Additionally, the mean of all points belonging to a given cluster in N-dimensional space (centroids) can be used to localize RAP [20].
2.2 RAP detection and localization method
Thus, it is possible to implement an attack detector that uses as a parameter of observation the RSSI value.
Let's outline the main stages of attack detection:
(1) RSSI aggregation.
(2) Division RSSI values into 2 clusters.
(3) Determination of the distance between two centroids as an attack detection parameter.
(4) Rogue access point localization.
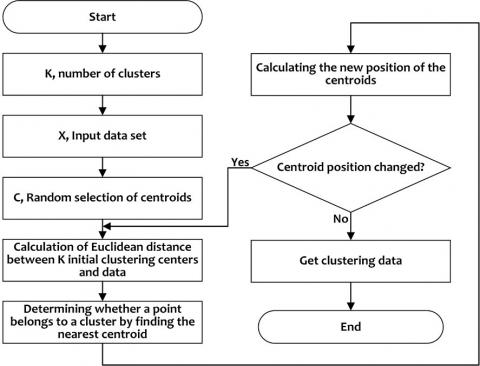
The block diagram of the k-means clustering algorithm is shown in Figure 4.
2.2.1 RSSI aggregation
In order to aggregate the RSSI values obtained by the analyzers, it is proposed to use the timestamp from the beacon frame [18].
From the structure of the beacon frame [23] in Figure 3 it can be seen that there is a timestamp field. The timestamp will be inserted in this field when the frame is ready to send, and the timestamp can be used to aggregate the RSSI values collected by multiple analyzers.
RSSI values can be obtained by a network traffic analyzer program from the Radiotap header of captured frames using the pcap library. We use the Wireshark program [24] and identify the frames by filtering on the MAC address of the AP.
Figure 3. Structure of fixed fields in the beacon frame
Figure 4. Block diagram of the k-means algorithm
2.2.2 Division of RSSI values into 2 clusters
For the procedure of clustering RSSI sequences from “Evil Twin” and LAP, the classic algorithm of uncontrolled hard partitioning into k-means clusters is suitable. K-means was proposed by MacQueen J in 1967 and belongs to the distance-based clustering algorithm [25].
The goal is to find k clusters of data based on the objective function J specified in the equation:
$J=\sum_{j=1}^{k} \sum_{i=1}^{n}\left\|X_{i}^{(j)}-C_{j}\right\|^{2}$, (1)
where, $\left\|X_{i}^{(j)}-C_{j}\right\|^{2}$ – a measure of the distance between the i-th data point and the j-th center of the cluster; n – is the total number of data points.
The main idea of the k-means algorithm is to represent each cluster by its average value, i.e. the centroid, and to minimize the objective function (1). For this
(1) From the initial set of points, k-points (centroids) are randomly selected.
(2) Points are distributed across clusters by determining the distance between the data point and the centroids (the point is assigned to the closest centroid).
(3) Finding the new position of the centroids as the average of all points belonging to the cluster.
(4) Executing (2) and (3) until the centroids stop changing their position or to a certain threshold of changing the position of the centroids.
Thus, the RAP attack can be detected based on the distance between the two centroids of the obtained clusters.
2.2.3 The distance between two centroids as an attack detection parameter
As mentioned, under normal conditions, RSSI values coming from one physical AP location are usually not subject to significant fluctuations, so the centroids should be close to each other. However, during an attack, there is more than one node with different locations in physical space that use the same ID. As a result, clusters with a large centroid spacing associated with different locations in the physical space of the access points will be formed in the signal space.
$D=\left\|C_{i}-C_{i}\right\|,$ (2)
where, D – the distance between the centroids of the obtained clusters.
A RSSI anomaly will be registered only if the distance between the centroids is greater than the set threshold.
Eq. (3) determines the condition under which the spoofing attack is detect.
$\Delta \leq D$, (3)
where, D - attack detection threshold.
Properly selected threshold $\Delta$ will allow minimize false-alarm of the attack detector. The detection threshold $\Delta$ will be determined empirically in the following sections.
2.2.4 Rogue access point localization
If the fact of attack is established, then the next logical step is to localize the rogue AP.
In our work, we use the lateration-based method to estimate the position of RAP [26]. It is based on the calculation of the distances di between the desired access point and N analyzers with known coordinates and the subsequent solution of the system of nonlinear equations. When N=3 (minimum number), this method is also known as trilateration.
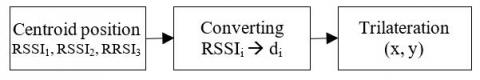
The RAP coordinates are proposed to be determined according to the trilateration algorithm, based on the centroids of the obtained clusters, Figure 5.
Figure 5. Stages of determining RAP coordinates
Figure 6 illustrates the trilateration method. The points $\mathrm{S}_{1}\left(x_{1}, y_{1}\right)$, $\mathrm{S}_{2}\left(x_{2}, y_{2}\right)$ and $\mathrm{S}_{3}\left(x_{3}, y_{3}\right)$ are sniffers (reference nodes), and the point at the intersection of the three circles is the location of the sought-for node. The distances from the sought-for point to the reference nodes are d1, d2 і d3.
Figure 6. Geometric interpretation of the trilateration method
The location of AP can be determined by solving the following system of quadratic equations [27]:
$\left\{\begin{array}{l}\left(x-x_{1}\right)^{2}+\left(y-y_{1}\right)^{2}=d_{1}^{2} \\ \left(x-x_{2}\right)^{2}+\left(y-y_{2}\right)^{2}=d_{2}^{2} \\ \left(x-x_{3}\right)^{2}+\left(y-y_{3}\right)^{2}=d_{3}^{2}\end{array}\right.$, (4)
where, x1, x2, x3, y1, y2, y3 – coordinates of reference nodes (sniffers); d1, d2, d3 – calculated distances.
Simplifying the system of quadratic Eq. (4), one can obtain
$2\left(x_{2}-x_{1}\right) x+2\left(y_{2}-y_{1}\right) y$$=\left(d_{1}^{2}-d_{2}^{2}\right)-\left(x_{1}^{2}-x_{2}^{2}\right)-\left(y_{1}^{2}-y_{2}^{2}\right)$
$2\left(x_{3}-x_{1}\right) x+2\left(y_{3}-y_{1}\right) y$$=\left(d_{1}^{2}-d_{3}^{2}\right)-\left(x_{1}^{2}-x_{3}^{2}\right)-\left(y_{1}^{2}-y_{3}^{2}\right)$ (5)
The X and Y coordinates are found by solving Eq. (5) using Cramer's rule.
X=$\frac{\left|\begin{array}{cc}\left(d_{1}^{2}-d_{2}^{2}\right)-\left(x_{1}^{2}-x_{2}^{2}\right)-\left(y_{1}^{2}-y_{2}^{2}\right) & 2\left(y_{2}-y_{1}\right) \\ \left(d_{1}^{2}-d_{3}^{2}\right)-\left(x_{1}^{2}-x_{3}^{2}\right)-\left(y_{1}^{2}-y_{3}^{2}\right) & 2\left(y_{3}-y_{1}\right)\end{array}\right|}{\left|\begin{array}{ll}2\left(x_{2}-x_{1}\right) & 2\left(y_{2}-y_{1}\right) \\ 2\left(x_{3}-x_{1}\right) & 2\left(y_{3}-y_{1}\right)\end{array}\right|}$ (6)
$Y=$$\frac{\left|\begin{array}{ll}2\left(x_{2}-x_{1}\right) & \left(d_{1}^{2}-d_{2}^{2}\right)-\left(x_{1}^{2}-x_{2}^{2}\right)-\left(y_{1}^{2}-y_{2}^{2}\right) \\ 2\left(x_{3}-x_{1}\right) & \left(d_{1}^{2}-d_{3}^{2}\right)-\left(x_{1}^{2}-x_{3}^{2}\right)-\left(y_{1}^{2}-y_{3}^{2}\right)\end{array}\right|}{\left|\begin{array}{ll}2\left(x_{2}-x_{1}\right) & 2\left(y_{2}-y_{1}\right) \\ 2\left(x_{3}-x_{1}\right) & 2\left(y_{3}-y_{1}\right)\end{array}\right|}$ (7)
We consider the situation when LAP and RAP are located indoors. This is a realistic situation and more complex in terms of determining the location of RAP by finding a mathematical relationship between the value of RSSI and distance and choosing the appropriate model of radio wave propagation.
The trilateration method involves the conversion of fixed RSSI values into distance [28]. The relationship between the received signal strength and the distance can be determined according to the Friis transmission equation [29] as
$P_{r}=P_{t} \frac{G_{t} G_{r} \lambda^{2}}{(4 \pi)^{2} d^{n}}$, (8)
where, Gt – transmitter antenna gain; Gr – receiver antenna gain; Pt – transmitter power, W; Pr – power received by a receiving antenna, W; d – distance between the transmitting and receiving antennas, m; n – loss factor of signal propagation medium (for free space n=2).
The relationship between signal strength, measured in dBm and mW, is defined as
$P_{d B m}=10 \log _{10}\left(P_{m W}\right)$ (9)
It should be noted that the Friis equation can be applied only under ideal conditions i.e., when propagating radio waves in free space. The problem considered in the article involves determining the position of the object indoors, so in our case the results of converting the value of the signal level into distance using the Friis equation for free space will not be accurate.
The reason for the error that will occur during localization is that the signal strength from AP may be affected by various factors, such as
Substituting expression (8) in (9), we obtain a relation that is a logarithmic model of signal propagation with averaged interference, One slope [30]
$P_{r}(d)=P_{0}-10 n \log _{10}(d)$, (10)
where, $P_{0}=10 \log _{10}\left[P_{t} G_{t} G_{r}\left(\frac{\lambda}{4 \pi}\right)^{2}\right]$ – power of the received signal at a distance d=1m; Pr(d) – power of the received signal on the track for the actual distance d.
The relationship between the distance di in different positions and RSSIi can be determined as follows:
$R S S I_{i}=-10 n \log _{10} d_{i}+A$ , (11)
where, A=P0.
Consequently, the distance di
$d_{i}=10^{\left(\frac{A-R S S I_{i}}{10 n}\right)}$ (12)
To bring (12) in accordance with the relationship between RSSI and the distance inside particular building, it is necessary to refine the signal propagation model. The values of both A and n must be found empirically. The easiest way to find the relationship between RSSI and the distance from transmitter to receiver is to collect RSSI data at points with known coordinates.
Experimental data were obtained during measurements conducted at the National University “Zaporizhzhia Polytechnic” at the Department of Information Security. On the floor there are laboratories separated by walls, in each of the laboratories there is electronic equipment, computers, furniture, etc. These factors, as well as the direction of the signal propagation line, affect the signal propagation and its level. The measurement procedure was performed from different directions.
The floor plan of the building on which the measurements were taken is shown in Figure 7.
Figure 7. Building floor plan
On the scheme, access points are designated as AP. The crosses are the places of the received signal strength measurement. APs are set to 1 channel (2412 MHz).
After collecting RSSI value at different distances (1 to 20m) from the two access points and performing a logarithmic approximation of the data in accordance with equation 12, we determined A and n (A = -25.86, n = 4.172), Figure 8.
The same abscissa values of some points are explained by the fact that the distance from receiver to transmitter at these points is the same, but the obstacles in the signal path from transmitter to receiver are different, as a result, the values of signal loss at these points are also different.
Figure 8. Dependence of the received signal strength on the distance
Experimental results have presented to determine the threshold value of Δ and evaluate the effectiveness of the presented approach.
The test Wi-Fi network is equipped with a wireless router that is LAP. To simulate an “Evil Twin” attack, we run a software-implemented RAP on Kali Linux-based laptop with a TL-WN722N wireless USB adapter. Netbooks with AWUS036ACH wireless USB adapters are used as network traffic analyzers to collect RSSI. Wireless sniffer interfaces are configured in monitoring mode for passive interception of 100 beacon frames to receive RSSI. Next, the PC as a central server, combines the collected RSSI values, performs cluster analysis and in case of detection of an attack uses the method of trilateration to locate a rogue access point. Analyzers (sniffers S1, S2, S3) are placed within the protected object so that they can cover the protection areas as much as possible.
3.1 The choice of detection threshold value D
Since k-means is an algorithm for uncontrolled hard partitioning into clusters, even in the absence of an attack, two clusters with their centroids will be formed, which will lead to false definition of the attack.
In order to minimize false-alarm of the attack detector, it is necessary to determine empirically the threshold Δ. To decide on the choice of Δ let's use the following indicators:
(1) False positives are alarms that occur when an algorithm mistakenly classifies a normal event as an attack.
(2) False negatives - this is a situation where the detection algorithm cannot identify the attack and does not raise an alarm.
Therefore, to determine the optimal value of the detector threshold, we determine false positives in the absence of attack and false negatives when RAP is present in the network.
Choosing Δ is to find a compromise between false-positive and false-negative results for different thresholds.
In experiments with the attack, we first place the RAP in close proximity to the LAP, i.e. at a distance of half a meter, and analyze the false-negative. The RAP was then placed at a distance of 1 meter and again data were collected for analysis.
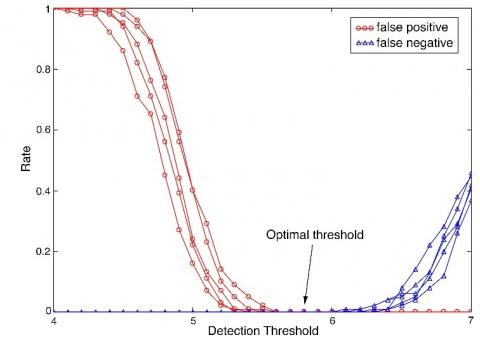
After analyzing the data obtained, Figure 9 shows a large number of false positives and the absence of false negative results at low thresholds, such as D£5.3. The high level of false positives is associated with fluctuations in the signal level caused by the design features of the building and diffraction during the propagation of signals within it. As the threshold increase D, the number of false negatives increase and the number of false positives to approach zero. If we raise the threshold D to 5.8, we will eliminate all false positives, but this threshold will lead to 20% of false negatives.
Therefore, the choice of threshold should be a balance between the need to detect an attack and the allowable security risk. At D=5.8 false negative results can be explained by the geographical proximity of the RAP and LAP, Figure 9 (a). But it should be noted that in our case (when using three analyzers) for the occurrence of false-negative results, the attacker must be located very close (less than 1m) to the LAP. Otherwise, D>>D, which will lead to zero false negative results, i.e. the correct definition of the attack, Figure 9 (b).
In our subsequent experiments at D=5.8 and the distance of RAP from LAP at a distance of 1 m or more, there were no false-negative results, i.e. all attacks were successfully and accurately detected.
(a) distance between LAP and RAP is 0.5m
(b) distance between LAP and RAP 1.0m
Figure 9. False positive and false negative rates for different thresholds according to the results of 5 measurements
3.2 RAP localization
Finally, we launch the “Evil Twin” attack in different positions and compare the calculated coordinates with the actual ones.
The coordinates of the position of the LAP and analyzers are shown in Table 1 and shown on the floor plan, Figure 10.
Table 1. Sniffers and LAP position
|
Markers |
Position |
|
|
x (m) |
y (m) |
|
|
Sniffer 1 |
9.2 |
11.7 |
|
Sniffer 2 |
18.1 |
4.2 |
|
Sniffer 3 |
26.8 |
11.9 |
|
LAP |
13.7 |
4.2 |
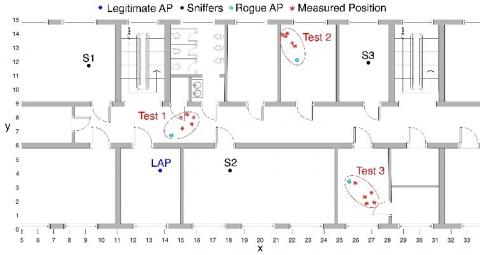
We performed three tests, placing the RAPs in different locations, marking them on the floor plan as Test 1,2,3 and making five measurements for each of them.
The coordinates of the actual location of the RAP, the results of the calculated provisions, their average value and positioning errors are given in Table 2. The errors are the difference between the actual position and the calculated one.
Figure 10. Calculated RAP position results for Test 1,2,3 on the building’s floor plan
Table 2. Localization results for five measurements of three different RAP positions
|
Tests |
Actual position x,y (m) |
Predicted Position x,y (m) |
Error (m) |
|
Test 1 RAP |
14.4, 6.7 |
15.4,8.2 |
1.8 |
|
15.7,7.5 |
1.53 |
||
|
15.0,8.0 |
1.43 |
||
|
15.8,8.0 |
1.91 |
||
|
15.1,7.2 |
0.86 |
||
|
Average Position |
|
15.4,7.78 |
1.47 |
|
Test 2 RAP |
22.3, 12.1 |
21.6,13.8 |
1.84 |
|
21.7,14.0 |
1.99 |
||
|
21.4,13.9 |
2.01 |
||
|
22.2,13.1 |
1.0 |
||
|
22.0,13.3 |
1.24 |
||
|
Average Position |
|
21.78,13.62 |
1.61 |
|
Test 3 RAP |
25.6, 3.4 |
26.7,1.84 |
1.91 |
|
26.6,2.3 |
1.49 |
||
|
27.2,1.9 |
2.19 |
||
|
26.0,3.3 |
0.41 |
||
|
27.0,2.6 |
1.61 |
||
|
Average Position |
|
26.7,2.39 |
1.49 |
In the RAP location tests, the trilateration algorithm gave very good results, with an average error of ~ 1.5m according to the results of five measurements.
In this paper, we aim to improve RAP detection methods based on RSSI spatial correlation. The proposed solution uses 3 distributed analyzers, which significantly complicates the task of the attacker to remain undetected and at the same time allows additional localization of RAP.
Our experimental results confirm the effectiveness of the k-means method as an attack detector and a trilateration algorithm as a rogue AP localizer. The trilateration method is based on a geometric approach and shares the benefits of relatively low computational costs and ease of implementation. The method provides the accuracy of RAP localization up to 3 meters depending on the characteristics of the environment, and the average localization error was about 1.5 meters. These error values are quite acceptable for localization of RAP in real indoor conditions. Such results were obtained due to an empirically refined indoor radio propagation model. Properly set attack detection threshold eliminates all false positives and false negatives results, provided that the RAP is at a distance of more than 1 meter from the LAP.
Further research and efforts should be focused on developing an algorithm for localization in three-dimensional space indoors.
[1] Židková, N., Maryška, M., Doucek, P., Nedomova, L. (2020). Security of Wi-Fi as a key factor for IoT. Hradec Economic Days, 906-914. https://doi.org/10.36689/uhk/hed/2020-01-101
[2] Orsi, R. (2018). Russian Wi-Fi Hacking-Evil Twin attacks...Secplicity-Security Simplified. https://www.secplicity.org/2018/10/07/russian-wi-fi-hacking-evil-twin-attacks-explained/.
[3] Korolkov, R.Y., Kutsak S.V. (2019). The features of a deauthentication attack implementation in networks 802.11. Ukrainian Information Security Research Journal, 21(3): 175-181. https://doi.org/10.18372/2410-7840.21.13953
[4] Alotaibi, B., Elleithy, K. (2016). Rogue access point detection: Taxonomy, challenges, and future directions. Wireless Personal Communications, 90(3): 1261-1290. https://doi.org/10.1007/s11277-016-3390-x
[5] Agyemang, J.O., Kponyo, J.J., Klogo, G.S.A. (2019). Lightweight rogue access point detection algorithm for embedded internet of things (IoT) devices. Information Security and Computer Fraud, 7(1): 7-12. https://doi.org/10.12691/iscf-7-1-2
[6] VanSickle, R., Abegaz, T., Payne, B. (2019). Effectiveness of tools in identifying rogue access points on a wireless network. In: 2019 KSU Proceedings on Cybersecurity Education, Research and Practice (CCERP), 5.
[7] Sriram, V.S., Sahoo, G., Agrawal, K.K. (2010). Detecting and eliminating rogue access points in IEEE-802.11 WLAN-a multi-agent sourcing methodology. In 2010 IEEE 2nd International Advance Computing Conference (IACC), pp. 256-260. https://doi.org/10.1109/iadcc.2010.5422999
[8] Han, H., Sheng, B., Tan, C.C., Li, Q., Lu, S. (2011). A timing-based scheme for rogue AP detection. IEEE Transactions on Parallel and Distributed Systems, 22(11): 1912-1925. https://doi.org/10.1109/tpds.2011.125
[9] Qu, G., Michael, M.N. (2010). RAPiD: An indirect rogue access points detection system. In International Performance Computing and Communications Conference, pp. 9-16. https://doi.org/10.1109/pccc.2010.5682342
[10] Song, Y., Yang, C., Gu, G. (2010). Who is peeping at your passwords at Starbucks? To catch an evil twin access point. In 2010 IEEE/IFIP International Conference on Dependable Systems & Networks (DSN), pp. 323-332. https://doi.org/10.1109/dsn.2010.5544302
[11] Yang, C., Song, Y., Gu, G. (2012). Active user-side evil twin access point detection using statistical techniques. IEEE Transactions on Information Forensics and Security, 7(5): 1638-1651. https://doi.org/10.1109/tifs.2012.2207383
[12] Lanze, F., Panchenko, A., Braatz, B., Zinnen, A. (2012, December). Clock skew based remote device fingerprinting demystified. In 2012 IEEE Global Communications Conference (GLOBECOM), pp. 813-819. https://doi.org/10.1109/glocom.2012.6503213
[13] Jana, S., Kasera, S.K. (2009). On fast and accurate detection of unauthorized wireless access points using clock skews. IEEE Transactions on Mobile Computing, 9(3): 449-462. https://doi.org/10.1109/tmc.2009.145
[14] Arackaparambil, C., Bratus, S., Shubina, A., Kotz, D. (2010). On the reliability of wireless fingerprinting using clock skews. In Proceedings of the Third ACM Conference on Wireless Network Security, pp. 169-174. https://doi.org/10.1145/1741866.1741894
[15] Lanze, F., Panchenko, A., Braatz, B., Engel, T. (2014). Letting the puss in boots sweat: Detecting fake access points using dependency of clock skews on temperature. In Proceedings of the 9th ACM Symposium on Information, Computer and Communications Security, pp. 3-14. https://doi.org/10.1145/2590296.2590333
[16] Wang, L., Wyglinski, A.M. (2014). Detection of man-in-the-middle attacks using physical layer wireless security techniques. Wireless Communications and Mobile Computing, 16(4): 408-426. https://doi.org/10.1002/wcm.2527
[17] Ahmadpour, D., Kabiri, P. (2020). Detecting forged management frames with spoofed addresses in IEEE 802.11 networks using received signal strength indicator. Iran Journal of Computer Science, 3(3): 137-143. https://doi.org/10.1007/s42044-020-00053-3
[18] Wu, W., Gu, X., Dong, K., Shi, X., Yang, M. (2018). PRAPD: A novel received signal strength–based approach for practical rogue access point detection. International Journal of Distributed Sensor Networks, 14(8): 1550147718795838. https://doi.org/10.1177/1550147718795838
[19] Chen, Y., Trappe, W., Martin, R.P. (2007). Detecting and localizing wireless spoofing attacks. In 2007 4th Annual IEEE Communications Society Conference on Sensor, Mesh and ad Hoc Communications and Networks, pp. 193-202. https://doi.org/10.1109/sahcn.2007.4292831
[20] Chen, Y., Yang, J., Trappe, W., Martin, R.P. (2010). Detecting and localizing identity-based attacks in wireless and sensor networks. IEEE Transactions on Vehicular Technology, 59(5): 2418-2434. https://doi.org/10.1109/tvt.2010.2044904
[21] Elnahrawy, E., Li, X., Martin, R.P. (2004). The limits of localization using signal strength: A comparative study. In 2004 First Annual IEEE Communications Society Conference on Sensor and Ad Hoc Communications and Networks, 2004. IEEE SECON 2004, pp. 406-414. https://doi.org/10.1109/sahcn.2004.1381942
[22] Bahl, P., Padmanabhan, V.N. (2000). RADAR: An in-building RF-based user location and tracking system. In Proceedings IEEE INFOCOM 2000. Conference on computer communications. Nineteenth Annual Joint Conference of the IEEE Computer and Communications Societies (Cat. No. 00CH37064), 2: 775-784. https://doi.org/10.1109/infcom.2000.832252
[23] Gast, M. (2005). 802.11 wireless networks: the definitive guide. " O'Reilly Media, Inc." O’Reilly Media.
[24] https://www.wireshark.org, accessed on 11 October 2020.
[25] MacQueen, J. (1967). Some methods for classification and analysis of multivariate observations. In Proceedings of the fifth Berkeley Symposium on Mathematical Statistics and Probability, 1(14): 281-297.
[26] Zhang, D., Xia, F., Yang, Z., Yao, L., Zhao, W. (2010). Localization technologies for indoor human tracking. In 2010 5th International Conference on Future Information Technology, pp. 1-6. https://doi.org/10.1109/futuretech.2010.5482731
[27] Orujov, F., Maskeliunas, R. (2016). Comparative analysis of the indoor positioning algorithms using Bluetooth low energy beacons. In Proceedings of the 2016 International Conference for Young Researchers in Informatics, Mathematics and Engineering, ICYRIME 2016, pp. 53-57.
[28] Goldoni, E., Savioli, A., Risi, M., Gamba, P. (2010). Experimental analysis of RSSI-based indoor localization with IEEE 802.15. 4. In 2010 European Wireless Conference (EW), pp. 71-77. https://doi.org/10.1109/ew.2010.5483396
[29] Friis, H.T. (1946). A note on a simple transmission formula. Proceedings of the IRE, 34(5): 254-256. https://doi.org/10.1109/JRPROC.1946.234568
[30] Mogensen, P.E., Wigard, J. (1999). COST Action 231: Digital Mobile Radio Towards Future Generation System, Final Report. In Section 5.2: On antenna and frequency diversity in GSM. Section 5.3: Capacity study of frequency hopping GSM Network. 175-189.