Bhuvana Ramkumar | Varshitha Harish* | Rashmi Srinivasaiah | Swamy Devappa Renuka | Narayanappa Thimmarayappa Vijalapura
© 2020 IIETA. This article is published by IIETA and is licensed under the CC BY 4.0 license (http://creativecommons.org/licenses/by/4.0/).
OPEN ACCESS
Workplace safety practices are vital for the well-being of both employees and employers, particularly in hazardous industries. The present study aims to design and validate a scale to assess the Safety Engineering Systems (SES) practices in Major Hazardous Industries (MHI). Based on the primary components identified through an empirical literature review, a survey instrument was developed and distributed among the employees of sample MHI's in Karnataka. Exploratory factor analysis (EFA), was conducted to measure the validity and reliability of the questionnaire. Using 'R' software, Partial Least Square Structural Equation Model (PLS-SEM) was carried out to confirm the results of EFA. The outcome emphasizes the relevance of SES prominence in risk analysis of hazardous industries.
safety engineering systems, exploratory factor analysis, major hazardous industries, R software, partial least square structural equation model, survey instrument
One of the earliest researches in industrial safety was‘The Domino theory of accident causation’, where 88% of all accidents are triggered by unsafe acts of workers and 10% by unsafe actions” [1]. This theory was revised because the emphasis was given only on workers, not considering the fault of management and organizations. Essentially pro-active management must comply with strict safety legislation, and create healthy workplace safety practices and policies. It is imperative to diminish the risks of human life in industries through accidents and injuries, especially in high-risk sectors such as nuclear, aircraft, chemical, mining, oil and gas industries, where a fatal mistake can be catastrophic. Thus, the evolution of systems engineering safety is out of necessity, making safety a priority in the fast-evolving productivity-driven work environment where engineers take a more serious approach to designing safety into both systems and products. System safety was described as “organized common sense”[2].
System engineering safety is a planned, disciplined, comprehensive, and systematic approach to identifying, analyzing, eliminating, and controlling hazards. The critical purpose of the practice is to remove the severity and probabilities of the recognized hazards and to diminish risk where the hazards cannot be eliminated. SES comprises fault-tolerant equipment, fireproof and fail-safe characteristics, also with enclosed hazardous systems to prevent exposure. It also includes choosing the least hazardous resources, constructing a safe design with environmental aspects of the workplace, maintaining safeguarding schedules, carrying out regular safety reviews, employee training regarding safety issues with performing audit and inspection measures. The hazardous industry environment has entered a new era in continuation of safety which involves installations were any substance produced, processed, used, handled, or stored has the potential to cause a major accident. This article will identify the underlying safety engineering systems factors in Major Hazardous Industries in Karnataka, India, and explain the framework in designing an instrument for the assessment of safety engineering system components. These factors can be taken into consideration by policymakers as potential approaches for risk analysis.
The major incident which captured the world’s reaction and led the main chemical corporations to issue global corporate policy statements was the chemical disaster in Bhopal, India in 1984, mainly caused due to a massive release of volatile methyl isocyanate, it killed nearly 2,000 people resulted from operating slips, design defects, maintenance and preparation deficiencies that endangered safety. According to Adebiyi and Charles‐Owaba [3] and Forastieri [4], a list of maintenance faults causing accidents include the hazardous operation of the system during maintenance, incomplete installation of parts, erroneous assembly of parts, incorrect tool usage, inaccurate equipment/part installed; part damaged during the repair.
It is stated that due to lack of proper layout of the workplace, storage places, poorly designed succession of work operations and workflow increases the potential hazards [5]. Investigations into major disasters in safety-critical industries [6] consistently reveal failings in safety leadership, including poor decision-making and lack of effective challenge and inadequate management oversight and scrutiny of safety, as major contributory factors. The top management commitment, the flexibility of work system designs in coping with hazards, the learning culture particularly from incidents and routine work matters the most in safety system establishment [7].
Table 1. Factors of safety systems considered by various researchers
|
Reference |
Factors |
|
[8] |
Repeated visits to top management, retaining employees for a longer time. |
|
[9] |
The hiring of a field safety representative, training of workers, and orientation to new workers about safety. |
|
[10] |
Monitoring safety performance, management strategy to implement safety, delegation of safety procedures in personnel, monitoring air quality frequently. |
|
[11] |
Strong support from top-management, checking safety level at regular intervals, conductions of detailed job site safety tours, employing sophisticated scheduling techniques, reducing job pressure, good communication between workers and top management |
|
[12] |
Providing appropriate machine guards, shield for the workplace, painted coating in the areas of the workers' movement, periodic examination of installed facilities. |
|
[13] |
Legal hires, framing health and safety policy, safety training and orientation, safety incentives provided, accident investigation, recordkeeping, and follow-up undertaken. |
|
[14] |
Top-management interests in the safety of employees, providing safety booklets as a means of guidelines, appointing a trained safety representative on site. |
|
[15] |
Safety awareness programs to be conducted, collecting annual reports to obtain information regarding industrial safety through annual reports, conduction ergonomics surveys related to work stations and systems. |
|
[16] |
Active supervisor's role in worker safety onsite, high consciousness of workers, a strong commitment of top managers, accident reporting. |
|
[17] |
The definition of codes and standards, development of safety policy, organized emergency plan and procedures, formation of the safety committee, the designation of safety responsibility to all site personnel. |
|
[18] |
Delegation of authority and responsibility, management support, successful enforcement safety method, safety equipment acquisition and maintenance, suitable safety education, and training. |
|
[19] |
Inspection and maintenance, management and workforce engagement on safety, number of incidents/near misses, personal safety, plant design, instrumentation, and alarms. |
|
[20] |
Working procedure, safety guards and barriers, use of personal protective equipment, reliable assessment |
|
[21] |
Materials and equipment handling, risk assessment and control, team communication, shop floor, and worker behavior improvement efforts. |
|
[22] |
Address environmental or ergonomic hazards. |
The factors considered by various authors in Table 1 mainly emphasize assessing the safety system in different sectors. The factors vary majorly on the working environment and category of potential hazards like physical, chemical, or electrical. From the review so far, it is found that adequate literature is not available on SES in MHI. Safety engineering systems are generally called safety systems in the literature. This is a very broad theme that has several overlapping dimensions which includes the condition of the physical plant, equipment’s used, safety systems such as to permit to work, hazard identification system, incident reporting systems, accident investigation system, record keeping, selection promotion and training, safety department effectiveness, safety communication system and feedback mechanisms [23]. The factors that are appropriate for SES in MHI are considered in the present study to create a direct impact on the reduction of accident rate while handling various hazardous substances.
Out of a total of 72 MHI in the state of Karnataka, a sampling approach was devised in the present study. The data was collected through a structured questionnaire based on 14 components that were identified through an extensive literature survey. The developed survey instrument was administered to 1300 respondents of 22 MHIs. Duly completed questionnaires were collected from 1123 employees. Out of that, 1029 questionnaires were found to be valid, appropriate, and hence considered for the final analysis. The responses of the remaining 94 questionnaires were rejected because they were illegible, inappropriate, and incomplete. Exploratory Factor Analysis was conducted on the surveyed data to reduce the safety engineering systems components and to extract the predominant components using Principal Axis Factor. Partial least square structural equation modeling was conducted using ‘R’ to validate the results.
3.1 Sample for the study
To represent the population for the present research reasonably, a convenience sampling approach was adopted. All the population characteristics have been considered while deciding the sample size. In this study, the unit of analysis was employees of MHIS like executives, engineers, managers, supervisors, operators, and helpers and the population is from different MHIs from various parts of the State of Karnataka. The sample size for this research is 22 MHIs (shown in Table 2), which will be about 30.5% of the total MHIs of the Karnataka State.
3.2 Design of SES survey instrument
Considering the frequency of the components appeared in the previous studies by various researchers and based on the results that emerged in the brainstorming session conducted with many safety professionals, a draft questionnaire was designed considering the following main safety engineering systems components.
Table 2. Selection of sampling data based on Manufacturing Process and Number of Major Hazardous Industries (MHIs)
|
Industrial Sector |
Total No. of Units (MHIs) |
No. of Sample Units (MHIs) |
percentage |
|
LPG Bottling |
24 |
5 |
17 |
|
Automobiles (manufacturing industries) |
7 |
5 |
71 |
|
Receipt, storage, and distribution of petroleum products |
11 |
1 |
9 |
|
Manufacturing and printing of a newspaper |
2 |
2 |
100 |
|
Bulk drugs and pharmaceuticals |
4 |
1 |
25 |
|
Industrial gases |
3 |
3 |
100 |
|
Steel manufacturing |
4 |
1 |
25 |
|
Manufacture of chemicals & fertilizers |
4 |
1 |
25 |
|
Refining of crude into various POL products |
1 |
1 |
100 |
|
Others (product manufacturing industries) |
12 |
2 |
17 |
|
Total |
72 |
22 |
30.5 |
Table 3. Demographic attributes of the industries
|
Demographic characteristic |
Range |
Number of industries |
Percentage (rounded) |
|
Size of the firm (Employment Range) |
Up to 20 |
2 |
9.09 |
|
21 to 100 |
3 |
13.63 |
|
|
101 to 500 |
4 |
18.18 |
|
|
501 to 1000 |
8 |
36.36 |
|
|
Above 1000 |
5 |
22.72 |
|
|
|
Total |
22 |
100 |
|
Cost of the project (Investment in crore) |
1 to 10 |
2 |
9.09 |
|
11 to 25 |
2 |
9.09 |
|
|
26 to 50 |
2 |
9.09 |
|
|
More than 50 |
16 |
72.72 |
|
|
|
Total |
22 |
100 |
|
Nature of manufacturing activity |
LPG Bottling unit |
5 |
22.73 |
|
Production unit |
11 |
50.00 |
|
|
Storage & Distribution of petroleum products and industrial gases. |
5 |
22.73 |
|
|
Pharma/bulk drugs |
1 |
4.54 |
|
|
|
Total |
22 |
100 |
|
Type of hazardous substance |
LPG |
11 |
50 |
|
HSD / Naphtha/ Diesel |
1 |
4.54 |
|
|
Chlorine |
2 |
9.09 |
|
|
Others |
8 |
36.36 |
|
|
Pharmaceutical Industry |
1 |
4.54 |
|
|
|
Total |
22 |
100 |
|
Sector of industry |
Automobile Industry |
4 |
18.18 |
|
Steel Industry |
1 |
4.54 |
|
|
Printing |
1 |
4.54 |
|
|
Petroleum Products |
6 |
27.27 |
|
|
Chlorine |
2 |
9.09 |
|
|
Ammonia |
1 |
4.54 |
|
|
Industrial gases |
4 |
18.18 |
|
|
Others (IMFL Bottling) |
2 |
9.09 |
|
|
Total |
22 |
100 |
The questionnaire was designed using 5 points Likert scale, which is ranging from 1 to 5 i.e. strongly disagree to strongly agree. The questionnaire was prepared in both Kannada (local language) and English language to carry out the pilot study. The prepared questionnaire has two sections i.e., general demographic information, employee perception about SES.
The questionnaire was distributed among the 100 employees of one MHI as a pilot study to test the initial questionnaire. Based on the results of the pilot study reliability coefficient is obtained as 0.91 and 0.87 in test and retest which is more than the threshold value of 0.7. Hence, it was concluded that the questionnaire had good reliability and is tenable for statistical computation. The final questionnaire was distributed among the employees of 22 MHI in Karnataka.
3.3 Demographic characteristics
As mentioned above, the demographic profile is one of the major sections of the survey instrument. Out of 72 MHI in Karnataka, the questionnaire was distributed among the employees of 22 industries as a sample study. The information about demographics will give us the perception of SES in different firms also from employees who have a varied background of knowledge, experience in their respective profession.
3.3.1 Demographic attributes of firm
The 22 MHI’s are mainly classified firstly based on demographic attributes of the firms from which the data has been collected and they are: Size, Cost, Nature of Manufacturing, Types of hazardous substance handled, Sector to which the firm belongs. From Table 3, it is shown that major of the firms i.e., 36.36% belong to medium scale industry employees ranging from 501-1000, 72.72% are from the project where investment is more than 50 crores, 50% of them belong to the Production unit and 36.36% are from different hazardous industries.
3.3.2 Demographic profile of respondents
The valid 1029 responses from the distributed questionnaire in 22 MHI’s are categorized on the demographic characteristics like Gender, Age, Experience, Education, Nature of the job, Designation, and Department. Table 4 shows that major of the respondents are male about 95.73%, 39.32% are more than 40 years, 39.81% have more than 15 years of experience, 28.74% belong to ITI qualifications, 73.5% are from a technical background, 75.34% are workers and 57.57% are from the production department. The categorization will itself cover the perception of all employees from different backgrounds who are eligible and have adequate knowledge to judge the questions in the survey instrument and provide their opinion. According to Boyatzis et al. [24], a graduate degree helps people to have the required cognitive ability. Certain employees who have specialization in their higher graduation are considered as expert opinion though their percentage is 15.05%. Apart from proficiency suggestions the study mainly focuses on gathering the data from employees to assess the level of SES in MHI.
Table 4. Demographic characteristics of respondents
|
Demographic characteristic |
Category |
Number of respondents |
Percentage |
|
Gender |
Male |
985 |
95.73 |
|
Female |
44 |
4.27 |
|
|
|
Total |
1029 |
100 |
|
Age |
18 to 25 years |
137 |
13.30 |
|
26 to 40 years |
488 |
47.38 |
|
|
Above 40 years |
404 |
39.32 |
|
|
|
Total |
1029 |
100 |
|
Experience |
1 to 5 years |
218 |
21.17 |
|
6 to 15 years |
402 |
39.03 |
|
|
More than 15 years |
409 |
39.81 |
|
|
|
Total |
1029 |
100 |
|
Education |
Post Graduate |
154 |
15.05 |
|
Graduate |
309 |
30.00 |
|
|
Under Graduate |
58 |
5.63 |
|
|
Diploma |
109 |
10.58 |
|
|
ITI |
296 |
28.74 |
|
|
Others |
103 |
10.00 |
|
|
|
Total |
1029 |
100 |
|
Nature of the job |
Technical |
756 |
73.5 |
|
Non-Technical |
273 |
26.5 |
|
|
|
Total |
1029 |
100 |
|
Designation
|
Worker |
776 |
75.34 |
|
Supervisor /Manager |
205 |
20.00 |
|
|
Total |
1029 |
100 |
|
|
Department |
Production/process |
592 |
57.57 |
|
Maintenance |
176 |
17.08 |
|
|
Safety Department |
70 |
6.79 |
|
|
Others |
191 |
18.54 |
|
|
|
Total |
1029 |
100 |
4.1 Exploratory Factor Analysis
The Exploratory Factor Analysis (EFA) using SPSS Version 24 software, was conducted for identifying the underlying dimensions of SES. Before the extraction of the components, the following tests were conducted to examine the adequacy of the sample and the suitability of data for factor analysis [25].
Table 5. KMO and Bartlett's Test of safety engineering systems data
|
KMO and Bartlett's Test |
Value |
|
Kaiser-Meyer-Olkin Measure of Sampling Adequacy |
0.97 |
|
Bartlett's Test of Sphericity |
37659.369 |
|
Degree of freedom |
1326 |
|
Significance |
0.00 |
4.1.1 KMO and Bartlett's Test
From Table 5, it is seen that the Kaiser-Meyer-Olkin (KMO) measure of sampling is 0.97 which is above the threshold value of 0.5. According to Netemeyer et al. [26], a KMO correlation above 0.60 - 0.70 is considered adequate for analyzing the EFA output. The approximate chi-square value of Bartlett's Sphericity test is significant and ensured there are correlations among the items selected to run factor analysis.
4.1.2 Extraction method: Principal axis factor with Oblimin rotation
The Principal Axis Factor (PAF) analysis with Oblimin rotation was used as a measure to find out the factorability of 53 items of 14 components of SES data. According to the K1 - Kaiser’s [27] method, only constructs that have the eigenvalues greater than one should be retained for interpretation. Besides, the factor loading value above 0.4 are considered which all reduce to 37 items which are categorized relevantly under six critical components named-
1. Safety Management system (SES1)
2. Accident Relief and Rehabilitation System (SES2)
3. System for Safety Maintenance. (SES3)
4. System for Safety Preparedness (SES4)
5. Safety Communication system (SES5)
6. Safety Monitoring System (SES6)
Table 6. Summary of EFA analysis
|
Items * |
SES1 |
SES2 |
SES3 |
SES4 |
SES5 |
SES6 |
|
QS 8 |
0.686 |
|
|
|
|
|
|
QS 12 |
0.686 |
|
|
|
|
|
|
QS 7 |
0.679 |
|
|
|
|
|
|
QS 11 |
0.612 |
|
|
|
|
|
|
QS 13 |
0.586 |
|
|
|
|
|
|
QS 9 |
0.541 |
|
|
|
|
|
|
QS 14 |
0.526 |
|
|
|
|
|
|
QS 1 |
0.496 |
|
|
|
|
|
|
QS 10 |
0.477 |
|
|
|
|
|
|
QS 5 |
0.474 |
|
|
|
|
|
|
QS 3 |
0.434 |
|
|
|
|
|
|
QS 53 |
|
0.851 |
|
|
|
|
|
QS 52 |
|
0.768 |
|
|
|
|
|
QS 51 |
|
0.744 |
|
|
|
|
|
QS 45 |
|
0.576 |
|
|
|
|
|
QS 42 |
|
0.413 |
|
|
|
|
|
QS 4 |
|
|
0.726 |
|
|
|
|
QS 33 |
|
|
0.708 |
|
|
|
|
QS 2 |
|
|
0.595 |
|
|
|
|
QS 22 |
|
|
0.492 |
|
|
|
|
QS 20 |
|
|
0.414 |
|
|
|
|
QS 34 |
|
|
0.401 |
|
|
|
|
QS 26 |
|
|
|
0.731 |
|
|
|
QS 25 |
|
|
|
0.718 |
|
|
|
QS 27 |
|
|
|
0.623 |
|
|
|
QS 37 |
|
|
|
0.513 |
|
|
|
QS 28 |
|
|
|
0.507 |
|
|
|
QS 24 |
|
|
|
0.455 |
|
|
|
QS 39 |
|
|
|
|
0.521 |
|
|
QS 23 |
|
|
|
|
0.48 |
|
|
QS 19 |
|
|
|
|
0.39 |
|
|
QS 40 |
|
|
|
|
0.378 |
|
|
QS 49 |
|
|
|
|
|
0.683 |
|
QS 31 |
|
|
|
|
|
0.556 |
|
QS 15 |
|
|
|
|
|
0.547 |
|
Eigen value |
22.567 |
2.78 |
2.19 |
1.55 |
1.452 |
1.28 |
|
Percantege of Variance |
42.58 |
4.54 |
3.28 |
2.13 |
1.97 |
1.58 |
|
Cumulative percentage |
42.58 |
47.12 |
50.4 |
52.53 |
54.5 |
56.08 |
*Factor loadings < 0.40 were not included in this table. Item is the term used to refer to a question in the survey.
Table 6 shows all the 37 items and their loadings extracted from the analysis along with the eigenvalues, the percentage of variance attributable to each, and the cumulative variance of the component and the previous found to be significant at 56.08%.
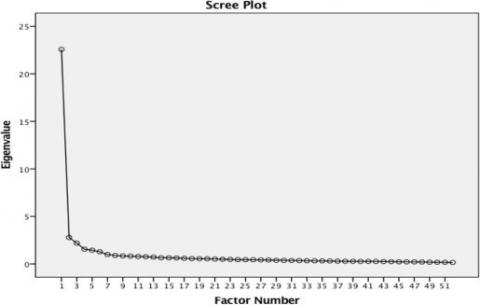
4.1.3 Scree plot
Cattell’s Scree test [28] involves the visual exploration of a graphical representation of the eigenvalues for discontinuities. The logic behind this method is that break point divides the major factors from minor or trivial factors [29]. The plot in Figure 1 has six data points above the break with the highest eigenvalues, to substantiate the number of components retained in EFA.
Figure 1. Scree plot
4.2 Scale validations- PLS-SEM
In order to confirm factors obtained from EFA, Partial Least Square Structural Equation Model (PLS-SEM) is carried out. PLS-SEM is used for exploratory research, but also appropriate for confirmatory research [30]. To assess reflective measurement models, internal consistency reliability, as well as convergent and discriminant validity, must be established. In this study, variance-based PLS-SEM is made using ‘R’ software to provide better results.
4.2.1 Internal consistency
Internal consistency of the components can be assessed from the Cronbach alpha and Dillon- Goldstein’s rho values. In Table 7, the Cronbach alpha value ranges from 0.788-0.935 for all the components which are above the threshold value of 0.697 [31]. The Dillon-Goldstein’s rho values are generally used for assessing composite reliability whose values range from 0.85 to 0.943 which is very well above the cut-off value of 0.70 [32].
4.2.2 Convergent validity
Convergent validity is evaluated by examining the outer loadings of the indicators to determine the Average Variance Extracted (AVE) from each component. The outer loadings should exceed 0.708 [32]. Also, AVE is a summary indicator of convergence calculated from the variance extracted for all items loading on a single component. The AVE value for the first-order components ranges from 0.467-0.614 as shown in Table 7 which is meeting the cut-off value of 0.5 [32].
4.2.3 Discriminant validity
Discriminant validity denotes that a component is empirically unique from the other components in the SEM. The discriminant validity is assessed by comparing the square root of AVE, represented across the diagonal in Table 8 must be higher than the corresponding latent variables in the respective row and column which can be seen for majority components [33].
The measurement model for each component with outer loadings is shown in Figure 2. Thus, it can be stated there are no issues related to internal validity, convergent validity, and discriminant validity for the components confirming them as the critical components needed to evaluate the SES in MHIs.
Table 7. Internal consistency and convergent validity
|
First-order SES components |
Items |
Outer loadings |
Cron Bach’s alpha |
Composite reliability |
Average Variance Extracted |
|
SES1 |
Q8 |
0.791 |
0.935 |
0.943 |
0.545 |
|
Q12 |
0.769 |
||||
|
Q7 |
0.732 |
||||
|
Q11 |
0.766 |
||||
|
Q13 |
0.788 |
||||
|
Q9 |
0.779 |
||||
|
Q14 |
0.753 |
||||
|
Q1 |
0.720 |
||||
|
Q10 |
0.748 |
||||
|
Q5 |
0.755 |
||||
|
Q3 |
0.747 |
||||
|
SES2 |
Q53 |
0.739 |
0.89 |
0.911 |
0.53 |
|
Q52 |
0.538 |
||||
|
Q51 |
0.721 |
||||
|
Q45 |
0.821 |
||||
|
Q42 |
0.749 |
||||
|
Q32 |
0.77 |
||||
|
SES3 |
Q4 |
0.621 |
0.788 |
0.85 |
0.467 |
|
Q33 |
0.710 |
||||
|
Q2 |
0.466 |
||||
|
Q22 |
0.619 |
||||
|
Q20 |
0.815 |
||||
|
Q34 |
0.804 |
||||
|
SES4 |
Q26 |
0.801 |
0.923 |
0.935 |
0.591 |
|
Q25 |
0.773 |
||||
|
Q27 |
0.787 |
||||
|
Q37 |
0.744 |
||||
|
Q28 |
0.802 |
||||
|
Q24 |
0.782 |
||||
|
SES5 |
Q39 |
0.755 |
0.895 |
0.918 |
0.614 |
|
Q23 |
0.753 |
||||
|
Q19 |
0.803 |
||||
|
Q40 |
0.85 |
||||
|
SES6 |
Q49 |
0.692 |
0.825 |
0.873 |
0.534 |
|
Q31 |
0.588 |
||||
|
Q15 |
0.791 |
||||
|
Q50 |
0.767 |
Table 8. Correlation matrix and the square root of AVE
|
|
SES1 |
SES2 |
SES3 |
SES4 |
SES5 |
SES6 |
|
SES1 |
0.74 |
|
|
|
|
|
|
SES2 |
0.783 |
0.73 |
|
|
|
|
|
SES3 |
0.622 |
0.561 |
0.68 |
|
|
|
|
SES4 |
0.823 |
0.702 |
0.577 |
0.77 |
|
|
|
SES5 |
0.838 |
0.732 |
0.612 |
0.841 |
0.78 |
|
|
SES6 |
0.788 |
0.746 |
0.579 |
0.726 |
0.767 |
0.73 |
Figure 2. Measurement model
The operational definition of the six critical components is given for the policymakers and organizations to include these factors during risk assessment.
Safety management system (SES1): is management intended to bring about safety elements in the workplace. It includes policy, objectives, plans, procedures, organizational structures, accountabilities, responsibilities, and other measures to eliminate the risk of dangerous occurrences.
Accident relief and rehabilitation system (SES2): is providing suitable relief and rehabilitation systems for the accident victims, heirs of the deceased, by providing suitable compensation, alternate employment, etc., to the victims or their families. Also, it includes controlling the rehabilitation of affected areas and procedures for rehabilitation at the end of the emergency with instructions for re-entering the accident area.
System for safety maintenance (SES3): is defined as a combination of all technical and organizational activities required to keep equipment, installations, and other physical assets in the desired operating condition or restore them.
System for safety preparedness (SES4): is forecasting and taking precautionary measures before an imminent threat when warnings are possible. It is safety systems that provide the tools, equipment, and personnel to meet any emergencies arising during the course of work either on-site or off-site emergencies. Health and safety policy are in place in the company. Remedial actions are taken immediately after the accident/ incident in the company.
Safety communication system (SES5): includes direct and indirect communication, motivation to do the job safely, providing suitable training on hazards, and remedial measures. Workers are educated about the imminent dangers of chemicals used in the factory. Material safety data sheets are displayed for all chemicals in the factory premises.
Safety monitoring system (SES6): This system helps in monitoring the total safety systems such as providing tools and equipment, proper supervision, reporting of accidents, near misses, etc. Air monitors, smoke detectors, and noise control monitor optimum functionality. The company conducts ergonomics studies and monitors to prevent any workplace injuries.
The present study is providing a valid scale for the evaluation of the critical concept of safety engineering systems in the organizations to elevate the overall safety standards. A survey instrument was developed and validated through data collection from 1029 respondents through convenience sampling in 22 MHIs in Karnataka. After using exploratory factor analysis and PLS-SEM the reliability and validity of the instrument were achieved with six critical components. The components also focused on post-accident treatment as the occurrence accidents are inevitable and an equal importance must be given to assess the measure taken after any unforeseen situation.
Much previous work has focused on human failures and organizational factors [34]. This statement can only be based on the theory that working conditions have enhanced to a large degree owing to modern technologies and equipment and the presence of stricter regulations. However, these improvements have not yet been substantiated to show much effectiveness, which can do so by increasing the evaluation of system safety factors. It is also stated that the non-occurrence of an accident over some time does not necessarily be an indication that it’s safe. Without proper vigilance, safety systems can deteriorate and deviations from safe operating procedures can be disregarded. While studies to date have suggested that safety climate and culture may be an important aspect to focus on, the present research represents one of the few studies in the hazardous industries that have designed a scale validation. The scale has several areas that are open to further research as the study here is limited to only one state in India.
|
AVE |
Average Variance Extracted |
|
EFA |
Exploratory Factor Analysis |
|
MHI |
Major Hazardous Industries |
|
PAF |
Principal Axis Factor |
|
SEM |
Structural Equation Model |
|
SES |
Safety engineering System |
|
PLS |
Partial Least Square |
[1] Heinrich, H.W. (1941). Industrial Accident Prevention. A Scientific Approach. Industrial Accident Prevention. A Scientific Approach. Second Edition, New York & London: McGraw-Hill Book Company, Inc., pp. 1-448.
[2] Leveson, N. (2008). An introduction to system safety. ASK Magazine, 31: 20-24.
[3] Adebiyi, K.A., Charles‐Owaba, O.E. (2009). Towards setting a sustainable manufacturing safety programme in Nigeria. Disaster Prevention and Management: An International Journal, 18(4): 388-396. https://doi.org/10.1108/09653560910984447
[4] Forastieri, V. (1999). Improvement of working conditions and the environment in the informal sector through safety and health measures. Geneva: International Labour Office.
[5] Haddon-Cave, C. (2009). The Nimrod Review: an independent review into the broader issues surrounding the loss of the RAF Nimrod MR2 Aircraft XV230 in Afghanistan in 2006, report (Vol. 1025). DERECHO INTERNACIONAL.
[6] Wreathall, J. (2006). Properties of resilient organizations: an initial view. Resilience engineering concepts and precepts. In Resilience Engineering: Concepts and Precepts. Ashgate Aldershot, UK, pp. 275-286.
[7] Levitt, R.E., Parker, H.W. (1976). Reducing construction accidents—top management's role. Journal of the Construction Division, 102(3): 465-478.
[8] Hinze, J., Pannullo, J. (1978). Safety: Function of job control. Journal of the Construction Division, 104(2): 241-249.
[9] Hinze, J. (1978). Turnover, new workers, and safety. Journal of the Construction Division, 104(4): 409-417.
[10] Samelson, N.M., Levitt, R.E. (1982). Owner's guidelines for selecting safe contractors. Journal of the Construction Division, 108(4): 617-623.
[11] Hinze, J., Raboud, P. (1988). Safety on large building construction projects. Journal of Construction Engineering and Management, 114(2): 286-293. https://doi.org/10.1061/(ASCE)0733-9364(1988)114:2(286)
[12] Wilson, J.R., Neely, A.D., Aggarwal, N. (1993). Allowing for the human element: Human factors in small manufacturing enterprises. International Journal of Human Factors in Manufacturing, 3(2): 193-205. https://doi.org/10.1002/hfm.4530030208
[13] Liska, R., Goodloe, D., Sen, R. (1993). Zero Accident Techniques. Source Document 86. CIT, The University of Texas at Austin, Austin, TX.
[14] Sawacha, E., Naoum, S., Fong, D. (1999). Factors affecting safety performance on construction sites. International Journal of Project Management, 17(5): 309-315. https://doi.org/10.1016/S0263-7863(98)00042-8
[15] Aronsson, G. (1999). Contingent workers and health and safety. Work, Employment and Society, 13(3): 439-459. https://doi.org/10.1177/09500179922118024
[16] Fung, I.W., Tam, C.M., Tung, K.C., Man, A.S. (2005). Safety cultural divergences among management, supervisory and worker groups in Hong Kong construction industry. International Journal of Project Management, 23(7): 504-512. https://doi.org/10.1016/j.ijproman.2005.03.009
[17] Bahr, N.J. (2014). System Safety Engineering and Risk Assessment: A Practical Approach. CRC Press.
[18] Aksorn, T., Hadikusumo, B.H.W. (2008). Critical success factors influencing safety program performance in Thai construction projects. Safety Science, 46(4): 709-727. https://doi.org/10.1016/j.ssci.2007.06.006
[19] Tang, D.K.H., Leiliabadi, F., Olugu, E.U. (2017). Factors affecting safety of processes in the Malaysian oil and gas industry. Safety Science, 92: 44-52. https://doi.org/10.1016/j.ssci.2016.09.017
[20] Alexander, D., Hallowell, M., Gambatese, J. (2017). Precursors of construction fatalities. I: Iterative experiment to test the predictive validity of human judgment. Journal of Construction Engineering and Management, 143(7): 04017023. https://doi.org/10.1061/(ASCE)CO.1943-7862.0001304
[21] Pereira, E., Hermann, U., Han, S., AbouRizk, S. (2018). Case-based reasoning approach for assessing safety performance using safety-related measures. Journal of Construction Engineering and Management, 144(9): 04018088. https://doi.org/10.1061/(ASCE)CO.1943-7862.0001546
[22] Yiu, N.S., Chan, D.W., Shan, M., Sze, N.N. (2019). Implementation of safety management system in managing construction projects: Benefits and obstacles. Safety Science, 117: 23-32. https://doi.org/10.1016/j.ssci.2019.03.027
[23] Flin, R., Mearns, K., O'Connor, P., Bryden, R. (2000). Measuring safety climate: identifying the common features. Safety Science, 34(1-3): 177-192. https://doi.org/10.1016/S0925-7535(00)00012-6
[24] Boyatzis, R., Boyatzis, R.E., Saatcioglu, A. (2008). A 20‐year view of trying to develop emotional, social and cognitive intelligence competencies in graduate management education. Journal of Management Development, 27(1): 92-108. https://doi.org/10.1108/02621710810840785
[25] Burton, L.J., Mazerolle, S.M. (2011). Survey instrument validity part II: Validation of a survey instrument examining athletic trainers' knowledge and practice beliefs regarding exertional heat stroke. Athletic Training Education Journal, 6(1): 36-45. https://doi.org/10.4085/1947-380X-6.1.36
[26] Netemeyer, R.G., Bearden, W.O., Sharma, S. (2003). Scaling procedures: Issues and applications. Sage Publications.
[27] Kaiser, H.F. (1960). The application of electronic computers to factor analysis. Educational and Psychological Measurement, 20(1): 141-151. https://doi.org/10.1177/001316446002000116
[28] Cattell, R.B. (1966). The scree test for the number of factors. Multivariate Behavioral Research, 1(2): 245-276. https://doi.org/10.1207/s15327906mbr0102_10
[29] Ledesma, R.D., Valero-Mora, P. (2007). Determining the number of factors to retain in EFA: An easy-to-use computer program for carrying out parallel analysis. Practical Assessment, Research, and Evaluation, 12(1): 1-11.
[30] Hair Jr, J.F., Matthews, L.M., Matthews, R.L., Sarstedt, M. (2017). PLS-SEM or CB-SEM: Updated guidelines on which method to use. International Journal of Multivariate Data Analysis, 1(2): 107-123. https://doi.org/10.1504/IJMDA.2017.087624
[31] Nunnally, J.C., Bernstein, I.H. (1978). The role of university in the development of entrepreneurial vocations: A Spanish study. Psychometric Theory. McGraw-Hill New York.
[32] Henseler, J., Dijkstra, T.K., Sarstedt, M., Ringle, C.M., Diamantopoulos, A., Straub, D.W., Ketchen, Jr., D.J., Hair, J.F., Hult, G.T.M., Calantone, R.J. (2014). Common beliefs and reality about partial least squares: Comments on Rönkkö and Evermann. 17(2): 182-209. https://doi.org/10.1177/1094428114526928
[33] Hair Jr, J.F., Black, W.C., Babin, B.J., Anderson, R.E. (2006). Multivariate Data Analysis. Prentice Hall.
[34] Mitropoulos, P., Abdelhamid, T.S., Howell, G.A. (2005). Systems model of construction accident causation. Journal of Construction Engineering and Management, 131(7): 816-825. https://doi.org/10.1061/(ASCE)0733-9364(2005)131:7(816)