Guglielmina Mutani* | Valeria Todeschi
© 2021 IIETA. This article is published by IIETA and is licensed under the CC BY 4.0 license (http://creativecommons.org/licenses/by/4.0/).
OPEN ACCESS
Green urban infrastructures have a significant impact on urban climate mitigation, on indoor and outdoor thermal comfort and on energy performance of buildings. In this paper, outdoor thermal comfort conditions and energy saving for space heating and cooling were investigated before and after the use of roof-integrated green technologies. Existing urban energy and climate models and tools were applied to an urban area located in a Turin (Italy). CitySim, ENVI-met and SOLWEIG tools and a GIS-based model were used to evaluate the mean radiant temperature and the thermal comfort of outdoor spaces before and after the use of vegetated roofs and green surfaces such as the predicted mean vote (PMV), the physiological equivalent temperature (PET) and the universal thermal climate index (UTCI). A GIS-based engineering model and CitySim tool were used to evaluate the energy saving and energy independence index for space heating and cooling after the use of green roofs and solar technologies. According to the shape and the suitability of rooftop elaborated with GIS tools, some roofs were identified as potential green roofs other as potential solar roofs for installing solar thermal collectors and photovoltaic panels. According to the results it is possible to confirm that the use of green roofs and urban greenery can decrease the mean radiant temperature until about 10℃ during summer season, improving outdoor thermal comfort conditions and energy savings with a reduction of 12% for space cooling energy consumption.
smart green technologies, green roof, solar roof, thermal comfort conditions, urban local climate, energy savings, urban planning, sustainable cities
Global warming and climate change have a significant impact on the quality and liveability of cities, especially in urban environments [1]. The urban heat island (UHI) effect has a fundamental impact on urban microclimate, which influences urban air quality and energy-use of buildings especially during the summer season [2]. Over the years these problems have become increasingly impactful. Given that more than 50% of the world population lives in urban areas, it is essential to design sustainable urban spaces improving energy independence and urban resilience. The goal is to combat global warming and extreme heat events due to urbanization and greenhouse gas emissions with an increase of renewable energy and green technologies [3].
Compact and vertical cities are considered to be more energy-efficient and a solution to decrease the land use. The retrofitting of the roofs can lead to a multitude of potential uses such as vegetated spaces and solar energy production [4]. Smart green technologies should be promoted at building and urban level as a solution to reduce the impacts of urbanization and industrialization on cities [5]. Different urban forms [6] and different materials [7] used for outdoor surfaces affect urban local climate and thermal comfort conditions. For example, cold or cool materials with high reflectance, are often proposed as a solution to mitigate UHI effect [8]. Also green urban infrastructures make urban environments less thermally stressful improving thermal comfort: trees, green roofs, and vegetation can mitigate UHI effects by shading building surfaces, deflecting radiation from the sun, and with the evapotranspiration effect [9, 10]. Greening plays a major role in mitigating the local climate, directly impacting the outdoors thermal comfort of city pedestrians, as well as reducing the energy demand of buildings. More precisely, the vegetation decreases the short and long wave radiation fluxes impinging on the urban surfaces, and reduces the outdoor air temperature by 2℃ to 6℃ depending on the plant species and their location [11, 12]. Trees have a positive impact on the outdoor human thermal comfort, by the cooling effect of the evapotranspiration phenomenon, mitigating the local climate, providing shading effect, and wind resistance [13].
The aim of this work is to investigate outdoor thermal comfort conditions and energy consumption in an urban environment by identifying measures to improve urban environments livability, energy savings and energy independence. Taking into account local climate conditions, building shape and urban form of a district in Turin (IT), smart green technologies have been investigated: cold surfaces, green roofs and solar roofs (solar thermal collectors and photovoltaic panels). In the following sections, are presented: the effect of green infrastructures on thermal comfort and energy savings (Section 2); the methodology and the description of data, models and tools used at district scale (Section 3); the case study and the main results obtained; the future work and conclusions (Section 5).
Green urban infrastructures can be classified into two categories: public, associated to an urban public space (green canopies, green permeable systems, green pavements, and bio-retention areas), and private, related to a building component (green roofs and green walls) [14].
The environmental, social, and economic benefits of green urban infrastructure are extensively recognized [15]. Urban greenery provides a space for city workers and dwellers to relax and enjoy. It can improve the quality of life, healthiness, sustainability of urban spaces, and can decrease the atmospheric pollution and greenhouse gas (GHG) emissions with the control of dust and improve the urban quality. Urban greenery also has a psychological effect on inhabitants, activating economic and social actions, reducing crime, and upgrading productivity and creativity [16].
New green roofs and walls improve buildings performance with a significant reduction in energy consumptions by reducing the absorption of solar radiation and mitigating UHI effect. The main advantages concern the contribution to thermal insulation, acoustic insulation, ecological preservation, mitigation of summer temperatures, attenuation of rainwater runoff and an aesthetic improvement of the property increasing building value [17-21].
2.1 Outdoor thermal comfort conditions
A correct design and planning of buildings and urban environment is fundamental to improve liveability in cities: urban morphology (i.e. orientation and aspect ratio) significantly affect the intensity and duration of the thermal peaks; green urban infrastructures (i.e. green roofs and green surfaces) strongly improve the thermal comfort conditions and human health [22].
Thermal comfort conditions can be described by the interaction of six factors able to define the human thermal environment and sensation: ambient temperature, metabolic rate, clothing insulation, mean radiant temperature (Tmrt), wind speed and relative humidity [23]. The direct component of solar irradiation and the Tmrt are affected by urban morphology and greening and play the most important role in the outdoor thermal comfort [24].
Nowadays, there are several thermal comfort indices used to simulate human thermal perception according to local climate conditions [25]. Indices can be divided into three categories: (i) empirical indices based on thermal perception with thermal environment (i.e. actual sensation vote ‘AVS’, thermal sensation ‘TS’); (ii) thermal indices based on heat balance equation of human body (i.e. predicted mean vote ‘PMV’, standard effective temperature ‘SET’); (iii) and indices based on linear equations defining the human comfort as function of the thermal environment (i.e. apparent temperature ‘AT’, discomfort index ‘DI’, wet bulb globe temperature index ‘WBGT’) [26, 27].
In this work, the following thermal indices were investigated with the support of existing urban climate tools:
2.2 Energy-related effect of green technologies
At urban level, the urban morphology, street greening and green surfaces improve the urban local climate, which consequently affects heating and cooling energy consumptions of buildings located near vegetation and green surfaces [28].
At building level, a green roof compared to a traditional one increases energy performance and improves the energy efficiency in buildings mainly through three mechanisms [29-31]: (i) Control of solar absorption. The presence of vegetation on the external surface improves radiation exchanges and mitigates the fluctuation of temperatures by limiting the risk of summer overheating. The solar absorption of a green surface is close to 0.3, which is comparable to a cold surface (e.g. light color). (ii) Thermal inertia, heat and water vapor accumulation/release. The presence of vegetation and thick soil layer are able to accumulate heat and also humidity and release it over time allowing latent heat exchanges between the layers attenuating the cooling energy demand. (iii) Thermal insulation, the materials used to design a new green roof are able to optimize the indoor thermal conditions reducing winter and summer heat flows. Shading reduces the surface temperatures below the plants, consequently this cooler surface, reduces the heat transmitted into the building.
2.3 Urban energy and climate models and tools
The promotion of smart green technologies in cities should be supported by appropriate models and tools able to investigate the effect of these infrastructures on local climate mitigation, thermal comfort conditions and energy performance of buildings. The aim is to identify and quantify the effectiveness of planning strategies and energy policies necessary for a sustainable development of buildings, neighborhoods, districts and cities.
Following are described the existing urban models and tools used in this work to quantify the outdoor thermal comfort conditions in an urban environment:
As previous mentioned, green urban infrastructures also influence the energy performance of buildings. In this work, two existing urban energy models and tools [36] were used to simulate space heating and cooling energy consumptions to quantify their energy savings at neighborhood scale:
A fundamental tool to collect spatial information and process input data is a Geographic Information System (GIS) [41]. GIS tools (ArcGIS, ESRI) ware used to assess: (i) thermal and electrical energy consumptions at municipal scale [37, 42]; (ii) solar energy potential promoting the self-sufficiency and self-consumption [43-45]; (iii) green roofs potential improving the outdoor thermal comfort conditions and energy savings [46-48]. For these place-based analyses, a territorial database (DBT) was organized in GIS creating a 3D-city model for the city of Turin (Italy) [15, 49].
In this section the input data, materials and method applied to investigate the impact of green roofs and solar energy in a densely built-up context were presented. In particular, roofs’ potential (Section 3.1) and urban energy and climate models and tools were used by analysing urban environments (Sections 3.2 and 3.3).
The main phases of this work can be summarized as follows:
3.1 Input data processing
The first step of this work was the analysis of buildings’ roof shape in order to identify the best retrofit measure: green roof or solar roof. Starting from previous work [49], a 3D-roof model for buildings was created using a GIS tool (in ArcGIS, ESRI). The main databases elaborated have been: building footprints, type of users, digital surface model (DSM), digital terrain model (DTM), digital elevation model (DEM), orthophoto, and land cover.
The slope tool in ArcGIS, was used to classify roofs as flat roofs (with slope ≤ 11°) and non-flat roofs. With the aspect tool in ArcGIS –able to evaluate the roof orientation– non-flat roofs were classified as: shed roofs, gable roofs, hipped/pyramid roofs, and half-hipped roofs. The rooftop of each building was reconstructed and classified for a district in Turin.
With the 3D-roof model, the potential roof areas for green roofs and solar roofs were identified. Some buildings were more suitable for the installation of solar technologies, other buildings were more suitable for the installation of vegetated roofs (intensive and extensive green roofs).
To assess the suitability of rooftops for green roofs the following criteria were considered: constrains and regulations (no historical buildings), roof materials and construction restrictions (no tiled roofs), roof areas (area ≥ 100 m2), shadow effects (hours of sun > 3 h), roof slope (0° ≤ slope < 20°). Therefore, from this type of analysis, green roofs potential was assessed by identifying intensive and extensive green roofs.
While, to assess the suitability of rooftops for the installation of ST collectors and PV panels the following criteria were considered: constrains and regulations (no historical buildings), roof materials and construction restrictions (no disturbing elements), roof areas (≥ 50 m2), roof orientation (no North orientation), roof slope (20° ≤ slope < 45°), good annual solar radiation (> 1,200 kWh/m2/y). After the identification of potential solar area for each building, the incident cumulative solar irradiation with monthly detail was calculated using the area solar radiation tool in ArcGIS taking into account local climate conditions (atmosphere transparency ‘τ’ and ratio of diffuse radiation to global radiation ‘ω’).
Efficiency that varies between 43% and 75% was calculated for ST collectors and an average system performance was considered equal to 75%; while PV panels used in this analysis have an efficiency of 15% –to characterize a medium quality panel of a polycrystalline photovoltaic panel– and an average system performance was considered equal to 75%.
The ST collectors' potential area was dimensioned in order to not have an overproduction of DHW during summertime (i.e. June and July); while the dimension of installed PV power depends on a cost-benefits analysis (e.g. investment and energy costs and on the energy production revenues).
3.2 Urban energy models and tools
Residential energy consumption for space heating and DHW with monthly detail were simulated for a district with a dimension of 1 km x 1 km. The simulation was done using a GIS-based engineering model [50, 51] able to predict thermal consumption at district level. Space heating and DHW consumptions were simulated from October 15th, 2012 to April 15th, 2015.
Regarding non-residential sector (commercial, public and industrial), thermal energy consumption for space heating and DHW were assessed according to the literature [52] applying bottom-up and top-down models. Annual thermal consumptions were distributed during months according to the number of days and the temperature gradients between indoor and outdoor air temperature.
Energy consumption for space cooling was simulated for residential and non-residential sectors. CitySim engineering tool was also used to calculate the space cooling energy consumption of the 2015 summer season with hourly detail.
Knowing that a typical Turin family consumes about 2,049 kWh/year [53], the electricity consumption for residential users was quantified using the Istat census database (2011 update); while non-residential electricity consumption was simulated, considering measured data and taking into consideration the number of working and non-working days in a year, distinguishing the type of building.
After the energy simulations for space heating, space cooling and electrical consumption, the effect of PV panels, ST collectors and vegetated roofs on energy performance, self-consumption and energy self-sufficiency was assessed. The energy savings for space heating and cooling was quantified before and after the retrofit intervention of vegetated roofs.
3.3 Urban climate tools
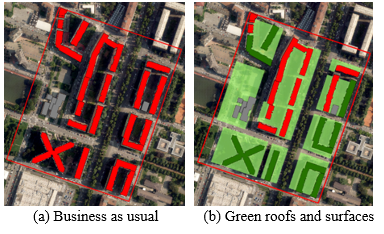
Existing urban climate tools were used to investigate outdoor thermal comfort conditions in the case-study area. In the analysed district, a smaller site was selected (Figure 1) and two scenarios were investigated: (a) the business as usual SBAU with standard insulated roof in red, and (b) the installation of roof-integrated green technologies with standard insulated roof in red, green roof with a substrate of 10 cm in dark green and the use of cold or cool surfaces in light green in the courtyards (SGREEN).
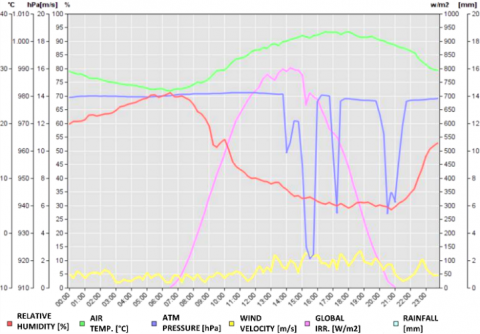
The simulation was done taking into account the local climate conditions of one of the warmest days of the years 2014 and 2015: August 7th, 2015 (Figure 2): the average daily temperature was 31.4℃, with a daily solar irradiation of 6,680 (Wh/m2/day). The air temperature reaches its maximum values between 5 and 6 p.m., with 36.5℃. The wind speed is quite constant, with a maximum of 2.7 m/s and a minimum of 0.4 m/s, and the air relative humidity varies between 30 and 70%.
The analysis was done using ENVI-met and SOLWEIG. In ENVI-met thermal comfort indices (PMV/PPD, PET, UTCI, and SET) were calculated at 1 meter above the ground (this software does not consent a major accuracy of this height) for a grid of 10 x 10 meters considering the following data (ISO 7730:2005):
In SOLWEIG, PET and UTCI thermal indices were simulated using the same human body parameters, clothing insulation and metabolic rate used in ENVI-met, but the urban environment was described with a DSM and a DEM with a precision of 1 meter.
Figure 1. The two scenarios of roof retrofit intervention
Figure 2. Local climate data for a typical summer day: August 7th, 2015
Additional simulations were conducted using CitySim, to compute the Tmrt on a 10 x 10 meters grid, using 1.5 meter high virtual pedestrians, modeled according to ref. [53]. CitySim’s model provides the longwave exchanges within the model (including the buildings), as well as the evapotranspiration of the green surfaces.
However, the air temperature, relative humidity, and wind speed and direction are assumed constant within the area. The nebulosity, which was not available in the input data, was assumed constant (4 Octas), even if this parameter was shown to greatly influence the results of the CitySim model [54].
The results include the comparison of the Tmrt computed by CitySim, ENVI-met, SOLWEIG and GIS-based model analyzed for the selected hot summer day, distinguishing two scenarios of retrofit intervention for the buildings’ roofs (SBAU and the SGREEN).
The urban climate tools simulate the Tmrt (in K) according to Eq. (1) [55].
$T_{m r t}=\sqrt[4]{\frac{\sum_{i=1}^{6} W_{i} \cdot\left(a_{p} \cdot K_{i}+a_{l} \cdot L_{i}\right)}{a_{l} \cdot \sigma}}$ (1)
where:
The Tmrt (in K) was also calculated with a GIS-based approach according to Eq. (2), that is a method used in CityComfort+ to simulate the spatial variation of the Tmrt in urban environment [56]. The input data were elaborated with GIS tools in order to simplify the simulation (i.e. using some urban variables such as the SVF and H/W).
$T_{m r t}=\sqrt[4]{\frac{\left(a_{p} \cdot E_{\text {sol }} \cdot F_{\text {sol } \rightarrow p}+\varepsilon_{s k y} \cdot E_{s k y} \cdot F_{s k y \rightarrow p}+\varepsilon_{\text {urb }} \cdot E_{\text {urb }} \cdot F_{\text {urb } \rightarrow p}\right)}{\sigma}}$ (2)
where:
$E_{s k y}=\sum_{i=1}^{n} a_{l} \cdot \varepsilon_{p} \cdot \sigma \cdot\left(T_{s k i n}^{4}-T_{s k y}^{4}\right)$ (3)
where:
$E_{u r b}=\frac{\sum_{i=1}^{n}\left(\varepsilon_{i} \cdot \sigma \cdot T_{s}^{4}+\left(1-\varepsilon_{i}\right) \cdot \varepsilon_{i} \cdot \sigma \cdot T_{a e}^{4}\right) \cdot F_{i}}{\sum_{i=1}^{n} F_{i}}$ (4)
where:
The selected equations 1 and 2 for the calculation of the Tmrt allow considering separately the contributions of short- and long-wave radiations which have different absorption coefficients and therefore weights.
Starting from a previous work [49], it is emerged that in the city of Turin there is a significant potential of roofs to be retrofitted into vegetated roofs or solar roofs. Smart green technologies such as green roofs and surfaces, photovoltaic panels and solar thermal collectors can contribute positively to liveability and quality of life in urban environments by promoting a sustainable and resilient development of cities [60]. In this work, the impact of smart green technologies on energy saving in the buildings’ sector and the thermal comfort conditions in urban environment were analyzed at territorial scale for a district in Turin with a dimension of 1 km x 1 km. According to a previous research [46], the critical areas with the highest energy consumptions and GHG emissions were identified as priority areas for the installation of vegetated roofs to mitigate the UHI. Other areas in which there are mainly residential buildings, were considered for the installation of solar technologies.
In the following subsections were described the methodology applied to a case study, the main results on energy saving after the use of vegetated roofs and the solar energy production, the output of outdoor thermal comfort simulations with the comparison between three tools by evaluating thermal indexes.
4.1 Case study
The analysis was carry out in ‘Pozzo Strada’ district (in Turin, Italy), an urban area with a dimension of 1 km x 1km and a population of 21,520 inhabitants. The roofs of over 700 buildings were characterized and classified referring to a 3D-roof model.
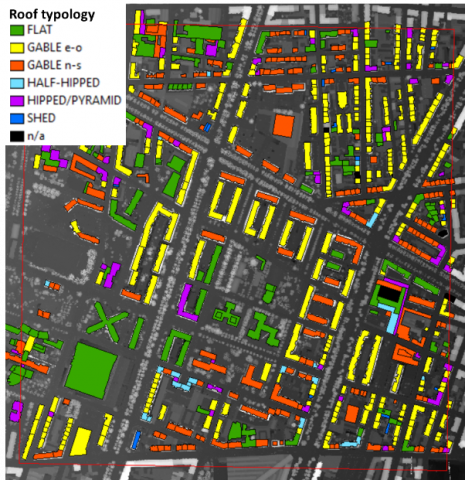
Figure 3. Roof classification
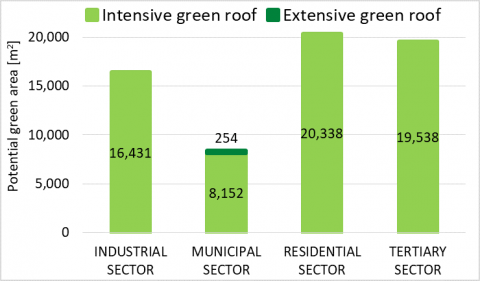
Figure 4. Analysis results of the potential intensive (flat roof) and extensive (pitched roof) green roofs
From the 3D-roofs analysis it is emerged that 79% of buildings were residential and a large quota of them has an optimal orientation for solar energy production (East-West). According to Figure 3, roofs were classified in six typologies, a significant quota equal to 70% refers to gables roofs (typical for residential buildings in Turin), 17% of buildings have flat roofs and the remaining part (13%) was composed by shed, half-hipped and hipped/pyramid roofs.
Figure 4 shows the total area (m2) of flat roofs identified as potential is equal to 64,458 m2, and pitched roofs’ area with a slope less than 20° representing a small quota of 254 m2.
The social effect of green roofs is not included in this study but is interesting to underline that the creation of green roofs can be integrated in the urban farming concept, as well as in the creation of “park roof” (e.g. playgrounds) dedicated to social activities.
4.2 Energy saving assessment
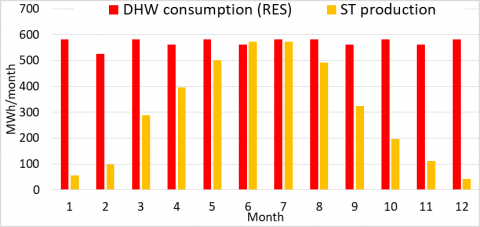
The monthly results on energy consumption and production after the installation of solar technologies are presented in Figures 5 and 6. The ST collectors were dimensioned according to the residential DHW consumption. ST collectors cover on average 53% of DHW consumption.
From Figure 5 it is possible to observe that in June and July the self-consumption reaches about 100%, while in December and January ST production covers around 10% of residential consumption. As regards electricity consumption, there is an overproduction of 9 % from June to August; in this case, the quota depends on the available roof area (about 58%).
Figure 5. DHW consumption and production from ST collectors with monthly detail
Figure 6. Electrical consumption and production from PV modules with monthly detail
The potential green roofs identified are 26% of the total roof areas (249,609 m2). Thermal energy saving after the use of vegetated roofs, –calculated with the application of GIS-based engineering models– is 1,610 MWh/year, which corresponds to 1.5% of thermal consumptions of residential and non-residential buildings for space heating and DHW consumption [61]. Cooling energy saving was computed in CitySim for the area object of the comfort analysis. Considering the typical hot summer day of 7th August 2015, the cumulative energy saving for the buildings including a green roof is 14 Wh/m3gross volume (-12%).
It is important to compute the impact of the greening in the urban local climate; indeed, the presence of grass decreases the air temperature. This phenomenon has consequently an important impact on the UHI effect and the assessments of this aspect are presented in the following section.
4.3 Outdoor thermal comfort simulation
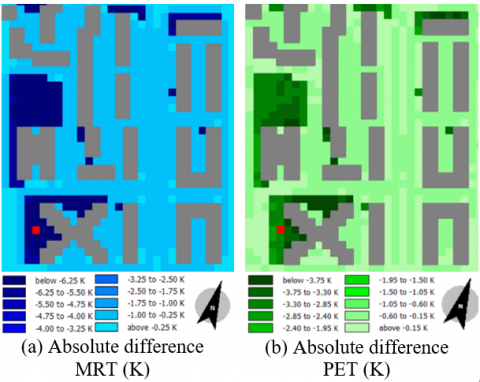
Outdoor thermal comfort conditions were assessed using existing simulation models and tools: ENVI-met, SOLWEIG, CitySim and GIS-based model. In order to quantify the effect of greening in the urban microclimate, the same area was simulated with and without the installation of green roofs and the use of green areas. The comparisons of mean radiant temperature and PET (with seated relaxed activity) shows an improvement of outdoor thermal comfort conditions due to the use of green mitigation strategies (in Figure 7). Improvements were especially visible in the new sunny green areas, while in the shaded areas the difference was minimal.
Figure 7. ENVI-met: comparison between SBAU and SGREEN at 6 pm on August 7th, 2015
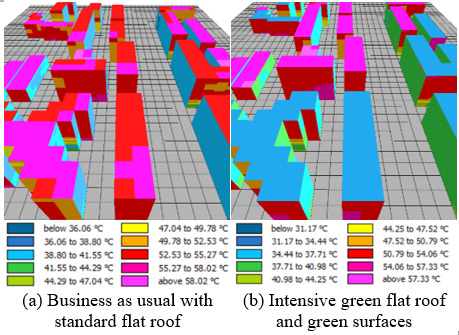
Figure 8 shows a reduction in the external surface temperature. In the scenario SBAU the temperature varies between 33.3℃ and 60.8℃, while in the scenario SGREEN the lower temperature of the grass surfaces corresponds to 27.9℃. Indeed, the grass temperature follows the air temperature path but taking into account the evapotranspiration process. Finally, the reduction of the outdoor surface temperature of the roof affects the internal surface temperature and then comforts conditions resulting also in energy savings for space cooling.
Figure 9 shows an example of the hourly results for a building: outdoor roof surface temperature Troof (SBAU and SGREEN), external air temperature (Tae) and global solar irradiance. The impact that can be seen is extremely important in the fight against climate changes (e.g. IPCC projections for 2050 and 2100) and against the increase of summer hot events.
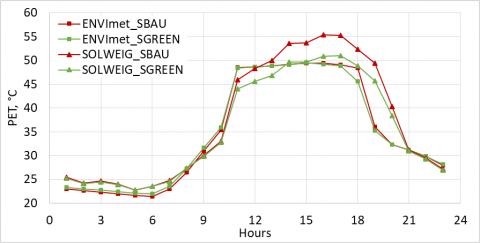
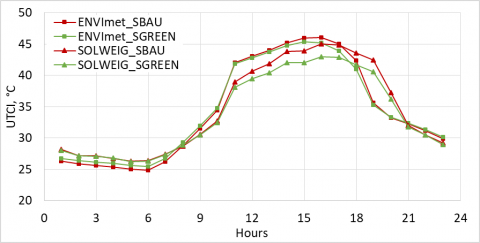
Figures 10 and 11 show PET (℃) and UTCI (℃) indexes calculated in ENVI-met and SOLWEIG on August 7th, 2017 (with hourly precision) for a single point indicated in Figure 7 (red point).
In general, it is possible to observe an improvement in comfort conditions with green surfaces also at pedestrian level. Regarding PET index, the results of two urban climate tools were very close: SOLWEIG perceives a greater difference between the two scenarios SBAU and SGREEN with a maximum PET difference of 4.5℃ at 4 pm; in ENVI-met there was a max PET difference of 2.8℃ at 6 pm. For both scenarios maximum PET values were reached between 3 pm and 5 pm. Similar trend can be observed for UTCI index, where the maximum UTCI difference of scenarios SBAU and SGREEN was 2℃ at 5 pm in SOLWEIG and 1.4℃ at 4 pm in ENVI-met.
Figure 8. ENVI-met: Temperature of buildings’ surfaces at 1 pm on August 7th, 2015
Figure 9. ENVI-met: comparison of external roof temperature between scenarios SBAU and SGREEN on August 7th, 2015
Figure 10. ENVI-met and SOLWEIG: comparison between SBAU and SGREEN on August 7th, 2015 for the red point indicated in Figure 7
Figure 11. ENVI-met and SOLWEIG: comparison between SBAU and SGREEN on August 7th, 2015 for the red point indicated in Figure 7
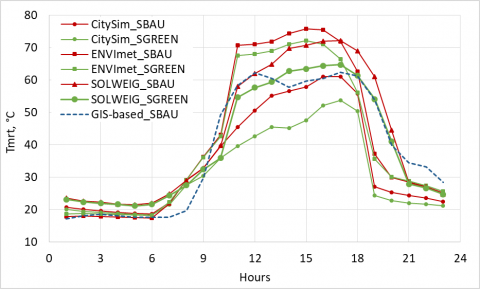
Figure 12. ENVI-met, SOLWEIG, CitySim and GIS-based model: comparison between SBAU and SGREEN on August 7th, 2015 for the red point indicated in Figure 7
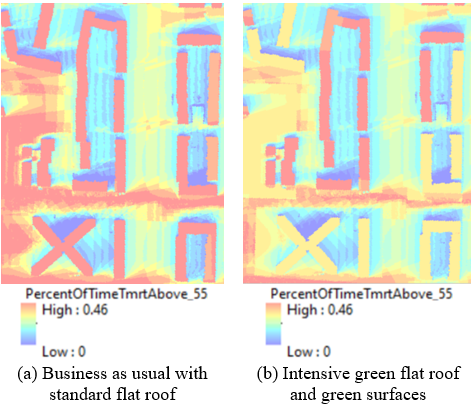
Figure 13. SOLWEIG: percentage of time in which Tmrt is above 55℃ base on 24 hours for August 7th, 2015
ENVI-met, SOLWEIG, CitySim ab GIS-based model results were compared using the hourly profile of the Tmrt. Figure 12 shows the Tmrt (℃) comparison for August 7th, 2015 distinguishing the two scenarios on a specific point indicated in Figure 7.
The results of Tmrt, computed by the three software and the GIS-based model (only for scenario SBAU) were within similar temperature range. ENVI-met simulated higher values at midday (about +15℃) compared to CitySim and GIS-based model, while SOLWEIG simulates intermediate values; this result is consistent with previous studies [62]. The difference between the two scenarios was also of similar magnitude, but with CitySim a greater difference between the two scenarios at midday can be observed. The effect of the thermal inertia seems also more significant in CitySim, where the difference between the two scenarios is still noticeable later in the evening. In this work, no calibration or confrontation with measured values has been conducted. However, it is important to notice that simulations conducted using two different validated models both show an appreciable reduction of the Tmrt thanks to the proposed intervention scenario SGREEN. Future investigations will be made to implement the GIS-based model.
Figure 13 shows statistical maps elaborated in SOLWEIG, for both scenarios, that indicates the percentage of time in which the Tmrt was above 55℃ based on the whole analysis time (24 hours for August 7th, 2015).
It is possible to see a reduction in percentage after the installation of green roofs and the use of green surfaces (from 46% to 33%). This type of map can be used to identify critical areas under thermal heat stress.
To promote a sustainable and resilient development of cities, there is no one solution, but different low-carbon strategies and smart green technologies can be used in the different urban environments.
The methodology presented in this work evaluates the solar potential energy on the building’s roofs, the existing and potential green roofs, and the relationship between the local climate and the new vegetated areas. This analysis is useful to discover the effect of smart green technologies to reduce dependence on energy from hydrocarbons and fossil fuels harnessing solar energy, and the impact of green roofs and green surfaces on urban microclimate improving thermal comfort and energy savings. From the results, it is emerged that the use of green technologies can improve liveability and quality of a district in Turin.
Further developments on this topic will be investigated, and other green mitigation strategies and smart technologies will be assessed. Thanks to the proposed methodology, it is possible to create a trans-urban ecological network through the cities in Italy, providing a comprehensive GIS map of the territory. The purpose is to implement GIS-based models, evaluating the effect of green surfaces on urban comfort. In further works the effect of evapotranspiration will be evaluated in GIS by implementing the engineering model.
Finally, it is evident the need of bringing the research into practice, creating an interface, in collaboration with the cities, where architects, engineers and urban planners can access and download the data, using the results as support for their projects. The goal is to provide a platform to help urban planners and policy makers to find effective solutions for sustainable cities and smart energy systems.
The authors would like to thank Silvia Coccolo an architect at the Galerie St François (Lausanne, Switzerland) for her help in the investigation of the effect of vegetated roofs, and Jérôme H. Kämpf and Giuseppe Peronato, respectively senior scientist and postdoctoral researcher at the Idiap Research Institute (Martigny, Switzerland), for their help with the simulations in CitySim.
[1] McCarthy, M.P., Best, M.J., Betts, R.A. (2010). Climate change in cities due to global warming and urban effects. Geophysical Research Letters, 37(9). https://doi.org/10.1029/2010GL042845
[2] Elwy, I., Ibrahim, Y., Fahmy, M., Mahdy, M. (2018). Outdoor microclimatic validation for hybrid simulation workflow in hot arid climates against ENVI-met and field measurements. Energy Procedia, 153: 29-34. https://doi.org/10.1016/j.egypro.2018.10.009
[3] Ghaffarianhoseini, A., Berardi, U., Ghaffarianhoseini, A. (2015). Thermal performance characteristics of unshaded courtyards in hot and humid climates. Build Environ, 87: 154-168. https://doi.org/10.1016/j.buildenv.2015.02.001
[4] Murshed, S.M., Duval, A., Koch, A., Rode, P. (2019). Impact of urban morphology on energy consumption of vertical mobility in Asian cities-a comparative analysis with 3D city models. Urban Sci., 3(1): 4. https://doi.org/10.3390/urbansci3010004
[5] Mauree, D., Naboni, E., Coccolo, S., Perera, A.T.D., Nik, V.M., Scartezzini, J.L. (2019). A review of assessment methods for the urban environment and its energy sustainability to guarantee climate adaptation of future cities. Renewable and Sustainable Energy Reviews, 112: 733-746. https://doi.org/10.1016/j.rser.2019.06.005
[6] Nazarian, N., Fan, J., Sin, T., Norford, L., Kleissl, J. (2017). Predicting outdoor thermal comfort in urban environments: A 3D numerical model for standard effective temperature. Urban Climate, 20: 251-267. https://doi.org/10.1016/j.uclim.2017.04.011
[7] Taleghani, M., Kleerekoper, L., Tenpierik, M., Dobbelsteen, A. (2014). Outdoor thermal comfort within five different urban forms in the Netherlands. Building and Environment, 83: 65-78. https://doi.org/10.1016/j.buildenv.2014.03.014
[8] Taleghani, M., Berardi, U. (2018). The effect of pavement characteristics on pedestrians’ thermal comfort in Toronto. Urban Climate, 24: 449-459. https://doi.org/10.1016/j.uclim.2017.05.007
[9] Gatto E, Buccolieri R, Aarrevaara E, Ippolito F, Emmanuel R, Perronace L, Santiago, J.L. (2020). Impact of urban vegetation on outdoor thermal comfort: comparison between a Mediterranean city (Lecce, Italy) and a Northern European City (Lahti, Finland). Forests, 11(2): 228. https://doi.org/10.3390/f11020228
[10] Taleghani, M. (2018). Outdoor thermal comfort by different heat mitigation strategies-A review. Renew Sustain Energy, 81(Part 2): 2011-2018. https://doi.org/10.1016/J.RSER.2017.06.010
[11] Shashua-Bar, L., Pearlmutter, D., Erell, E. (2011). The influence of trees and grass on outdoor thermal comfort in a hot-arid environment. Int J Climatol, 31(10): 1498-1506. https://doi.org/10.1002/joc.2177
[12] Santamouris, M., Kolokotsa, D. (2016). Urban Climate Mitigation Techniques. Routledge, London. https://doi.org/10.4324/9781315765839
[13] Kong, L., Lau, K.K.L., Yuan, C., Chen, Y., Xu, Y., Ren, C., Ng, E. (2017). Regulation of outdoor thermal comfort by trees in Hong Kong. Sustain Cities Soc., 31: 12-25. https://doi.org/10.1016/j.scs.2017.01.018
[14] Senosiain, J.L. (2020). Urban regreeneration: Green urban infrastructure as a response to climate change mitigation and adaptation. International Journal of Design & Nature and Ecodynamics, 15(1): 33-38. https://doi.org/10.18280/ijdne.150105
[15] Todeschi, V., Mutani, G., Baima, L., Nigra, M., Robiglio, M. (2020). Smart Solutions for Sustainable Cities — The Re-Coding Experience for Harnessing the Potential of Urban Rooftops. Appl Sci., 10: 1-27. https://doi.org/10.3390/app10207112
[16] Sun, S., Xu, X., Lao, Z., Liu, W., Li, Z., Higueras García, E., He, L., Zhu, J.N. (2017). Evaluating the impact of urban green space and landscape design parameters on thermal comfort in hot summer by numerical simulation. Build Environ, 123: 277-288. https://doi.org/10.1016/j.buildenv.2017.07.010
[17] Wilkinson, S., Feitosa, R.C., Kaga, I.T., Franceschi, I.H.D. (2017). Evaluating the thermal performance of retrofitted lightweight green roofs and walls in Sydney and Rio de Janeiro. Procedia Eng., 180: 231-240. https://doi.org/10.1016/J.PROENG.2017.04.182
[18] Schindler, B.Y., Blaustein, L., Lotan, R., Shalom, H., Kadas, G.J., Seifan, M. (2018). Green roof and photovoltaic panel integration: Effects on plant and arthropod diversity and electricity production. J Environ Manage, 225: 288-299. https://doi.org/10.1016/J.JENVMAN.2018.08.017
[19] Shafique, M., Kim, R., Rafiq, M. (2018). Green roof benefits, opportunities and challenges – A review. Renew Sustain Energy Rev., 90: 757-773. https://doi.org/10.1016/J.RSER.2018.04.006
[20] Zhang, L., Liu, W., Zheng, B., Xu, A., Sun, B. (2020). Features of roof rainwater runoff pollution in a northern coastal city under the effects of multiple factors. Int J Sustain Dev Plan, 15: 431-438. https://doi.org/10.18280/ijsdp.150403
[21] D’Souza, U.J. (2014). Measuring green roof performance, a solution to sustainable urban development in the UAE. Int J Sustain Dev Plan, 9: 3. https://doi.org/10.2495/SDP-V9-N3-376-388
[22] Lobaccaro, G., Acero, J.A., Sanchez Martinez, G., Padro, A., Laburu, T., Fernandez, G. (2019). Effects of orientations, aspect ratios, pavement materials and vegetation elements on thermal stress inside typical urban canyons. Int J Environ Res Public Health, 16. https://doi.org/10.3390/ijerph16193574
[23] Fanger, P.O. (970). Thermal comfort. Analysis and Applications in Environmental Engineering. Copenhagen: Danish Technical Press.
[24] Lau, K.K.L., Lindberg, F., Rayner, D., Thorsson, S. (2015). The effect of urban geometry on mean radiant temperature under future climate change: A study of three European cities. International Journal of Biometeorology, 59: 799-814. https://doi.org/10.1007/s00484-014-0898-1
[25] Pantavou, K., Santamouris, M., Asimakopoulos, D., Theoharatos, G. (2014). Empirical calibration of thermal indices in an urban outdoor Mediterranean environment. Build Environ, 80: 283-292. https://doi.org/10.1016/j.buildenv.2014.06.001
[26] Coccolo, S., Kämpf, J., Scartezzini, J.L., Pearlmutter, D. (2016). Outdoor human comfort and thermal stress: A comprehensive review on models and standards. Urban Clim, 18: 33-57. https://doi.org/10.1016/J.UCLIM.2016.08.004
[27] Epstein, Y., Moran, D.S. (2006). Thermal comfort and the heat stress indices. Ind Health, 44: 388-398. https://doi.org/10.2486/indhealth.44.388
[28] Huang, K.T., Li, Y. (2017). Impact of street canyon typology on building’s peak cooling energy demand: A parametric analysis using orthogonal experiment. Energy Build, 154. https://doi.org/10.1016/j.enbuild.2017.08.054
[29] Gagliano, A., Nocera, F., Detommaso, M., Evola, G. (2016). Thermal behavior of an extensive green roof: Numerical simulations and experimental investigations. International Journal of Heat and Technology, 34(S2): S226-S234. https://doi.org/10.18280/ijht.34S206
[30] Joshi, V.V. (2020). Heat transfer characterization of test rooms with six different roofs. Int J Heat Technol, 38: 131-136. https://doi.org/10.18280/ijht.380114
[31] Kazemi, M., Courard, L. (2020). Modelling thermal and humidity transfers within green roof systems: Effect of rubber crumbs and volcanic gravel. Adv Build Energy Res. https://doi.org/10.1080/17512549.2020.1858961
[32] Lindberg, F., Grimmond, C.S.B. (2011). The influence of vegetation and building morphology on shadow patterns and mean radiant temperatures in urban areas: Model development and evaluation. Theor Appl Climatol. 105. https://doi.org/10.1007/s00704-010-0382-8
[33] Lindberg, F., Grimmond, C.S.B., Gabey, A., Huang, B., Kent, C.W., Sun, T., et al. (2018). Urban multi-scale environmental predictor (UMEP): An integrated tool for city-based climate services. Environ Model Softw, 99: 70-87. https://doi.org/10.1016/j.envsoft.2017.09.020
[34] Robinson, D. (2011). Computer Modelling for Sustainable Urban Design. 1st Editio. London. https://doi.org/10.4324/9781849775403
[35] Robinson, D., Haldi, F., Leroux, P., Perez, D., Rasheed, A., Wilke, U. (2009). CITYSIM: Comprehensive micro-simulation of resource flows for sustainable urban planning. Proc Elev Int IBPSA:1083-1090 PP-Glasgow.
[36] Todeschi, V., Boghetti, R., Kämpf, J.H., Mutani, G. (2021). Evaluation of urban-scale building energy-use models and tools—application for the city of Fribourg, Switzerland. Sustainability, 13. https://doi.org/10.3390/su13041595
[37] Mutani, G., Todeschi, V., Kämpf, J., Coors, V., Fitzky, M. (2018). Building energy consumption modeling at urban scale: Three case studies in Europe for residential buildings. https://doi.org/doi:10.1109/INTLEC.2018.8612382
[38] Walter, E., Kämpf, J.H. (2015). A verification of CitySim results using the BESTEST and monitored consumption values. Proc 2nd Build Simul Appl Conf., pp. 215-222.
[39] Mutani, G., Todeschi, V., Beltramino, S. (2020). Energy consumption models at urban scale to measure energy resilience. Sustain. https://doi.org/10.3390/su12145678
[40] Mutani, G., Todeschi, V., Pastorelli, M. (2020). Thermal-electrical analogy for dynamic urban-scale energy modeling. Int J Heat Technol., 38: 571-582. https://doi.org/10.18280/ijht.380301
[41] Masson, V., Heldens, W., Bocher, E., Bonhomme, M., Bucher, B., Burmeister, C., et al. (2020). City-descriptive input data for urban climate models: Model requirements, data sources and challenges. Urban Clim., 31: 100536. https://doi.org/10.1016/j.uclim.2019.100536
[42] Groppi, D., de Santoli, L., Cumo, F., Astiaso Garcia, D. (2018). A GIS-based model to assess buildings energy consumption and usable solar energy potential in urban areas. Sustain Cities Soc., 40: 546-458. https://doi.org/10.1016/J.SCS.2018.05.005
[43] Faroughi, M., Karimimoshaver, M., Aram, F., Solgi, E., Mosavi, A., Nabipour, N., Chau, K.W. (2020). Computational modeling of land surface temperature using remote sensing data to investigate the spatial arrangement of buildings and energy consumption relationship. Eng Appl Comput Fluid Mech., 14: 254-270. https://doi.org/10.1080/19942060.2019.1707711
[44] Suomalainen, K., Wang, V., Sharp, B. (2017). Rooftop solar potential based on LiDAR data: Bottom-up assessment at neighbourhood level. Renew Energy, 111: 463-475. https://doi.org/10.1016/J.RENENE.2017.04.025
[45] Erdélyi, R., Wang, Y., Guo, W., Hanna, E., Colantuono, G. (2014). Three-dimensional SOlar RAdiation Model (SORAM) and its application to 3-D urban planning. Sol Energy, 101: 63-73. https://doi.org/10.1016/J.SOLENER.2013.12.023
[46] Mutani, G., Todeschi, V. (2020). The Effects of green roofs on outdoor thermal comfort, urban heat island mitigation and energy savings. Atmosphere (Basel), 11: 1-32. https://doi.org/10.3390/atmos11020123
[47] Cascone, S., Catania, F., Gagliano, A., Sciuto, G. (2018). A comprehensive study on green roof performance for retrofitting existing buildings. Build Environ, 136. https://doi.org/10.1016/J.BUILDENV.2018.03.052
[48] La Roche, P., Berardi, U. (2014). Comfort and energy savings with active green roofs. Energy Build, 82: 492-504. https://doi.org/10.1016/j.enbuild.2014.07.055
[49] Mutani, G., Todeschi, V. (2020). Low-carbon strategies for resilient cities: A place-based evaluation of solar technologies and green roofs potential in urban contexts. Tec Ital J Eng Sci., 64: 193-201. https://doi.org/10.18280/ti-ijes.642-410
[50] Mutani, G., Todeschi, V. (2020). Building energy modeling at neighborhood scale. Energy Effic. https://doi.org/10.1007/s12053-020-09882-4
[51] Mutani, G., Todeschi, V. (2019). An urban energy atlas and engineering model for resilient cities. Int J Heat Technol., 37: 936-947. https://doi.org/doi:10.18280/ijht.370402
[52] Mutani, G., Todeschi, V. (2017). Space heating models at urban scale for buildings in the city of Turin (Italy). Energy Procedia, 122: 841-846. https://doi.org/doi:10.1016/j.egypro.2017.07.445
[53] Mutani, G., Todeschi, V. (2019). Energy at urban scale modeling: a tool for energy transition, urban regeneration and the reuse of existing buildings and empty spaces (in Italian). ATTI E Rass Tec., LXXIII: 168-176.
[54] Coccolo, S. (2017). Bioclimatic Design of Sustainable Campuses Using Advanced Optimisation Methods. Lausanne, EPFL. https://doi.org/10.5075/epfl-thesis-7756
[55] Höppe, P. (1992). Ein neues Verfahren zur Bestimmung der mittleren Strahlungstemperatur in Freien. Wetter und Leben, 44: 147-151.
[56] Huang, J., Cedeño-Laurent, J.G., Spengler, J.D. (2014). CityComfort+: A simulation-based method for predicting mean radiant temperature in dense urban areas. Building and Environment, 80: 84-95. https://doi.org/10.1016/j.buildenv.2014.05.019
[57] Chen, B., Clark, D., Maloney, J., Mei, W.N., Kasher, J. (1995). Measurement of night sky emissivity in determining radiant cooling from cool storage roofs and roof ponds. United States.
[58] Rodler, A., Guernouti, S., Musy, M., Bouyer, J. (2018). Thermal behaviour of a building in its environment: Modelling, experimentation, and comparison. Energy and Buildings, 168: 19-34. https://doi.org/10.1016/j.enbuild.2018.03.008
[59] Naboni, E., Meloni, M., Mackey, C., Kämpf, J.H. (2019). The simulation of mean radiant temperature in outdoor conditions: A review of software tools capabilities. In Proceedings of the 16th IBSA/BS 2019 – Rome.
[60] Wu, A., Biljecki, F. (2020). Roofpedia: Automatic mapping of green and solar roofs for an open roofscape registry and evaluation of urban sustainability. https://arxiv.org/pdf/2012.14349.pdf.
[61] Forte, A. (2019). Strumenti e Metodi per la Pianificazione Energetica a Scala Territoriale, il caso studio della Regione Piemonte. Politecnico di Torino (IT).
[62] Naboni, E., Meloni, M., Coccolo, S., Kaempf, J., Scartezzini, J.L. (2017). An overview of simulation tools for predicting the mean radiant temperature in an outdoor space. Energy Procedia, 122: 1111-1116. https://doi.org/10.1016/j.egypro.2017.07.471