Guglielmina Mutani* | Silvia Santantonio | Simone Beltramino
© 2021 IIETA. This article is published by IIETA and is licensed under the CC BY 4.0 license (http://creativecommons.org/licenses/by/4.0/).
OPEN ACCESS
Energy Communities (EC) are intended as legal entities that can ensure environmental, economic, and social benefits for energy exchanges between its members. The Italian legislation has recently introduced incentives to Renewable Energy Communities (REC). This work analyses the case study of the REC in Villar Pellice (Turin) and defines a methodology to assess its technical-economic feasibility. The hourly energy consumption and the local renewable energy production are assessed through a place-based methodology, considering different category of end users (municipalities, residential dwelling, companies), and obtaining data from available online database. The REC energy performance is assessed through the self-consumption and the self-sufficiency indexes. Besides, cost-optimal analysis evaluates its economic feasibility, considering investment costs and economic incentives. Several interventions are hypothesized to compare possible REC scenarios (e.g., photovoltaic panels and storage systems installation, energy efficiency measures for public lighting, and different configurations of end users). Results show that REC allows to aggregate stakeholders, ensuring economic advantages and environmental benefits. The methodology applied in this work can support the design phase of the RECs. Its flexibility makes it adaptable to different territorial and regulatory contexts, in evaluating the optimal REC configuration to maximize revenues from the incentive and reach the highest level of energy independence.
energy communities, renewable energy communities, collective self-consumption, self-sufficiency, photovoltaic and storage system, cost-optimal analysis
Energy Communities (EC), as new aggregation models of energy end user, can combine the electricity distributed generation and the optimization of the energy-use, enhancing the share of energy among users. In a context where Renewable Energy Sources (RES) are growing, it is crucial to guarantee flexibility to the energy system. In fact, legislative frameworks at different level have recently developed a series of contractual instruments, allowing this link to be regulated, adapting physical and regulatory infrastructures, observing energy market requirements, ensuring energy equity and the security of energy supply.
To achieve the goals set by the Paris Agreement, the Clean energy for all Europeans package, proposed in November 2016, sets eight legislative acts. As part of it, the Renewable Directive- RED II (2001/2018/EU) defines the “Renewable Energy Communities” (REC), while the Electricity Directive (2019/944/ EU) addresses “Citizen Energy Communities” (CEC). Together, these directives, declare two legal entities:
- the Citizens Energy Communities (CEC) in which citizens, small-medium enterprises (SME) and local authorities, cooperate in the generation, consumption, distribution, storage, supply of energy, or in providing energy efficiency and service management (regardless of renewable energies);
- the Renewable Energy Communities (REC) that owns the objective of providing, through renewable energy production and sharing activities, environmental, economic and social benefits to the community; it does not contemplate electricity distribution activities.
The EC can boost the European energy transition towards more sustainable, competitive, and secure energy systems. At national level, the Italian Integrated National Energy and Climate Plan (NECP, 2018) sets goals and guidelines, promoting the energy self-consumption and the diffusion of RES and storage systems as fundamental steps to reach the objectives of de-carbonization and technological innovation.
These indications were implemented in the current Italian regulatory framework together with the transpositions of the RED II (2001/2018/EU). The “Milleproroghe” Law Decree (LD 162/2019, converted into N.L. 8/2020), initiates an experimental phase on Renewable Energy Communities (REC), introducing them in the existing regulatory framework. It allows a plurality of energy users (consumer, prosumer and producer) to act as a single collective energy user to exchange the electricity that is locally produced by newly installed RES plants. In particular, the Article 42bis (LD 162/2019), introduces the concept of the “collective self-consumption”, as the share of energy that is locally produced and simultaneously self-consumed by all end users that are members of the REC. Two configurations are possible: the “Collective self-consumption” and the “REC” configuration. In the first case the stakeholders involved can be different citizens who live in the same building or condominium; while the members of the REC configuration can be citizens, small-medium enterprises, local entities, and municipalities. Both are defined as a legal entity that has as its main objective to provide economic, environmental, and social benefits at a territorial scale, rather than economic profits. Currently, it is therefore permitted to activate collective RES self-consumption, meaning RECs can do this according to the stipulated legal conditions and time limits. REC has open, free, and democratic participation: the members enter a private contract and maintain their status as final consumer, but all members take advantages from being part of the REC. These legal provisions have been implemented in the specific document drawn up by the Italian Energy Regulatory Authority (ARERA 318/2020/R/eel). It provides for the definition of the REC energy system configuration, according to the existing energy market rules and it set a virtual regulatory model which promotes the benefits of locally produced electricity consumption, in addition to defining the requirements for access to the service and the procedural arrangements. As established by law (LD 162/2019), the Italian Ministry of Economic Development (MISE) has envisaged a specific economic incentive to promote the establishment of REC configurations among the country. The Ministerial Decree (MD Sept. 16, 2020) provides economic incentives and the criteria to have access to it. The technical requirements to be met are:
- characteristics of the new RES power plants to be installed by at least one member of the community. Each system must comply with a power limit not exceeding 200 kW and must start operating from 1 March 2020 and within sixty days following the transposition of the REDII directive (June 2021). The combination with storage systems is allowed to further maximize the share of self-consumption.
- territorial extension of the REC. All members must be connected to the same low-medium voltage (MV/LV) substation, referring to the existing national electricity grid;
- ownership of the RES plants is free. It can be owned and/or managed by a third party, as long as they are subject to the requirements of the community.
The economic incentive lasts 20 years and it is made up of different rates, synthetized in Table 1, slightly differing among the two type of configuration. Rates are applied on different shares of energy, and they are:
The Premium rate defined by MISE is a premium rate applied to the share of energy exchanged among REC members, also named Collective Self-Consumption (CSC). It is defined as the minimum between the energy fed into the national grid by all the new RES plants of the REC and the energy withdrawn from the national grid by all the members of the REC, in each hourly period;
The unit rate defined by ARERA correspond to the refund of the distribution service tariff components and it is also applied to the share of Collective Self-Consumption. The remuneration of the energy fed into the grid by each plant owned by the REC is a sale profit and it can occur at energy market price (Hourly Italian Zone Price) or through agreements with the Italian Energy Services Manager (GSE), that guarantees minimum prices (“Dedicated withdraw”).
The GSE is responsible for reporting the energy shared between REC members on which the incentive is applied (https://www.gse.it/servizi-per-te/autoconsumo/gruppi-di-autoconsumatori-e-comunita-di-energia-rinnovabile).
Table 1. Rates of the economic incentive for REC
|
Corresponding |
“Collective Self-consumption” configuration |
“Renewable Energy Community” configuration |
Share of energy for application |
|
MISE premium rate |
100 €/MWh |
110 €/MWh |
CSC |
|
ARERA unit rate |
9.52 €/MWh |
8.22 €/MWh |
CSC |
|
Sale profit |
Hourly Zone Price (equal to about 50 €/MWh) |
Hourly Zone Price (equal to about 50 €/MWh) |
Local production fed into the grid |
Increasing global energy demand caused by social progress is in contradiction with the lack of energy resources [1]. The challenge of overcoming the climate change and the global warming is faced by many cities through projects and urban policies. Both focus on mitigation measures to reduce greenhouse gases (GHG) emissions, introducing the concept of Resilient Cities and Communities: a city prepared to absorb and recover from any shock or stress, adapting on the continual change [2]. To plan sustainable cities, the application of models improves the livability of a territory, for example in [3] a useful tool is proposed for designing a comfort model by optimizing energy consumption, while [4] provides a methodology that incorporates mitigation of the UHI phenomenon in urban planning. Lots of new energy policies are favoring renewable energy sources which involves in new specific challenges. The policy makers interested need to be able to drive the process towards an increase of the share of RES, at regional level where local action plans must be coordinated and supported by common strategies [5]. Nowadays, it is possible to live in an isolated environment, such as small islands and rural areas, in a sustainable way. Thanks to RES availability, a more sustainable environmental system can be obtained, implementing local energy production, according to the local energy demand, reducing energy cost and ensuring an energy independence [6].
It is crucial for EC to rely on the political support of the local governments and institutions to integrate energy planning at territorial scale with the existing urban and territorial plans [7]. The design of an energy community can facilitate energy planning on a territorial scale: in this way it is possible to implement the production where there is an energy demand; always considering that it is of primary importance to act on the reduction of energy consumption in all sectors (residential, industrial, transport).
2.1 Research objectives
This study describes a methodology to measure a new Renewable Energy Community through the case study of the municipality of Villar Pellice (TO, Italy). The purpose is to develop a flexible and replicable methodology that can be easily adapted to other case studies at different contexts and scales. Furthermore, the study quantifies the effects of cost-benefits analysis among scenarios, assuming different forms of stakeholders’ aggregations and energy efficiency interventions, including establishing an REC [8]. From the identification of the territorial peculiarities, the place-based methodology allows to evaluate different energy profiles and combine the energy demand and supply where there met.
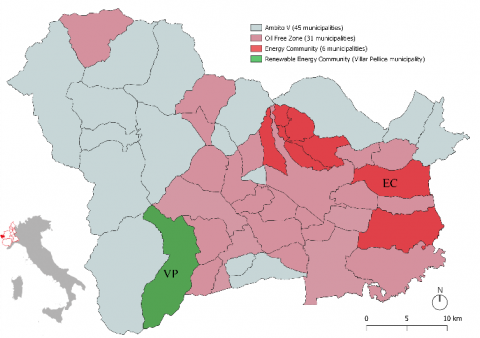
The case study of this work is the municipality of Villar Pellice (VP), located in the Pellice Valley. As part of the Pinerolo territory, it is settled in the Piedmont Region in the North-West of Italy (Figure 1). The Pinerolo territory overlaps with the area “Ambito V” of the Metropolitan City of Turin (45 municipalities). All the municipalities, together with many private citizens and companies in the area, benefit from the energy related services of the multi-utility company ACEA Pinerolese S.p.A. In this territory the first Oil Free Zone (OFZ) in Italy named “Territorio Sostenibile” has been established in April 2019. According to the Italian Law (N.L. 221/2015), in the Oil Free Zones pilot projects are allowed in order to achieve the progressive decarbonization of the area. Thirty-one municipalities in Pinerolo territory are signatories of the memorandum of understanding, including the municipality of Villar Pellice, as shown in Figure 1. Furthermore, the Piedmont Region was the first among the country at recognizing the institution of the Energy Community (R.L.12/2018). The regional legislative framework was further implemented (D.G.R. 18-8520/2019) and a call for proposal has been drafted by the Regulation Act of the Piedmont Region (D.D. 547/2019) to promote this initiative at local scale, providing also for financial support.
Four Energy Communities have been officially recognized, including that of the Pinerolo area (EC) consisting of a founding core of 6 municipalities, already members of the Oil Free Zone (Figure 1).
Figure 1. Localization of Pinerolo (in red) and villar pellice (in green) energy communities
The EC is composed of different category of end users: the six municipalities, citizens (residential users), and eight companies that take part in the consortium “Consorzio Pinerolo Energia”, whose leader is ACEA SpA. The Regional Law 12/2018 requires for a plurality of stakeholders (municipality, residential and company users), a balanced proportion of different types of energy users (consumer, producer, and prosumer), and a diversification of local RES plants (energy mix). In the context of the Pinerolese Oil Free Zone, the Villar Pellice case study turns out to be a further pilot project, for the experimentation of an REC configuration.
Villar Pellice is in a mountain area with an altitude of 664 m a.s.l. (min 587 - max 2,868), a population of about 1,061 inhabitants (ISTAT 2019, https://www.istat.it) and a population density of 17.60 inh/km2. The territorial extension is equal to 60.76 km2, the annual Heating Degree Days (HDD) are 3,350 °C, thus falling within the coldest Italian climate zone F. The mountain context makes the area characterized by a variability of RES, already exploited and in part potentially implementable: solar, agro-forestry biomass and hydroelectric plants of small-medium size.
The municipality of Villar Pellice has shown interest in participating in a feasibility study of a new REC, providing data on energy consumption, and making itself available to install new roof-integrated photovoltaic systems. Therefore, the creation of the REC is assumed through the installation of new photovoltaic (PV) systems.
The selection criteria of the REC stakeholders were based on the category of end user and the availability to be involved in the project. Three category of end user were selected, as they are distinguished on the national energy market: municipal, residential and company users. Each one participates as a recipient of the energy supply through one or more Point of Delivery (POD), associated with a building or service (Table 2):
- the municipality user, considering the Town Hall (TH), the Warehouse (WA), and the public lighting service (PL);
- the residential user, considering the social housing, owned by the municipality consisting of two residential units in which people in economic difficulty have accommodation,
- the company user, considering the “Nuova Crumière”, a local industry dedicated to the production of fabrics and felts.
This aggregation was set to diversify energy profiles, to create a flexible and balance configuration, and to comply with law requirements. In fact, all the PODs listed in Table 2 are submitted to the same LV/MV electric transformer substation, as the buildings considered are sited in a limited area of the municipal territory (Figure 2).
Table 2. Stakeholders involved in the project
|
POD Name |
Category of end user |
Starting Category |
New Category |
Type of Intervention |
|
|
TH |
Town Hall |
Municipality (MUN) |
Consumer |
Prosumer |
Installation of PV systems |
|
WA |
Warehouse |
Consumer |
Prosumer |
Installation of PV systems |
|
|
PL |
Public lighting |
Consumer |
Consumer |
/ |
|
|
NC |
Nuova Crumière |
Company |
Consumer |
Prosumer |
Installation of PV systems |
|
SH |
Social housing |
Residential |
Consumer |
Prosumer |
Installation of PV systems |
Figure 2. Buildings involved in the case study
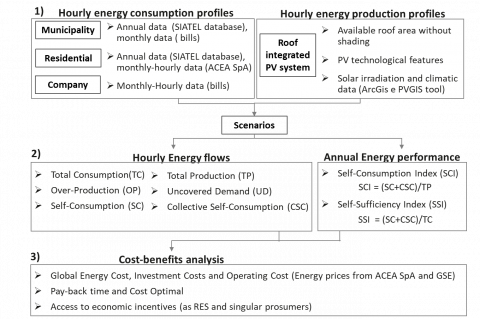
The place-based methodology used in this work allows to consider several energy-related variables at different scales. This methodology can include all the constraints present on a territory: technical, environmental, social, and regulatory/legislative type [9]. This analysis is carried out in three phases, as shown in Figure 3:
1) definition of the hourly energy consumption and production profiles for each REC member, according to the category of end user and RES technological system;
2) assessment of the energy balance and the energy performance through a set of energy fluxes and energy indicators, respectively to compare all scenarios hypothesized;
3) cost-benefits analysis, considering investment costs, energy costs, and pay-back time, including the economic incentive for REC configuration, comparing different scenarios of intervention.
Figure 3. Place-based methodology
4.1 Energy data source
The annual and monthly energy consumption data of the municipality refer to the year 2017. The reference database for the annual energy consumption at territorial scale is the SIATEL database (Local Authority Tax Registry Interchange System(https://puntofisco.agenziaentrate.it/PuntoFiscoHome/LogonMatrice.jsp). The telematic system allows the active exchange of personal and tax information between the central and local Italian public administration. Therefore, it was possible to consult the database of the financial administration relating to the energy expenditure of the different categories of end users present in the municipal area; sensitive data have been deleted by the municipal authority. The monthly and hourly energy consumption of residential users have been provided by ACEA Pinerolese Spa. Considering a sample of about 380-470 residential users located in the Pinerolo area, data refers to a typical residential user, calculated for 12 typical days of the year 2017, considering seasonal and weekly differences. According to the Italian census database (ISTAT 2011, https://www.istat.it), it corresponds to a family of 2.15 components, in a 93.78 m² dwelling, located at an altitude of 581 m a.s.l. and in climatic zone E, with 2,829 HDD. The monthly and hourly energy data of the Nuova Crumière company come from the bills, as provided by the Energy Manager of the company.
All consumers can access data of their electricity supplies, including historical consumption, technical and contractual information through various telematic methods, based on the provisions of ARERA (N.L. 205/2017). After registering on the website of the electric distribution system operator in the area, for installed powers above 35 kW and new generation electronic meters, all end users can access their profiles and download the load curves of the electricity consumption in quarterly detail. At national level, by authenticating via digital identity, it is also possible to access the "Consumer Portal" managed by the Acquirente Unico (https://www.consumienergia.it/portaleConsumi/), which makes available energy data at different details, depending on the type of meter. If the supply is equipped with an electronic counter, it is possible to download data by time band.
4.2 Hourly energy consumption profiles
The hourly energy consumption of the municipal buildings was assessed starting with the available annual and monthly data, based on SIATEL database and energy bills, respectively. According to the holiday calendar relating to the examined year, the monthly energy consumption of the Town Hall (TH) and the Warehouse (WA) was hourly distributed, considering the daily opening hours and use of these facilities. The hourly energy consumptions of the municipal Public Lighting (PL) are based on monthly available data of 2017. Starting from the conventional switch-on and switch-off times established for municipalities located in the north-west area of the country, as indicated by the national energy authority ARERA (ARG/let/29/08), the hours of utilization were calculated, and subsequently, the respective switch-on time profile was assigned to every day of the year. The energy profile of the residential user of the Social Housing (SH) was evaluated starting from the annual data provided by the SIATEL database. From this, the average annual electric consumption of citizens residing in the municipality in 2017 was obtained. This latter coincided with the annual energy consumption of a typical residential users in Villar Pellice, as its characteristics are in line with those of the typical residential user and customer evaluated for the monthly and hourly consumption profiles provided by ACEA Pinerolese SpA (see par. 4.1).
4.3 Hourly energy production profiles
The evaluation of the roof integrated PV panels to be installed has been made considering the available area without shadings, the technological characteristic of the PV system and the solar irradiation of the examined year. Relying on the PVGIS tool (https://ec.europa.eu/jrc/en/pvgis), it is possible to calculate the hourly energy production in every hour of the year. The tool needs the following constraints: location (latitude, longitude, and elevation), radiation database, year of evaluation (from 2005 to 2016), PV mount type (fixed, vertical axis, inclined axis and two axes), slope of the panel, azimuth of the building, PV technology, nominal power of the PV system and system loses. For the case study analyzed, all the prosumers installed PV panels of polysilicon technology and fixed mounting type, with system losses estimated at 14%. The climatic and solar radiation data refer to the radiation database PVGIS-SARAH for the year 2016. Table 3 presents the characteristics for each of the PV plants that are expected to be installed on the roof of the selected building.
Table 3. Input data PVGIS
|
Input data PVGIS |
TH |
WA |
CR |
SH |
|
Roof slope [°] |
29 |
20 |
30 |
27 |
|
Roof azimuth [°] |
-11 |
2 |
-2 |
-0.5 |
|
Roof available surface [m2] |
103 |
94 |
1,125 |
19 |
|
Nominal PV power [kWp] |
5.5 |
12.6 |
152.3 |
2.5 |
|
Number of PV panels |
24 |
55 |
662 |
11 |
4.4 Energy flows in REC configuration
Figure 4 explains the energy flows that occurs in case of the REC configuration. In this scheme, the total amount of local energy production from new RES power plants is the Total Production (TP), and the Total Consumption (TC) refers to the energy demand of all EC members.
The Self-Consumption (SC) is the share of energy that is instantly self-consumed by each prosumer and it can be calculated according to Eq. (2) and (4).
The Uncovered Demand (UD) is the share of energy consumption that is not satisfied by the local production and it must withdraw from the national grid, as it shown in Eq. (1).
if TC ≥ TP and OP=0
UD [kWh]= Total Consumption-Total Production (1)
SC [kWh]= Total Consumption-Uncovered Demand (2)
The Over Production (OP) is the share of energy that is not instantly self-consumed because the energy generated is greater than the energy demand, as it expressed in Eq. (3):
if TP ≥ TC and UD=0
OP [kWh]= Total Production-Total Consumption (3)
SC [kWh]= Total Production- Over Production (4)
The Collective Self Consumption (CSC) is the share of energy that is exchanged among the REC members. It corresponds to the minimum between the energy fed into the national grid by all the new RES plants of the REC (OP) and the energy withdrawn from the national grid by all the members of the REC (UD), in each hourly period.
CSC = MIN (OP: UD) (5)
The still Over Production (sOP) is the share of energy production still available after the withdrawn from EC members (CSC), and it can be sold to the national grid.
The still Uncovered Demand (sUD) is the share of energy consumption that has not be satisfied by the Self-Consumption (SC), nor by the collective Self-Consumption withdraw (CSC), and necessarily has to be withdrawn from the national grid.
Figure 4. Hourly energy flows in the REC configuration
4.5 Energy performance indicators
Determining the flow of energy carriers is one of the first step to propose changes in the management of energy locally. Once renewable technologies that can meet current demands are identified, it is possible to create local energy scenarios and by using sustainability indicators proposed options can be formulated [10]. In assessing the potential of PV-battery system, Luthander et al. [11] report the importance of the daily and seasonal matching between local energy production and consumption, using two indicators to express the load matching potential.
These are the Self-Sufficiency Index (SSI) and the Self-Consumption Index (SCI). Both can be used to assess the energy performance of the REC interconnected to the national grid. The Self-Sufficiency Index (SSI) indicated the share of locally self-consumed energy out of the total energy consumption, and it is calculated with Eq. (6). The Self-Consumption Index (SCI) is defined as the share of locally self-consumed energy out to the total energy production by RES, as described with Eq. (7). Both indexes are calculated summarizing the Self-Consumption (SC), the collective Self-Consumption (CSC), the Total Consumption (TC) and the Total Production (TP) of all the REC members.
$S S I=\quad(S C+C S C) / T C$ (6)
$S C I=(S C+C S C) / T P$ (7)
The Regional Law of the Piedmont Region (R.L. 12/2018) requires a minimum threshold of the annual self-consumption index (SCI) for Energy Community configurations that correspond to 70%. Choosing the intervention to be implemented that best contributes to reaching acceptable thresholds for both indices, implies economic analysis and cost-optimal assessment.
4.6 Cost-benefits analysis
The aim of the cost-benefits analysis is to highlight the economic benefits for each stakeholder, in each supposed scenario, to identify the one that ensures economic benefits for all. The cost-optimal analysis allows to compare the economic implication of the different types of intervention, defining the optimal level of performance as a function of costs; in this work, the energy performance concerns the contribution to self-sufficiency and self-consumption indexes improvement, and the economic performance concerns ensuring an economic gain for each energy user. In addition, the environmental performance was assessed for each scenario, by defining the annual GHG emissions (tCO2eq) for the annual consumption of electricity withdrawn from the national grid [12] to define the optimal intervention that guarantees the energy supply to the greatest number of users at the lowest economic and environmental cost. To assess cost-optimal analysis, the Global Cost approach (Standard EN 15459:2007), has been applied to each scenario. The Global Cost consists of calculating the present value of the Energy Costs, referring to the initial year, including the initial Investment Cost, as it is expressed in Eq. (8),
$C_{G}(\tau)=C_{I}+\sum_{i=l}^{\tau}\left(C_{E i} \cdot R_{d}(i)\right)$ (8)
where, $C_{G}$ is the Global Cost referred to the initial year $\tau_{0} ; C_{I}$ is the initial Investment Cost; $C_{E, i}$ the annual Energy Cost at year i; $R_{d}$ the discount factor at year i, equals to $2 \%$.
Table 4. Investment costs
|
Intervention |
Marginal cost |
|
|
Storage system installation |
St < 500 kWh |
600 €/kWh |
|
St > 500 kWh |
400 €/kWh |
|
|
Roof integrated PV system installation |
PV < 6 kWp |
2,000 €/kWp |
|
6kWp < PV > 20 kWp |
1,600 €/kWp |
|
|
PV > 20 kWp |
1,000 €/kWp |
|
|
Public lighting efficiency |
Lamp replacement (from HPS to LED) |
335 €/lamp |
|
REC constitution |
(legal fees) |
5,000 €/REC |
The Investment Cost refers to the expenses incurred to implement different interventions. Table 4 shows the marginal costs for each type of intervention: for the photovoltaic (PV) and storage (ST) installation, different costs have been identified, considering the size of the plant (https://www.qualenergia.it); lamp replacement costs refer to [13], and costs for the REC establishment refers to the annual contribution envisaged by the Piedmont Region (R.L. 12/2018), supporting technical and legal expenses.
The annual Energy Costs are calculated with Eq. (9); it considers the aggregation of all the expenses for the withdrawal of energy incurred by users, and the aggregation of all the revenues generated by the sale profit of the energy fed into the grid; revenues also include the savings from the Self-Consumption (SC) and Collective Self-Consumption (CSC), as they correspond to a lack of expenditure. To the CSC is related the profit (in €/year) from the incentive as envisaged by the Italian law (MD Sept. 16,2020).
Annual Energy Cost $C_{E}=\left(\Sigma\right.$ Expenses- $\sum$ Revenues $)$ (9)
Each energy flows of paragraph 4.4 are associated with a different energy price, depending on the direction of the flow (withdrawal or sale), the electricity grid (national or local), and the category of end user (company, municipality, residential), as it synthesized in Table 5. The REC incentive refers to the REC configuration as a single entity, it is applied to the total energy exchanges between members (Collective Self-Consumption), without distinction by category of end user; its value is fixed for the duration of the incentive itself. The energy prices on the national grid (NG) refer to the real energy market prices in the area of the case study: the withdrawal energy prices (ENG) corresponds to the average price in the bill by end user category, provided by ACEA Pinerolese SpA. The energy price for the energy sale to the national grid (RNG) corresponds to the hourly price of the year 2017 for the north-west area of the Italian electricity market, as provided by GSE (http://www.fattoriedelsole.org/servizi/Documenti%20Privati/Prezzi%20medi%20RID%20(aggiornato%2012-17).pdf).
The annual Expenses and Revenues (in €/year) have been calculated according to Eq. (10) and (11), respectively.
Expenses $=(U D+C S C) E_{N G}$ (10)
Revenues $=\left(O P^{*} R_{N G}\right)+\left(C S C_{R E C_{\text {in }}}\right)+\left(S C \cdot E_{N G}\right)$ (11)
Table 5. Energy prices [€/kWh]
|
End Users |
Withdrawal from national grid |
Sales to national grid |
Collective Self-Consumption |
|
ENG |
RNG |
RECinc |
|
|
Company |
0.15 |
Hourly Zone Prices |
0.11822 |
|
Municipality |
0.18 |
||
|
Residential |
0.22 |
4.7 Scenarios
In the first two scenarios interventions are supported by each stakeholder independently; from the third scenario onwards, the REC establishment is associated with different interventions which consider the inclusion of additional members, storage system installation, energy efficiency measure or a combination of them. These scenarios are:
5.1 Hourly energy profiles of Singular POD and Singular prosumer scenarios
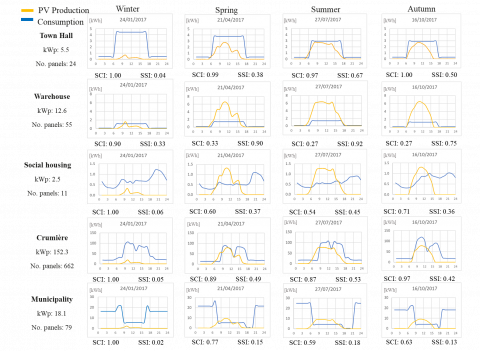
To evaluate the trend of energy production and consumption of individual users, typical working days in each season were analysed, excluding the weekend. Figure 5 shows that energy consumption and production profiles varying according to category of end users. The Townhall (TH) and the Warehouse (WA) present flat consumption profiles since, as explained in paragraph 4.2, the hourly consumption was assessed considering the typical opening and closing times of buildings. Residential users (SH) have a peak demand in the evening hours, while Nuova Crumière (NC) is the most energy-intensive end user and presents load peaks during the typical working hours and a drop during the lunch break.
The energy production presents similar profiles for all users since they are in a nearby area and therefore subject to similar climatic conditions. The PV production is drastically reduced in winter, due to the presence of snow on roof-tops and the height of the sun, as characteristics of the mountain context.
Results of the line “Municipality” (Figure 5), are given by the sum of electric consumption and productivity of TH, WA and PL: this latter has a significant role in the municipality's consumption and occurs at times where production is absent.
Although referring to energy profiles of very different entities, the SCI of TH and NC are high (nearly 1.0), as their production is concomitant with demand, but being lower, they still withdraw energy from the grid (UD) and therefore the SSI is very low. The WA has a much greater local production compared to its internal consumption; therefore, its UD is limited and consequently the SSI is high. Moreover, since part of the PV production is fed into the grid (high OP), the SCI is low. For residential user (SH), SCI and SSI values are not high: in all seasons energy production and consumption do not coincide, making always positive both the share of OP, during the day and the share of UD, in the evening.
Figure 5. Hourly energy production (yellow), consumption (blue), SCI and SSI in typical working days of the different seasons
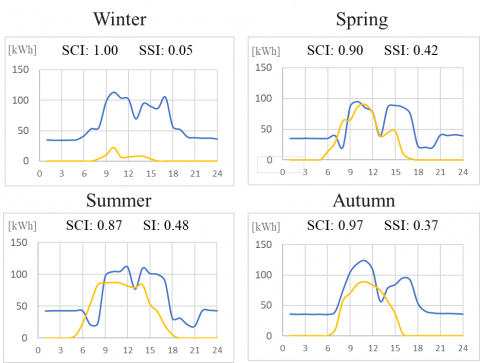
5.2 Monthly and Hourly energy profiles of REC scenario
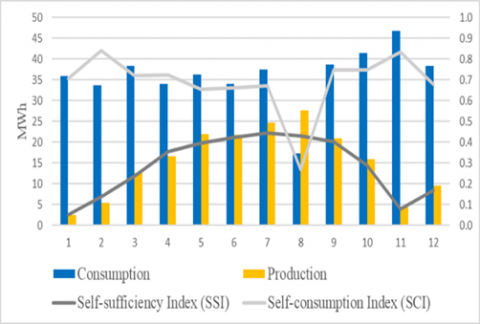
The REC scenario aggregates all energy users, summarizing their energy production and demand; therefore, the overall result depends on the weight of each user's consumption. Figure 6a shows the distribution of monthly energy production and consumption. The first reaches maximum value (27 MWh/month) during the summer season and it is drastically reduced in autumn and winter (less than 5 MWh/month), the second is quite constant during the year, with an average value of 35 MWh/months. The energy demand always exceeds the local productivity, except in August, since the NC company is closed. The highest level of OP occurs in August (given the high producibility and low consumption), and consequently, the SCI (Figure 6a) reaches the lowest value (about 0.3) since the local production is only partially self-consumed. On the contrary, the highest values of the SCI are on February and November, when OP is low and UD is still high. Analyzing the SSI trend, it reaches its lowest values (less than 0.2) in winter, turning to grow again (around 0.5) in months with a higher productivity. Figure 6b reports the daily hourly consumption and production profiles and daily SCI and SSI, for typical working days in seasons. It shows high values of SCI during all year (0.8-1.0) and very different values of SSI, depending on the season: very low in winter (0.05), quite average in autumn (0.37), spring (0.42) and summer (0.48). The gap between the winter minimum and the summer maximum which will affect the annual value of SSI.
(a)
(b)
Figure 6. Energy production (yellow) and consumption (blue), SCI and SSI of the REC, monthly (a) and hourly (b)
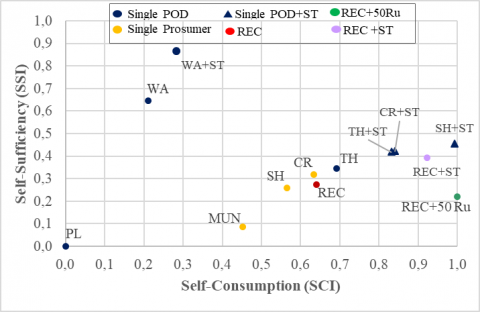
5.3 Energy performance comparison between scenarios: the SSI and SCI indexes
To evaluate the contribution of each type of intervention at improving the energy performance of the REC, for all the seven hypothesized scenarios, the annual SSI and SCI indexes were evaluated and compared, as described in [11].
In Figure 7a are shown the SCI and SSI indexes of the different stakeholders comparing the Singular POD and Singular prosumer scenarios with three REC scenarios. In the REC+50Ru scenario, the 50 residential users new REC memebers, can consume all the OP of the REC, hourly assesed in July, and allow reaching the maximun annual SCI of 0.9. If compared to the REC scenario, the SSI is lightly reduced, due to the 50 residential users who have an evening demand peak (sUD) that cannot be satisfied by the local PV production. This scenario demonstrates the convenience of self-consuming energy within the REC aggregating different users. It is possible to remedy the dis-matching of the hourly local energy demand and supply by introducing storage systems that allow to shift self-consumption over time. Different battery size could be installed, but, since battery price increases with its size, the best solution was to reduce the capacity of the batteries. In the REC+ ST scenario, for each prosumer, the battery capacity was set considering the hourly daily consumption and productivity profile in the whole year. Two hypotheses have been made, basing the size of the storage on the maximum or on the average value of the annual daily overproduction. The annual SCI and SSI results of the second hypothesis (avg. value) did not differ from those of the first hypothesis (max value), so it has been opted for the smaller size, ensuring the same energy performance and lower costs. The sizes of the storage systems devices (lithium-ion batteries) assumed for each prosumer are listed in Table 6. For Singular POD and Singular prosumer scenarios, the capacity was sized on the average yearly achievable self-consumption, calculated as the minimum between OP and SC for all days of the year.
Table 6. Storage system capacity
|
Stakeholder |
Capacity op [kWh] |
Capacity sc [kWh] |
Scenario |
|
Town Hall (TH) |
4.8 |
2 |
Singular POD/ Singular prosumer |
|
Warehouse (WA) |
29 |
2.4 |
|
|
Municipality (MUN) |
35 |
28 |
|
|
Municipality MUN+LED+ST |
28.5 |
27 |
|
|
Social housing (SH) |
3.2 |
3 |
|
|
Nuova Crumière (CR) |
162 |
85 |
|
|
REC |
194 |
/ |
REC+ST |
|
194 |
/ |
REC+LED+ST |
|
|
REC+LED+ST+12Ru |
Installing batteries, stakeholders optimize both their individual SCI and SSI, reaching high value of SCI (0.8-1.0) (Figure 7a). The WA+ST reaches low SCI, due to the high amount of OP, and high SSI, given its lower UD.
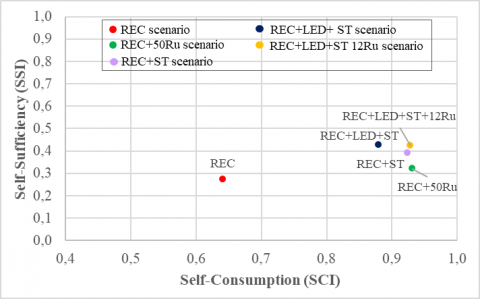
To improve the energy performance of the REC+ST scenario, another measure hypothesised consists in reducing the energy consumption through energy efficiency intervention before installing storage systems, as it occurs in the REC+LED+ST scenario (Figure 7b).
In this work, the replacement of the current luminaires (i.e. HPS) with more efficient light sources (i.e. LED) concerns only the public lighting service. As reported in [13], the energy savings is equal to 37%. Reducing energy consumption let the Municipality user improve its SSI, without affecting its production capacity.
(a)
(b)
Figure 7. Annual SCI and SSI for the Single POD, Single Prosumer, REC, REC+50 Ru, REC+ST scenarios with all singular prosumers (a), and among all REC scenarios (b)
In REC+LED+ST+12Ru, all hypothesised scenarios are combined and both indicators increase (Figure 7b). The SCI is maximum (0.9) as the new 12 residential members consume all the still overproduction, considering that other stakeholders have batteries. If compared to the REC scenario, the SSI improves, while it is steady, if compared to the REC+LED+ST. This because of the UD at evening hours, as the local RES production is no longer available, and the OP in August that is fed into the grid rather than self-consumed, as it would require too much storage capacity.
Installing storage systems (REC+ST) and expanding the number of consumers (REC+50Ru), both let increase the SCI. and implement the SSI, with the first scenario more performing than the second. The only reduction of night-time consumption (PL) does not contribute at increasing the SCI, but it increases the SSI of the entire REC. Therefore, it is possible to assume that efficiency measures aim at reducing the energy demand of all users could lead to a further improvement in the REC energy performance. Nevertheless, the REC+LED+ST scenario guarantees the best energy performance, also when including other members to maximize energy exchanged (REC+LED+ST+12Ru). None of the scenarios reached a higher annual self-sufficiency (SSI) than about 0.5. As described in [11], this is because the energy consumption and production have high seasonal variations: higher load peaks in winter and higher PV production in summer. Storage systems can be used for short-term storage within few days and cannot even out the seasonal mismatch between local energy production and consumption; however, they can contribute to increasing the share of energy exchange between REC members, making the OP available to other users with different hourly consumption profiles.
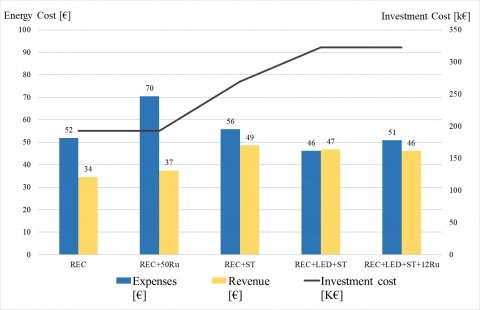
5.4 Economic and financial analysis
By analysing the economic and financial implication of the different interventions, different scenarios are compared on the based on their economic feasibility. Figure 8 shows the investment costs and the annual energy costs of the five scenarios related to the REC configuration.
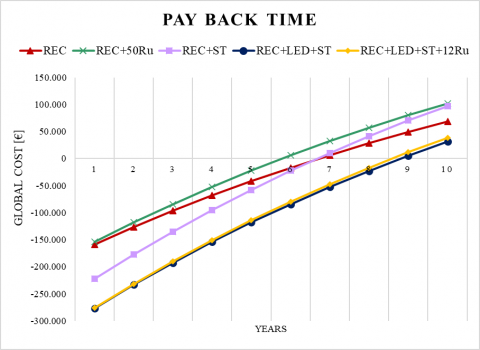
Despite the economic incentive applied to the share of CSC, in the REC scenario the annual expenses are higher than revenues; therefore, the hypothesis of interventions to increase this share of energy exchanged is also relevant from an economic point of view. As can be seen, the storage system installation is the most expensive investment cost, double the energy efficiency intervention, while the legal REC institution includes the minimum cost. Comparing annual expenses and revenues, the REC+50 Ru scenario involves an increase in revenues due to a greater share of energy, but also an increase in expense, because there are many residential users who buy energy from the grid. Both REC+ST and REC+LED+ST contribute to reducing expenses and to increase the revenues. The first ensures a greater increase in revenues, because of the considerable increase in CSC is here intended as a failure to purchase energy from the grid; the second ensures lower annual energy expenses due to the reduction of energy demand. The REC+LED+ST+12Ru guarantees an intermediate economic performance between the two, ensuring less expenses and higher revenues, without further additional investment costs. Despite the battery’s installation proved to be the most performing scenario both from an energy and an economic point of view; it has the greatest impact both in environmental and financial terms. Considering the Global Cost discounted over the duration of the incentive, the economic convenience of each type of intervention is evident, comparing the payback times as represented in Figure 9. All REC configurations have payback times included in the 20 years. This is due to the remuneration of the economic incentive provided by law (LD 162/2019) to make the initial investment profitable and to promote REC among citizens.
Figure 8. Investments costs, annual energy expenses and annual revenues for all REC scenarios
Figure 9. Payback time for all REC scenarios
The most economically advantageous scenario is the REC+50 Ru (6 years), this because CSC is maximized and so the incentives (Figure 9). REC scenario is also very advantageous (7 years), while the REC+ST has a high economic return but given the higher investment, it takes 7 years to return it. The REC+LED+ST leads a quite consistent investment cost and so more time to return it (9 years), and it is in line with the REC+LED+ST+12Ru scenario.
Analysing the singular prosumer scenarios, in which stakeholders bear investments individually without any incentive, payback time is less than 20 years, except for NC company (12 years for PV and 15 years for PV+ST), and residential (SH), 18 years for PV+ST.
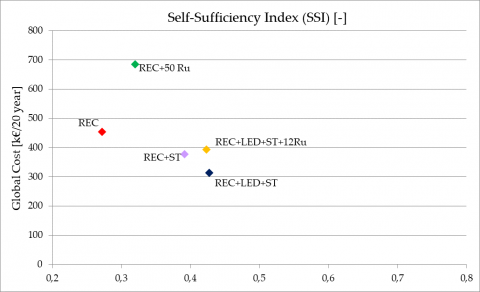
Results of energy performance (SCI and SSI) and economic performance (energy cost and payback times) report the REC+ST and REC+LED+ST, as best scenarios. The choice between the two can be made considering the economic convenience (lower Global Cost) in ensuring the energy supply to the REC members (higher SSI, Figure 10a) and the environmental sustainability (lower GHG emission, Figure 10b). Combining energy efficiency intervention and subsequently dimensioning the energy production and storage systems (REC+LED+ST), offers the highest level of energy independence and greater economic benefits: high investment costs are repaid over time. REC+LED+ST+12Ru ensures the supply of the largest number of users maintaining similar levels of energy, economic and environmental performance.
(a)
(b)
Figure 10. Cost-optimal of all scenarios related to the REC configuration aimed at improving the Self-Sufficiency Index (SSI) (a) and at reducing the GHG Emissions (b)
The methodology explained in this work is useful to measure RECs in terms of energy security and economic convenience. Energy planning is fundamental to guarantee good results, as the “energy vocation” of the territory. As in this case study, mountain areas have great RES availability and low consumption; therefore, it is easier to reach high values of self-consumption and self-sufficiency.
The analysis carried out show how to increase the energy self-sufficiency, optimizing self-consumption by aggregating different users, in combination with energy efficiency interventions and storage systems. Batteries can lead to better results, but they have high environmental and economic costs.
It is also evident the importance of economic incentives that promote end user initiatives in implementing energy efficiency measures in a coordinated and cooperative manner. Through the place-based methodology it is possible to highlight the opportunities generated by the different aggregations of end users in a specific territory, comparing different intervention scenarios to identify the one that can ensure economic benefits for all stakeholders. In Italy, there are existing available economic incentives aim at supporting investment costs. Municipal users can access to the Law Decree “Crescita” (L.D. 34/2019, art. 30) that make available € 100,000 for energy efficiency improvement of public buildings. Company users have access to the Law Decree “Milleproroghe” (DL 162/2019) which allows a tax deduction of 50 % up to a total amount of € 96,000 per property unit. Residential users can link the PV installation to the “Superbonus 110 %” economic incentive, as established by law (N.L. 77/2020), as a subordinate intervention to the energy retrofit of the building.
The importance of incentives can be translated into the importance of local energy policies aimed at supporting such initiatives. An important phase of the work is to inform citizens through participatory operations campaign.
The results obtained in this work can provide technical support to policy makers. The applied methodology can be replicated and adapted to other contexts such as the case study of the Pinerolo Energy Community. In future works, other intervention scenarios could be hypothesized such as the energy retrofit of buildings, the energy demand optimization through real-time monitoring systems or the exploitation of other available local RES, such as hydroelectric or biomass.
|
ARERA |
Italian Energy Regulatory Authority |
|
TC |
Total Consumption, [kWh] |
|
CEC |
Citizens Energy Community |
|
CR |
Nuova Crumière company |
|
CSC |
Collective Self-consumption, [kWh] |
|
EC |
Energy Community |
|
GHG |
Green House Gas |
|
HDD |
Heating Degree Days, [°C] |
|
HPS |
High-pressure vapour sodium lamps |
|
LED |
Light-emitting diode sources |
|
LV/MV |
Low Voltage/Medium Voltage |
|
MUN |
Municipal user |
|
NG |
National Electric grid |
|
OFZ |
Oil Free Zone |
|
OP |
Over Production, [kWh] |
|
PL |
Public Lighting |
|
POD |
Point of Delivery |
|
PV |
Photovoltaic system |
|
REC |
Renewable Energy Community |
|
RES |
Renewable energy sources |
|
Ru |
Residential users |
|
SC |
Self-consumption |
|
SCI |
Self-Consumption Index, [-] |
|
SH |
Social Housing |
|
SSI |
Self-Sufficiency Index, [-] |
|
ST |
Storage |
|
TC |
Total Consumption |
|
TH |
Town Hall |
|
TP |
Total Production, [kWh] |
|
UD |
Uncovered Demand |
|
WA |
Warehouse |
[1] Limpasurat, A., Falcone, G., Teodoriu, C., Barrufet, M.A., Barrufet, O.O.B. (2011). Artificial geothermal energy potential of steam-flooded heavy oil reservoirs. IJOGCT, 4(1): 31-46. https://doi.org/10.1504/ijogct.2011.037743
[2] Boeri, A., Longo, D., Gianfrate, V., Lorenzo, V. (2017). Resilient communities. Social infrastructures for sustainable growth of urban areas. A case study. International Journal of Sustainable Development and Planning, 12(2): 227-237. https://doi.org/10.2495/SDP-V12-N2-227-237
[3] Danza, L., Belussi, L., Floreani, F., Meroni, I., Piccinini, A., Salamone, F. (2018). Application of model predictive control for the optimization of thermo-hygrometric comfort and energy consumption of buildings. Instrumentation Mesure Métrologie, 17(3): 375-391. https://doi.org/10.3166/I2M.17.375-391
[4] Mutani, G., Todeschi, V., Matsuo, K. (2019). Urban heat island mitigation: A GIS-based model for Hiroshima. Instrumentation Mesure Métrologie, 18(4): 323-335. https://doi.org/10.18280/i2m.180401
[5] Casano, G., Piva, S. (2016). A renewable energy joint strategy for the implementation of local action plans for renewable energy. International Journal of Heat and Technology, 34(S2): S371-S378. https://doi.org/10.18280/ijht.34S226
[6] Cannistraro, G., Cannistraro, M., Trovato, G. (2017). Islands Smart Energy for eco-sustainable energy a case study Favignana Island. International Journal of Heat and Technology, 35(Sp. 1): S87-S95. https://doi.org/10.18280/ijht.35Sp0112
[7] Mutani, G., Beltramino, S., Forte, A. (2020). A clean energy atlas for energy communities in Piedmont Region (Italy). International Journal of Design & Nature and Ecodynamics, 15(3): 343-353. https://doi.org/10.18280/ijdne.150308
[8] Magrini, A., Lazzari, S., Marenco, L., Guazzi, G. (2018). Cost optimal analysis of energy refurbishment actions depending on the local climate and its variations. Mathematical Modelling of Engineering Problems, 5(3): 268-274. https://doi.org/10.18280/mmep.050321
[9] Mutani, G., Todeschi, V. (2019). An urban energy atlas and engineering model for resilient cities. International Journal of Heat and Technology, 37(4): 936-947. https://doi.org/10.18280/ijht.370402
[10] Barragán, A., Terrados, J. (2018). Sustainable cities: an analysis of the contribution made by the renewable energy under the umbrella of urban metabolism. International Journal of Sustainable Development and Planning, 8: 416-424. https://doi.org/10.2495/SDP-V12-N3-416-424
[11] Luthander R., Nilsson, A.M., Widén, J., Åberg, M. (2019). Graphical analysis of photovoltaic generation and load matching in buildings: A novel way of studying self-consumption and self-sufficiency. Applied Energy, 250: 748-759. https://doi.org/10.1016/j.apenergy.2019.05.058
[12] Caputo, A. (2020). Atmospheric emission factors of greenhouse gases in the national electricity sector and in the main European Countries –Report 317/2020. ISPRA-Higher Institute for Environmental Protection and Research, March 31st 2020, Roma.
[13] Beccali, M., Bonomolo, M., Lo Branob, V., Ciulla, G., Di Dio, V., Massaro, F., Favuzza, S. (2019). Energy saving and user satisfaction for a new advanced public lighting system. Energy Conversion and Management, 195: 943-957. https://doi.org/10.1016/j.enconman.2019.05.070