Lindita Bande* | Prajowal Manandhar | Raghad Ghazal | Prashanth Marpu
© 2020 IIETA. This article is published by IIETA and is licensed under the CC BY 4.0 license (http://creativecommons.org/licenses/by/4.0/).
OPEN ACCESS
The rapid urbanization of the UAE, including medium sized cities like Al Ain City, has a significant relationship to local micro-climatic change. Al-Ain city in the southeast of the UAE and was originally an oasis. It has a hot and arid climate with a very dry and hot summer. The climate of the city is affected by the desert areas of red sand and the eastern Rocky Mountains. The local micro-climatic evolution can be studied and tracked using the local climate zone (LCZ) classification map. The districts of Al Ain are classified based on different factors, including surface cover and surface temperature, which were analysed using WUDAPT (World Urban Database and Access Portal Tools) software. The LCZ map is based on high-resolution satellite images, which were used to classify regions based on building morphology and district pattern. The LCZ map results were compared with CFD (computational fluid dynamic) models that were simulated using ENVI-met software tool. The CFD models were optimized and validated based on on-site surveys and information taken from the local authorities, while the boundary conditions were validated using site measurements. Both models were analysed over the spring and summer seasons. Based on the results provided from WUDAPT and ENVI-met, a higher temperature was observed in the densest areas (downtown) and lower temperatures in the green zones (park, city date farms) and the result precision was higher in the colder season (autumn in this case).
local climate zone, WUDAPT, heat island effect, ENVI-met, city mapping
The current rapid urbanization has increased the percentage of the world population that lives in urban areas. This transformation can lead to different environmental issues, including high energy demand, local climate change, pollution, and traffic congestion. The urban heat island (UHI) is a local climate change phenomenon that can be defined as the difference in temperature between the urban and rural areas [1]. The recent issues of urbanization and temperature rise have directly affected the dynamics of the urban climate. However, climate information about urban areas is very limited and no specified/detailed classification is available, as most of the available information focuses on the administrative regions that are related to the built-up areas. Additionally, urban form and urban function affect the sustainability of urban areas and the overlying atmosphere. For that reason, it is very important to study the microclimate variation of urban environments [2-4].
Urban studies in the hot and arid climate regions are limited, and more investigation is needed. The main limitation of the typical way of classifying regions into urban and rural is that it will not identify microclimate dynamics nor assess UHI correctly in heterogeneous city layouts. To overcome the previous issues of studying urban microclimates, Stewart et al. [1] have introduced a new approach, local climate zones (LCZ) classification. The LCZ classification helps in studying the microclimate and assesses the UHI comprehensively by considering the physical and geometrical elements of each urban region. The zones are differentiated based on surface cover, material, structure and human activity. The LCZ classification can be used as an input for urban micro-climate models [5].
Recent studies have used the World Urban Database and Portal Tool (WUDAPT) platform for analysing climate zones in cities like Xi’an, China; Katuna, Nigeria; the London metropolitan area, UK etc. [5-7]. The interaction of these zones are linked to studying various topics, such as pollution, city expansion, UHI etc. WUDAPT is also used to analyse and classify green areas and water zones [6]. Estimating the green vegetation fraction in the Perl River Delta region, China is part of a study in managing natural disasters. [7]
Micro-climate modelling has been used widely to track the urban processes [8]. WUDAPT is a recent project that visualizes the link between landscape change and climate by acquiring, storing, and disseminating climate data on the physical geographies of cities around the world. Through the latest upgrades of the software, it is possible to have global transferability of the definition of local climate zones. A bottom-up approach is being explored to have more accurate data on the analysed zones. Additionally, open databases such as OpenStreetMap have been found to also contribute to more precise classifications. The local climate zones vary from 1to 10 for the build types and from A to G for the land cover types [9, 10].
ENVI-met is an urban modelling software tool that estimates the surface temperature and mean radiant temperature trapped in the urban canyon. The main limitation of ENVI-met 4.0 is the absence of anthropogenic heat generated by cars, which may have an impact on the peak air temperature [11, 12]. Additionally, layers of soil in ENVI-met can create a barrier while calculating the heat fluxes within the soil layers. However, if the models are detailed (based on the site measurements and available data) and well modified, the results of the microclimate estimation and the strategies used can be reliable [13, 14].
The UAE has started several initiatives in designing sustainable neighbourhoods. Mega cities like Dubai and Abu Dhabi have green standards in the urban planning sector and these are being extended to medium sized cities like Al Ain as well [15]. Implementation of such standards in urban planning or retrofitting existing infrastructure and buildings requires careful modelling of the local micro-climatic patterns [16]. In this study, the microclimate variation and UHI were assessed for Al Ain city using the LCZ mapping approach, while ENVI-met was used to model each of the LCZ considered in the study. The models were validated using local weather stations. Following the LCZ classification concept, the results of ENVI-met simulation were calibrated with the site measurements and this enabled to develop refined models which were applied to the entire city.
This study aims to create a map of the LCZ in the City of Al Ain and utilize the local microclimate classification to develop city scale microclimate simulation models. The city has a fast urban development which makes this study relevant for the region. Based on the WUDAPT categorisation of the LCZ, 12 zones were identified (6 related to build up zones and 6 to natural zones). Furthermore, level 0 of the LCZ classification scheme was used in this study. Level 0 data defines the city by the constituent neighbourhood types using the LCZ scheme [3]. The LCZ forms define the urban landscapes based on their impact on local air temperature; they are also correlated with values linked to urban form and function variables that can be used in other types of urban climate models. The steps of collecting Level 0 data are explained by Bechtel et al. [4]
The modelling work in ENVI-met recreates the built up zones based on site data. The software runs the simulations based on boundary conditions (measurements taken from the outskirts of the city; airport of Al Ain City in this case study). The results then are validated with the site measurements at predefined LCZ (United Arab Emirates University (UAEU) campus is considered in this case study). The simulations are carried out for two weeks in March, June, September, December 2019 (characteristic periods for spring, summer, autumn and winter seasons).
In this study, a relation between the results of the WUDAPT and ENVI-met is assumed. The densest areas (built up zones) historically have a higher surface temperature (and higher UHI) due to the impervious surfaces trapping more heat. The results of this study confirm the stated assumptions and can be applied in a larger context, meaning that the LCZ characteristics are similar in terms of the micro-climate.
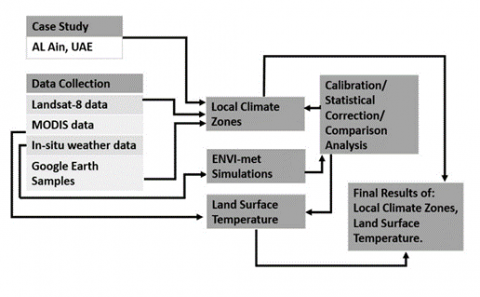
Referring to Figure 1, the organisation of this paper follows the below order:
Figure 1. Analysis of the methodology followed in this study [5]
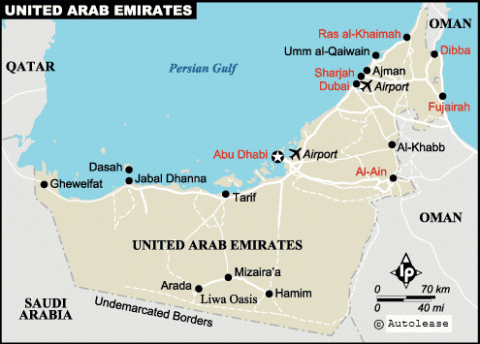
Figure 2. Al-Ain city location [17]
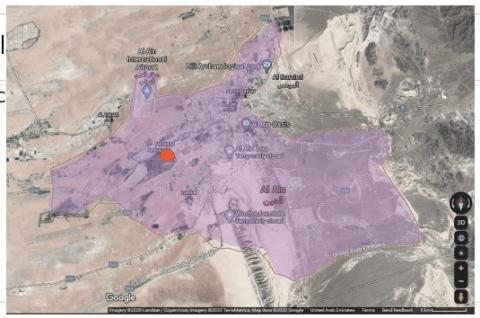
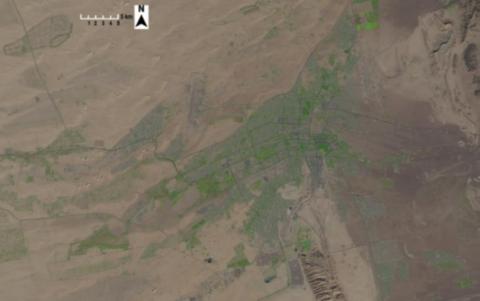
Al-Ain is a medium sized city in the southeast of the UAE and is close to the border of Oman (Figure 2). It has a unique microclimate compared to the larger coastal cities of the country that have high humidity levels. It is located deep in the desert with a hot and arid climate. The irrigated greenery around the city form evapotranspiration corridors and sources of humidity. The recent rapid urbanization of the city has led to the construction of neighbourhoods with various types of buildings. The six districts analysed in this study comprise most of the city's neighbourhoods. District 1: low-rise villas/buildings (maximum of three floors) that are spaced within an average range. The internal streets are paved, and trees are placed along the sides. District 2: low-rise buildings that are closely spaced and are mainly accommodated by ex-pats. District 3: high-rise villas/buildings characterize the newest type of neighbourhood in Al Ain, which is mainly developed to accommodate the increasing need for the growing population. District 4: central zone mid-rise buildings that are closely spaced, giving a high urban density for this area. District 5: massive villas with service buildings around them represents this kind of neighbourhood. The greenery is more compared to District 1, while the built-up area is smaller. District 6: Industrial zones that contain industries and warehouses, such as food production, car repair, agricultural machinery, etc. The main characteristics of these zones, which are found in the east and south of the city, are aluminium façades, asphalt streets, and no significant vegetation.
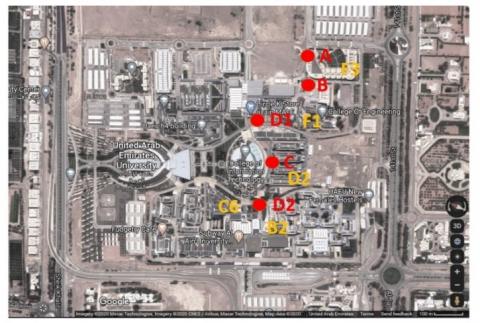
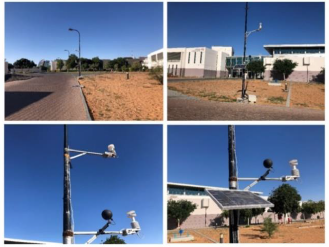
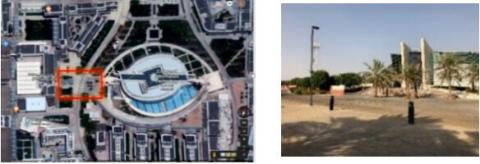
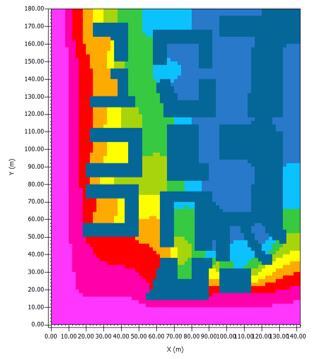
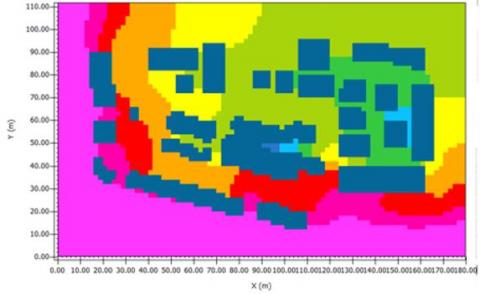
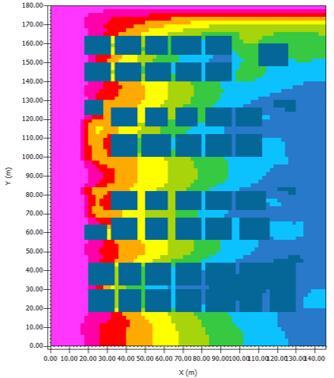
Site measurements were used to validate the CFD models used in ENVI-met. The measurements are acquired in UAEU (United Arab Emirates University) campus. The campus is located in the south west of the city (Figure 3). The characteristics of the campus are classified into LCZ1 in the WUDAPT classification. These values will be used to validate the ENVI-met models and to make a comparative analysis with LCZ map. The weather stations measure the air temperature, relative humidity, wind speed and air pressure (Figure 4). The sensors were installed in five different zones. Zone locations are shown in Figure 4. The site pictures of the sensors are shown in Figure 5 and Table 1.
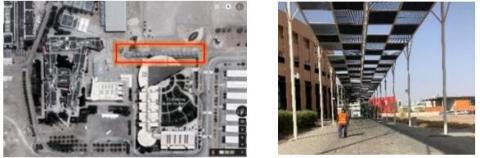
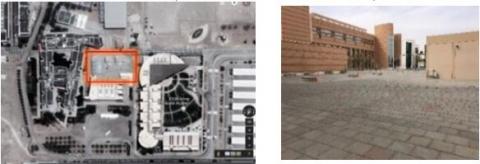
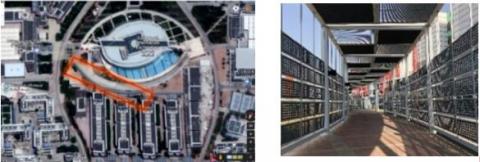
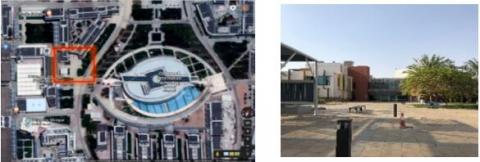
Zone A: A horizontal aluminium shading device is available. The overheating of the pavement is the main issue that affects pedestrians negatively. Zone B: The court of this area is exposed to direct solar radiation since shading devices and trees are not available. One static water body is available. A fountain would help create evaporative cooling to moisturize the dry air. Zone C: A horizontal aluminium shading device and side aluminium plates are available, which overheats the
path. The side panels help in providing shade and privacy due to the climate and cultural requirements. Zone D1: This zone has no shading devices but it is partially planted. Zone D2: This zone has no shading devices. It is near C6 building exit, in which there is no buffer zone. Figure 4 shows the type of the units installed in zone D1.
Figure 3. Location of the UAEU Campus in the city of AL Ain
Figure 4. Location of thesensors in the UAEU Campus
Figure 5. Site images of the installed sensor units
Table 1. Site location of the sensor units
|
Location |
Site pictures |
|
Zone A (24.196707, 55.681299) |
|
|
Zone B (24.196302, 55.680990) |
|
|
Zone C (24.196623, 55.677185) |
|
|
Zone D1 (24.196522, 55.676516) |
|
|
Zone D2 (24.197805, 55.679036) |
|
Two main software packages were used for the modelling, WUDAPT and ENVI-met.
5.1 WUDAPT software
WUDAPT is an open source network that supports the mapping of the cities in terms of LCZ. Defining the LCZ of a city such as Al Ain helps monitoring the expansion of the current and new areas. Moreover, it identifies the problematic zones in terms of UHI. WUDAPT is based on Google earth and SAGA software [10]. In this research, the LCZ zones are classified based on similar properties. An expert can define the domain enclosure and boundary of each zone based on the reorganization of the type of landscape and urban elements. Using Google Earth, the training areas are generated as polygons and then imported into SAGA software. Landsat 8 data (http://landsat.usgs.gov/landsat8.php) for the urban domain are then extracted and imported into the SAGA software, which has GIS and remote sensing capabilities. The LCZ training areas are then used to classify the entire urban domain into neighbourhood types, using a random forest classification scheme. The expert examines the map and adds to (or modifies) the LCZ training areas to account for misclassifications and repeats the process until satisfied. The accuracy of the final product is evaluated by comparing the predicted and observed LCZ type for selected areas.
The Weather Research and Forecasting Model (WRF) is a next-generation mesoscale numerical weather prediction system that is designed for both atmospheric research and operational forecasting applications. It consists of two dynamic cores, a data assimilation system and a software architecture supporting parallel computation and system extensibility. The model can be applied to a wide range of meteorological scenarios across various scales from tens of meters to thousands of kilometres. Simulations can be generated using the WRF that are based on actual or idealized climate conditions. It offers operational forecasting via a flexible and computationally efficient platform while reflecting recent advances in physics, numerical analysis and data assimilation contributed by developers from the wider research community. The operational WRF model is used to obtain simulations of various weather parameters, including the land surface temperature (LST). The LSTs used in this research were obtained from a 16 km2 grid size, in which the measured air temperatures were compared with the simulated LSTs to show that the air temperature measurements from our sensors follow both the rising and the falling trends in LSTs. The air temperature was above the LST in the morning and evening, and vice versa during the afternoon.
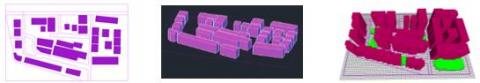
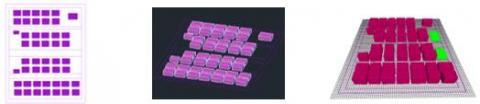
Table 2. ENVI-met simulations
|
Plan |
3D Cad |
3D ENVI-met |
|
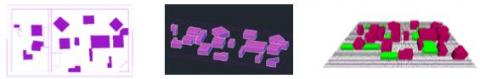
LCZ 1_Compact High-rise |
||
|
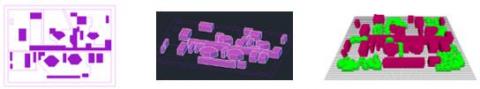
LCZ 2_Compact mid-rise |
||
|
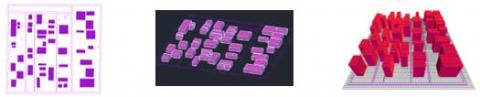
LCZ 3_Compact low-rise |
||
|
LCZ 6_Open low-rise |
||
|
LCZ 9_Sparsely Built |
||
|
LCZ 10_Heavy Industry |
||
5.2 ENVI-met simulations
ENVI –met is a CFD software largely used in the industrial and academic world into analysing air temperatures, mean radiant temperatures, outdoor thermal comfort etch. in a district level. In this research the software is used to measure the air temperature at the height of 1 meter from ground level and make a comparative analysis with the LCZ results. ENVI-met version used in this research is 4.0, which was used to model the six selected districts, as shown in Table 2. The models' walls and surface materials were detailed and modified from the default ENVI-met template to give more accurate simulation results. ENVI-met version 4.0 can run the simulation for 24/48 hours. To minimize the simulation time, the telescoping factor of the 3D model was chosen to be greater than 20 m, meaning that the 3D images used are simplified. Additionally, the size of the models was limited to 100 x 100, to reduce the simulation time. The simulations are done for week 1 and week 2 of the months of June and September, (as characteristic months for each season). Finally, the simulation results were compared with the LCZ and modified as per the proposed method .
The results are shown in two sections: the WUDAPT results and the ENVI-met results.
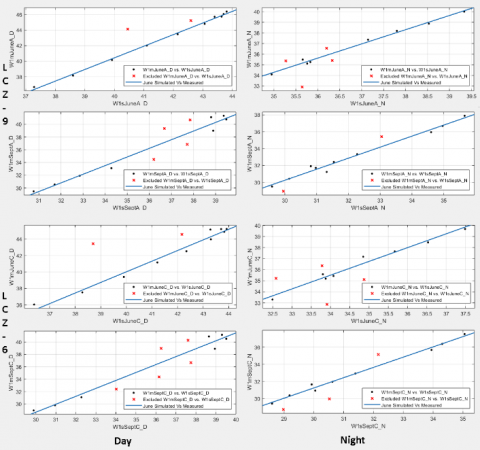
Our aim is to correct the ENVI-met simulation model based on in-situ measurement and then define coefficient of correction for temperature estimation across different LCZs. In this experimentation, we considered sensors ‘A’ and ‘B’ which are located in LCZ-9 (Sparsely Built) and sensors ‘C’ and ‘D’ located in LCZ-6 (Open Low-Rise) in the study area of UAEU Campus. Hence, we modelled and corrected one LCZ to come up with correction coefficients for temperature of LCZ ‘A’ consisting of sensors A and B. Similarly, we developed another correction coefficient for temperature of LCZ-6 consisting of sensors C and D as shown in Table (6).
Figure 6. Landsat images for the Al-Ain region
6.1 WUDAPT results
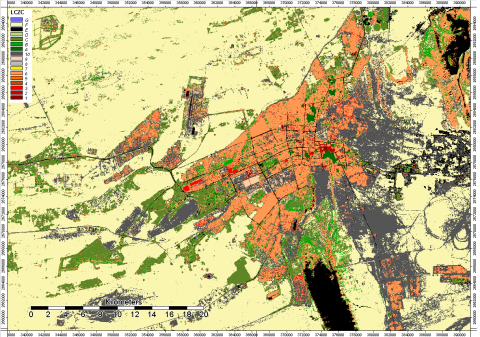
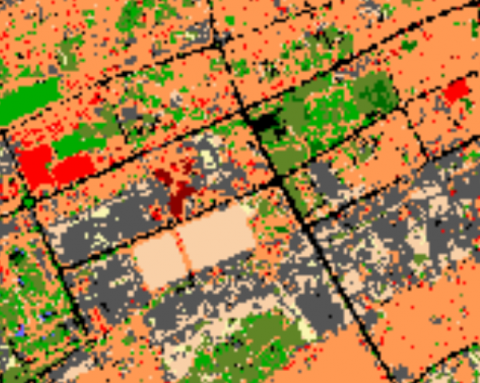
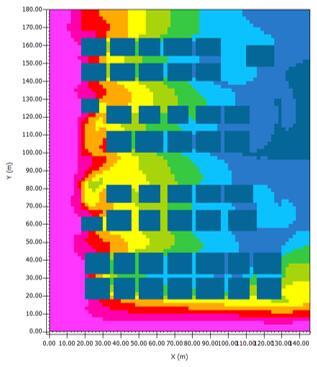
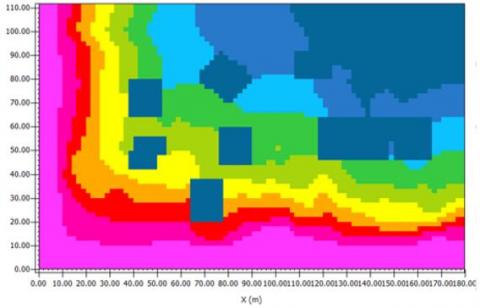
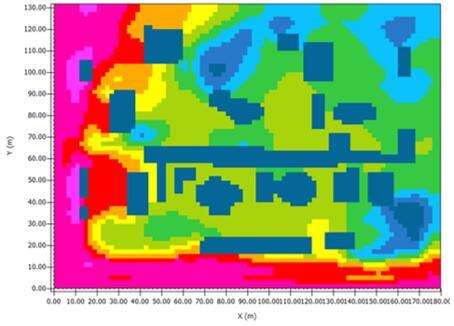
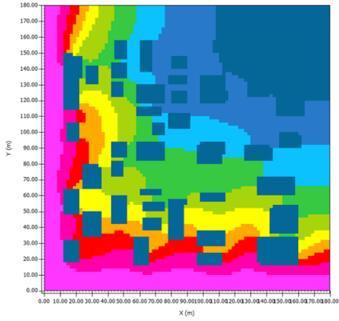
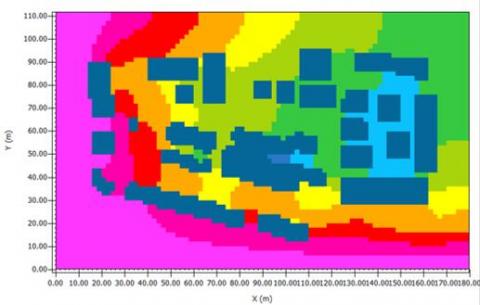
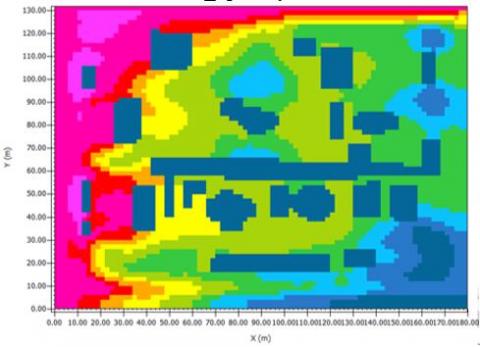
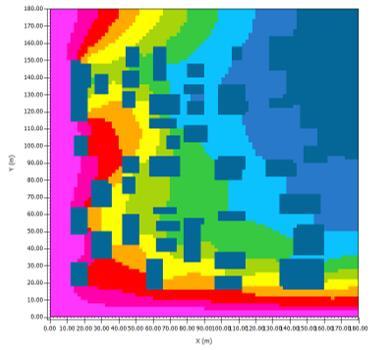
Landsat satellite data was used for the LCZ classification. Landsat 8's Operational Land Imager (OLI) uses improved sensors compared to previous versions. The main instrument includes the Thematic Mapper (TM) and the Enhanced Thematic Mapper Plus (ETM+), which provides data in eight bands with a spatial resolution of 30 m, a panchromatic band with a resolution of 15 m and a thermal infrared sensor with a spatial resolution of 100 m. The LCZ classification is carried out using SAGA software and the area is classified into six types of building zones and six land cover classes, based on the buildings' heights, land use and land cover areas. A minimum of three samples of each class were selected to ensure the results were accurate. Figure 6 shows a Landsat image of the city and Figure 7 shows the outcome of the LCZ for Al Ain City (Figures 8 and 9 show a central area of the city).
Figure 7. LCZ classification results for Al Ain
Figure 8. Satellite image acquired over the study area of Al Ain
Figure 9. Corresponding LCZ classification in the study area of Al Ain
6.2 ENVI-met results
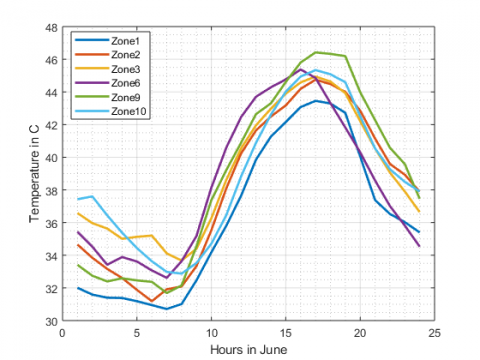
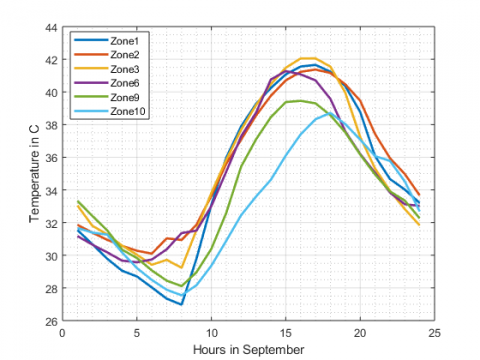
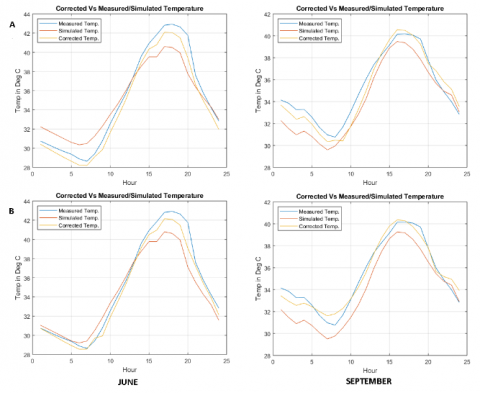
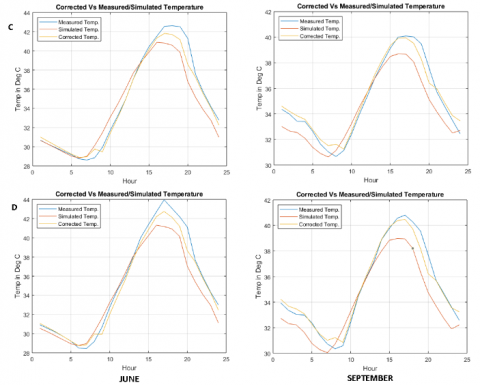
The study was carried out in the four main seasons: spring, summer, autumn, winter. Two weeks of data were considered: week 1: 14-19 of the month and week 2: 20-26 of the month. The months are June and September. The different air temperatures, at 1 m height, are shown in the ENVI-met simulation results. Based on the LCZ definition the site measurements taken in the UAEU campus (laboratory areas), it was assumed that all the measurements belong to sparsely built LCZs (i.e. LCZ-9). Figure 10 shows the non-corrected results of week 01 for all LCZ and Figure 11 shows the same for the second week of September. Table 3 shows the results for the peak hour of 2:00 pm for June and Table 4 shows the month of September. The graph shown in Figures 12 and 13 refers to the simulated values compared to the site measurements and corrected values for June and September, respectively. The ENV-met simulation of District 5 (pertaining to LCZ-6 and LCZ-9) was compared with the respective measurement taken in the UAEU Campus by sensors ‘A’, ‘B’, ‘C’ and ‘D’, with sensor ‘E’ being considered as boundary conditions for ENVI-met simulation. Week 1 data is used to create a model while Week 2 data is used for prediction for both June and September month. Figure 14 shows the linear modelling of the ENVI-met simulation against in-situ measurements. The obtained model is then used to correct the simulated ENVI-met temperature across same LCZ (Table 5). As a result, we see that sensors A and B that belongs to LCZ-9 has lower RMSE for the corrected model as compared to the actual simulated values against the measured temperature data (Table 6). Similarly, for LCZ -6 where sensors C and D are located, we achieved the similar results with reduced RMSE for corrected data in comparison to simulated ENVI-met data against measured data (Table 7). This indicates that ENVI-met simulation tends to under-estimate the in-situ measurements and hence, calibrated model needs to be used for better modelling.
Table 3. ENVI-met results for hour 14:00, June 2019
|
ENVI-met results for hour 14.00, June 2019 |
|
|
LCZ 1_Compact High-rise |
LCZ 2_Compact mid-rise |
|
LCZ 3_Compact low-rise |
LCZ 6_Open low-rise (3) |
|
LCZ 9_Sparsely Built |
LCZ 10_Heavy Industry |
Table 4. ENVI-met results for hour 14:00, September 2019
|
ENVI-met results for hour 14.00, September 2019 |
|
|
LCZ 1_Compact High-rise |
LCZ 2_Compact mid-rise |
|
LCZ 3_Compact low-rise |
LCZ 6_Open low-rise |
|
LCZ 9_Sparsely Built |
LCZ 10_Heavy Industry |
Figure 10. Comparison of LCZ for June 2019. Non corrected values
Figure 11. Comparison of LCZ for September 2019. Non corrected values
Figure 12. Comparison of ENVI-met results for sensors ‘A’ (top) and ‘B’ (bottom) in LCZ-9 for June (left) and September (right)
Figure 13. Comparison of ENVI-met results for sensors ‘C’ (top) and ‘D’ (bottom) in LCZ-6 for June (left) and September (right)
Figure 14. Error margin of ENVI-met versus site measurements (LCZ-9 top, LCZ-6 bottom)
Table 5. Corrected values of air temperatures for all LCZ for the month of June, September 2019
|
June_2019 |
|||||
|
24H average Simulation |
|||||
|
LCZ1 |
LCZ2 |
LCZ3 |
LCZ6 |
LCZ9 |
LCZ10 |
|
36.31 |
38.07 |
38.93 |
38.37 |
36.78 |
38.77 |
|
24H average Corrected |
|||||
|
37.89 |
39.65 |
40.51 |
39.95 |
38.36 |
40.35 |
|
UHI Values (Rural vs Corrected) |
|||||
|
-0.86 |
0.90 |
1.76 |
1.20 |
-0.39 |
1.60 |
|
September_2019 |
|||||
|
24H average Simulation |
|||||
|
34.62 |
35.42 |
35.08 |
34.61 |
33.51 |
32.97 |
|
24H average Corrected |
|||||
|
35.23 |
36.02 |
35.68 |
35.21 |
34.11 |
33.58 |
|
UHI Values (Rural vs Corrected) |
|||||
|
0.45 |
1.25 |
0.91 |
0.44 |
-0.66 |
-1.20 |
Table 6. The correction coefficient of LCZ-9 and LCZ-6 modelled in June and September for Day (9AM to 8PM) and Night (9PM to 8AM) time
|
Day Sensor A (LCZ-9) |
Night Sensor A (LCZ-9) |
|||
|
June |
Sept |
June |
Sept |
|
|
p1 |
1.497 |
1.357 |
1.335 |
1.309 |
|
p2 |
-19.43 |
12.61 |
-12.95 |
9.024 |
|
Day Sensor C (LCZ-6) |
Night Sensor C (LCZ-6) |
|||
|
June |
Sept |
June |
Sept |
|
|
p1 |
1.292 |
1.282 |
1.245 |
1.195 |
|
p2 |
-11.66 |
9.788 |
-6.829 |
4.608 |
Table 7. RMSE of corrected and simulated data against measured data for June and September
|
June RMSE |
Sept RMSE |
||||
|
Sensors |
Simulated |
Corrected |
Simulated |
Corrected |
|
|
LCZ-9 |
A |
1.66 |
0.86 |
1.36 |
0.76 |
|
B |
1.55 |
0.7612 |
1.49 |
0.58 |
|
|
LCZ-6 |
C |
1.56 |
0.72 |
1.26 |
0.52 |
|
D |
1.5 |
0.74 |
1.49 |
0.51 |
|
This study is an attempt to create a LCZ map for the city of Al Ain with a relation to the microclimate and UHI Phenomena. The climate zones were defined based on the LCZ definition. The site measurements were acquired and the temperature distribution simulation was carried out at different locations. This was done in two different software packages, WUDAPT and ENVI-met. Furthermore, ENVI-met models were developed for the studied LCZs and were calibrated using a statistical model based on accurate in-situ air temperature measurements taken from the UAEU Campus. The results show better accuracy in the cooler season. Based on the LCZ classification the validated area falls under the LCZ-6 and LCZ-9. While the LCZ classification helps understanding the distribution of the zones in the city scale, ENVI-met results help understand how the microclimate and the UHI phenomena are related to the LCZ typology in this specific city. As per the results in the month of June the highest values of UHI are found in LCZ-3, and the lowest value in LCZ-9. This can be explained by the high paved areas in the zone 3 and the highly vegetated areas in zone 9.
Meanwhile for the month of September LCZ2 has the highest UHI value and LCZ10 the lowest. This can be attributed to the wide asphalt streets in zone 2 and large distance between units (use of vegetation) in zone 10.
This study also focused on studying the seasonal effect of the UHI phenomena in order to understand the specific behaviour of the models and also based on the available data.
The outcome of this study will help in analysing different micro-climate scenarios in the city in order to reduce the UHI phenomena.
This study would have not been possible without support and funding from UAE University, Fund Code: 31N379 from Architectural Engineering Department, College of Engineering, United Arab Emirates University.
[1] Lauwaet, D., De Ridder, K., Saeed, S., Brisson, E., Chatterjee, F., van Lipzig, N.P., Maiheu, B., Hooyberghs, H. (2016). Assessing the current and future urban heat island of Brussels. Urban Climate, 15: 1-15. https://doi.org/10.1016/j.uclim.2015.11.008
[2] Stewart, I.D., Oke, T.R. (2012). Local climate zones for urban temperature studies. Bulletin of the American Meteorological Society, 93(12): 1879-1900. https://doi.org/10.1175/BAMS-D-11-00019.1
[3] Mills, G., Ching, J., See, L., Bechtel, B., Foley, M. (2015). An introduction to the WUDAPT project. In Proceedings of the 9th International Conference on Urban Climate, Toulouse, France, pp. 20-24.
[4] Bechtel, B., Alexander, P.J., Böhner, J., Ching, J., Conrad, O., Feddema, J., Mills, G., See, L., Stewart, I. (2015). Mapping local climate zones for a worldwide database of the form and function of cities. ISPRS International Journal of Geo-Information, 4(1): 199-219. https://doi.org/10.3390/ijgi4010199
[5] Manandhar, P., Bande, L., Tsoupos, A., Marpu, P.R., Armstrong, P. (2019). A Study of local climate zones in abu dhabi with urban weather stations and numerical simulations. Sustainability, 12(1): 1-15.
[6] Collins, J., Dronova, I. (2019). Urban landscape change analysis using local climate zones and object-based classification in the salt lake metro region, utah, USA. Remote Sensing, 11(13): 1615. https://doi.org/10.3390/rs11131615
[7] Wong, M.M.F., Fung, J.C.H., Yeung, P.P.S. (2019). High-resolution calculation of the urban vegetation fraction in the Pearl River Delta from the Sentinel-2 NDVI for urban climate model parameterization. Geoscience Letters, 6(1): 2. https://doi.org/10.1186/s40562-019-0132-4
[8] Makvandi, M., Li, B., Elsadek, M., Khodabakhshi, Z., Ahmadi, M. (2019). The interactive impact of building diversity on the thermal balance and micro-climate change under the influence of rapid urbanization. Sustainability, 11(6): 1662. https://doi.org/10.3390/su11061662
[9] Fonte, C.C., Lopes, P., See, L., Bechtel, B. (2019). Using OpenStreetMap (OSM) to enhance the classification of local climate zones in the framework of WUDAPT. Urban Climate, 28: 100456. https://doi.org/10.1016/j.uclim.2019.100456
[10] Demuzere, M., Bechtel, B., Mills, G. (2019). Global transferability of local climate zone models. Urban Climate, 27: 46-63. https://doi.org/10.1016/j.uclim.2018.11.001
[11] Bande, L. (2017). Heat island mitigation strategies, with focus on the urban shading devices. The case study of Abu Dhabi Main Island, United Arab Emirates. http://hdl.handle.net/10589/132660.
[12] Bande, L., Guerra Cabrera, A., Afshari, A., Martin, M. (2015). Evaluation of Smart Shading Structures in Mitigating Urban Heat Island in a district of a Hot Arid Climate City (Abu Dhabi). In ICUC9, pp. 1-6. http://hdl.handle.net/11311/983725.
[13] Thomas, A.E. (2013). Sustainable landscapes for residential neighborhoods in Dubai: An analysis of the relationship between ambient temperature and water requirements of landscape. http://bspace.buid.ac.ae/handle/1234/553.
[14] Roth, M., Lim, V.H. (2017). Evaluation of canopy-layer air and mean radiant temperature simulations by a microclimate model over a tropical residential neighbourhood. Building and Environment, 112: 177-189. https://doi.org/10.1016/j.buildenv.2016.11.026
[15] Department of Urban Planning and Municipalities - Estidama Services. (2020). Available: https://www.upc.gov.ae/en/upc-services-and-tools/services/estidama-services.
[16] Bande, L., Afshari, A., Al Masri, D., Jha, M., Norford, L., Tsoupos, A., Marpu, P., Pasha, Y., Armstrong, P. (2019). Validation of UWG and ENVI-Met models in an abu dhabi district, based on site measurements. Sustainability, 11(16): 4378. https://doi.org/10.3390/su11164378
[17] uae_map2.GIF.gif (495×355). (2020), Available: http://2.bp.blogspot.com/-zVv19hJ830g/Tehv8L7E55I/AAAAAAAABSs/IywvakxgufI/s1600/uae_map2.GIF.gif.
[18] Mouzourides, P., Eleftheriou, A., Kyprianou, A., Ching, J., Neophytou, M.K.A. (2019). Linking local-climate-zones mapping to multi-resolution-analysis to deduce associative relations at intra-urban scales through an example of Metropolitan London. Urban Climate, 30: 100505. https://doi.org/10.1016/j.uclim.2019.100505