Jun Zhang | Xiong He*
© 2020 IIETA. This article is published by IIETA and is licensed under the CC BY 4.0 license (http://creativecommons.org/licenses/by/4.0/).
OPEN ACCESS
In recent years, the center of city function has increasingly come into notice of the scholars, conforming to their purpose to describe the spatial structure of the city center more comprehensively. In this study, points of interest (POI) served as observation data to construct a framework for identifying and evaluating city function centers. As a typical plateau mountain city in western China, Guiyang possesses extremely special research value in urban planning and construction. The results of this study show that: the number of city function centers increased from 2016 to 2018, which manifested as polycentricity; their changes can be described in terms of quantity, pattern, and location; their morphological types were "relatively concentrated" and "relatively dispersed" in the process of urban evolution; and the types of location change were mainly displacement and splitting; spatial statistical analysis indicates that the change trend of city function centers will also be polycentric growth. In addition, the results of the study will have a positive impact on the subsequent urban planning and construction of Guiyang.
POI, polycentricity, city function, spatial structure, urban morphology
For Chinese cities, whose urban spatial diffusion process and multi-center formation process are not very same as those in countries such as Europe and the America, the reasons that hinder their spontaneous expansion are twofold: one is that the Chinese government plays an important role; the other is the land system, that is, the dual structure of urban-rural isolation [1]. Therefore, the spatial structure of urban centers in China has always been an important subject in academic fields such as urban planning and urban geography [2]. Currently, the extensive studies related to it mainly focused on two aspects which were morphological dimension and functional dimension. [3, 4]. However, most empirical researches only concerned one single attribute, such as population [5], architectural environment, etc. [6], and seldom considered the comprehensive functions of the center. Nevertheless, urban centers are characterized by the diversity of human activities, which is exactly the versatility proposed by the new urbanism theory [7]. And the principle of urban planning is also the mixed use of urban space.
When it comes to large urban systems with different scales, there are limited researches on urban function centers currently. But new types of data, such as Point of interest, can provide interesting insights into the identification and evaluation of urban function centers from the perspective of human activities and corresponding physical properties. This study proposes an intuitive methodology framework to identify and evaluate urban function centers with POI, and takes Guiyang as a study point. Two questions are mainly answered from the morphological dimension of urban structure of inner space in Guiyang: (1) evaluation of city function with polycentricity; (2) change trend of city function with polycentricity.
2.1 Application of emerging data in cities
Traditional research data, including statistical yearbook and census data, have shown great inadaptability in current urban research. In recent years, analyzing the spatial structure of cities with urban big data has provided a new research paradigm and perspective for urban research. The current widely used urban data includes rail transit card data, mobile signaling data, network review data, thermal map data, etc. [8-11], A large number of Chinese scholars, including Long and Zhen [12, 13], took the advantages of these new data to explore the urban space, and summed up plenty of new theoretical and methodological models. However, in China, there are still problems for these urban big data in obtaining difficulty, less acquisitive methods and confidentiality protection, which plague the researchers. Withal, POI data based on open-source mapping provides an accurate and effective alternative. First, the POI data is a virtual abstract representation of the real geographic entity in space, which equipped with spatial attribute information. Secondly, it is large in quantity and easy to obtain, which makes it gradually become one of the important data in urban research [14]. Based on the POI data, scholars have concentrated on the exploration of the formation of urban space [15], the identification of urban functional areas [16], etc., and because of its good research performance, it has begun to be widely used in urban research [17].
2.2 Central identification and temporal evolution method
It is noteworthy that different methods are applicable to different types of data, and what this study emphasizes is the central population, the activities taking place in the center, and the physical properties of the center itself.
(1) In 1991, Giuliano developed a central identification method based on the minimum cut-off point of the employment density of regional personnel [18], which was then subsequently widely used [19]. This method mainly determines a group of continuous plots as a center, whose minimum employment density is D and the minimum total employment number is E, and achieves the purpose by judging the cut-off point of the two indicators, but the set threshold value will produce obvious differences to the research results. Different from the method that requires uniform setting of minimum cut-off value, Agarwal et al. proposed a density gradient value based on estimation [20] to determine the center in 2012, including determining the sub-center by local peaks [21]. However, the use of this method requires more detailed local knowledge to ensure the accuracy of peak selection, thus, it can also become the method with least efficiency and accuracy when applied in more cities. Li et al. identified 658 Chinese cities based on the population distribution reflected in Baidu heat map [22], and through detailed grid population data, the diversity of the centers of 318 cities in China was further identified [23]. These results allowed the center identification program to be applied to numerous cities and regions without requiring much local knowledge. Based on the existing urban center identification methods, the exploration of cities is still subjective and inaccurate [24].
(2) The trend of urban spatial structure and the correlation of urban geographical space can be an enormous challenge which derives from a fact that static or aggregated measurement cannot reveal the real impact of clustering [25]. Therefore, it is necessary to provide a method to analyze its dynamic evolution and correlation in a short time [26]. At present, most researches adopt the correlation methods of spatial statistical analysis, which mainly tend to reveal the correlation in geographical space location. Therefore, most researchers begin to try global and local statistics to describe its change trend [27]. For instance, Malleson explored the changing trend of crime rate in a space through visualization of getis-ord Gi* and charts, which effectively reduced the risk of criminal events [28]. And Mazzulla tested the travel space with getis-ord General G, and described its growth trend in detail through the expression of temporal atlas [29]. In a word, spatial statistical analysis can all serve well in promoting the trend assessment of elements in geographical space [30, 31].
3.1 Research area
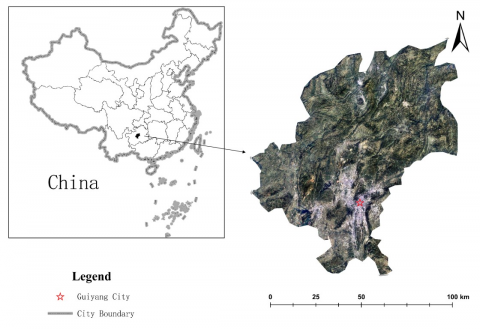
Guiyang has a special geographical location, which is located in the southwest of China, on the eastern side of the Yunnan-Guizhou plateau. It is a typical plateau mountain city whose average altitude is 1250 meters, and covers an area of 8034 square kilometers of which the urban area is 2,403 square kilometers. By the end of 2018, with a resident population of 4,881,900, Guiyang reached a GDP of 379.845 billion yuan whose growth rate ranked second in China's cities. As one of the core cities in western China, Guiyang has ushered in new development opportunities and challenges with the steady progress of national strategy such as Belt and Road and West Development (Figure 1).
With the official release of Guiyang City Master Plan 2011-2020 (Revised 2017), Guiyang will be transformed into a political, economic, cultural, scientific, educational and tourism service center in Guizhou Province. It will become an important transportation hub for the inland and coastal openness of western China. As a demonstration area for big data comprehensive innovation and an important demonstration zone for the transfer of scientific and technological achievements, it will build a new pattern of harmonious development between man and nature. From this point of view, the value to study the city function polycentricity of Guiyang is more prominent.
Figure 1. Research area
Table 1. POI categories and quantities in 2016 and 2018
|
Category |
Subcategory |
Quantities in 2016 |
Quantities in 2018 |
|
public |
road facilities |
4958 |
7961 |
|
public utilities |
21963 |
40891 |
|
|
transportation facilities |
9881 |
10927 |
|
|
access facility |
3269 |
4096 |
|
|
government agencies and groups |
897 |
903 |
|
|
science and education culture |
1907 |
2007 |
|
|
life |
catering services |
100932 |
120894 |
|
shopping |
23914 |
30987 |
|
|
medical insurance |
1003 |
1308 |
|
|
leisure |
resort and recuperation |
2973 |
2998 |
|
golf |
34 |
34 |
|
|
entertainment venue |
10034 |
11087 |
|
|
sports venue |
875 |
901 |
|
|
resident |
community |
5903 |
6032 |
|
villa area |
580 |
601 |
|
|
dormitory |
1820 |
1897 |
|
|
business |
company |
7001 |
7009 |
|
enterprise |
6603 |
6618 |
|
|
bank |
781 |
802 |
3.2 Point of interest in 2016 and 2018
The POI located in the city both in 2016 and 2018 were provided by Amap, which also had been verified and geocoded. POI data with spatial attributes and location information of urban object entities has previously been widely used in urban navigation systems geographically. Therefore, it can be considered that the selected POI has covered all urban functions of the research area. According to different functions provided by the city, and simultaneously considering the classification of the navigation in Amap, a total of 19 POI including ancillary road facilities, public utilities, transportation facilities, traffic facilities, government agencies and social organizations, science and education, cultural services, catering services, shopping services, health care, vacation retreat, golf related, entertainment, sports venues, residential, villa, dormitories, companies, enterprises and banks are divided into five urban functions which are public, life, leisure, resident, business functions. The specific categories and quantities are shown in Table 1. The data infer that the number of POI in 2016 was 205328, and that in 2018 was 257953 which means a year-on-year increase of 52625, and living functions occupy the largest proportion in cities.
There are two main objectives in this study: The first is to determine the city function center of Guiyang, China, and the second is to explore the changing trend of the function center.
The first objective identifies the city center by the point density peak of the POI. The point density in the city is first calculated to generate a continuous density surface in the area, which is then divided into 10 categories with natural breaks (Jenks), and on each surface according to the standard of no more than 20% density difference to determine the city function center.
The second objective make use of the Getis-Ord General G and Getis-Ord Gi* to explore global and local geographic features, structural patterns, and spatial clustering in Guiyang.
Getis-Ord General G:
$G(d)=\sum \Sigma w_{i j}(d) x_{i} x_{i} / \sum \Sigma x_{i} x_{i}$ (1)
where, d is the distance to the urban center of Guiyang, China; $w_{i j}(d)$ is the spatial weight within the study area; $x_{i}$ and $x_{j}$ are the index of urban land extension intensity respectively. Under the assumption of space non-agglomeration, the expected value of $G(d)$ is $E(G)$:
$E(G)=W /[n(n-1)] \quad w=\sum \Sigma w_{i j}(d)$ (2)
Under the condition of normal distribution, the statistical test value of $G(d)$ is $Z(G)$:
$Z(G)=[G-E(G)] / \sqrt{\operatorname{Var}(G)} \quad\left[E(G)=W_{n}(n-1)\right]$ (3)
When $G(d)$ is higher than $E(G)$ and $Z(G)$ value is significant, high-value clusters appear in the study area. When $G(d)$ approaches $E(G)$, the variables in the research area show a random distribution.
The expression for Getis-Ord Gi* is:
$Z\left(G_{i}^{*}\right)=\sum_{j}^{n} w_{i j}(d) x_{j} / \sum_{j}^{n} x_{j}$ (4)
5.1 City function center in 2016 and 2018
The results show that the urban space of Guiyang in 2016 and 2018 presents an obvious multi-center structure. In the urban space of 2016, there were 5 city function centers, and 6 in 2018, which is shown in Figure 2, city function centers and density distribution.
Figure 2. 2016 (a, c) and 2018 (b, d) city function polycentricity
5.2 Evaluation of city function centers
Based on the city function centers determined by the POI density graphs in 2016 and 2018, there are three major changes in quantity, form and location highlighted to explore the temporal changes.
5.2.1 Changes in the number of city function centers
The point density graph shows that in 2016 and 2018, there was only one city function center in a large-scale area. The detailed number of function centers in two years was determined by the ratio of area to density. Changes in quantity can be expressed as: constant, increase and decrease. As can be seen from Figure 2, in the urban spatial structure from 2016 to 2018, the number of city function centers increased from 5 to 6 with an upward trend.
5.2.2 Morphological changes of city function centers
The morphological changes of urban space can refer to the changes of land use scale and land use intensity, which are specifically expressed by the ratio of total area to average area (FAR). In contrast, the total area change trend of the functional center can be used to represent the scale of change, making the density change of the POI instead of the ratio of the total area to the average area. Although the change of POI density of functional centers is not equivalent to the change of FAR (because the change of POI does not directly affect the change of FAR), POI can directly express the functions of cities, so the change of POI density is more important and direct to the morphological change of urban functional centers. Since the density distribution of urban space POI is diverse, only the multi-center city functions proposed in Figure 2 are selected to calculate the area difference and POI density ratio.
Change in scale: Compared with the 5 city function centers in 2016, 2 of them were expanded in 2018, 3 were reduced, and an extra center was added. The calculation results of area difference show that the maximum rate of change of a single urban function center is 49.33% and the overall rate of change is 11.29% within two years.
Change in intensity: No matter the city function centers are expanded or reduced, the POI density at the regional scale will increase. Except for the newly added urban functional centers in 2018, the remaining 5 have reasonably increased the POI density at the regional scale with a ratio of 1.258. Two types of morphological changes can be derived by combining scale changes and intensity changes. One is that the densification of POI leads to the development of city function centers; the other is that the densification of POI leads to their reduction. In the first type, POI gathers around the original city function center more rapidly, which increases its expansion. The second may cause POI to gather more rapidly around the new function center, or reduce the amount of POI around the original function center, all of which lead to the difference of the area around the new function center.
These two morphological changes are manifested in different stages of urban function development. In theory, the morphological relationship between city function centers and surrounding areas is highly similar to the relationship between urban areas and suburban areas. Therefore, in the development of cities, it is available to verify the relationship between the above two kinds of morphological changes in the center of the city function with city evolution process.
The urban evolution model was proposed by Peter in 1984. Based on the mutual dynamic migration between urban areas and suburbs, it can be divided into six stages: "concentration", "relative concentration", "absolute concentration", "dispersion", "relative dispersion" and "absolute dispersion". Therefore, those can be used to verify the two morphological changes of functional centers. The center growth caused by the densification of the first type of POI is "relatively dispersed", and the center reduction caused by the densification of the second type is "relatively concentrated".
5.2.3 Changes in the location of city function centers
Carefully observe the location changes of all city function centers in Figure 2, it is found that there are four kinds of location changes: displacement, splitting, emerging and declining. And most of the function centers have been shifted, not simply concentric growth or shrinkage. Except the change of displacement, the other three types are related to the number of functional centers. Specifically, splitting and emerging have led to an increase in function centers, and recession has led to a decrease. By calculating the centroid changes in each function center, we can see that from 2016 to 2018, the average distance of the centroids is reduced by 7.2 km, which indicates that the function centers are close to each other. This trend affects the development of the function center, and will also be specifically discussed in the next step.
5.3 The trend of city function centers
Create nets based on the study area to connect the POI. Getis-ord General G and getis-ord Gi* of city function centers in Guiyang were calculated by taking the agglomeration degree of POI as a variable, so as to describe the spatial correlation degree and development trend of city function centers.
Global pattern features: As can be seen from Table 2, in 2016 and 2018, the observation G(d) of global statistical indicators of Guiyang city function center were all greater than the expected value E(d) and the Z score was obvious, which indicated that there was an obvious high/low clustering phenomenon in urban space. The increase of Z value indicates that the polarization of function center is strong and the agglomeration degree is obvious during the observation period.
Pattern evolution of Hot Spot: The calculation results of Getis-Ord Gi* can be used for trend analysis based on the pattern evolution. Therefore, the number of POI increased from 2016 to 2018 is used as the calculation data of Getis-Ord Gi*, and the mapping is performed by ArcGIS. The Hot Spot and Cold Spot distribution maps of the development trend of Guiyang city function center (Figure 3) clearly reflect the evolution process. The results are as follows.
Table 2. Getis-ord general G index in 2016 and 2018
|
Function center |
||
|
2016 |
Observation G(d) |
0.000087 |
|
Expected value E(d) |
0.000019 |
|
|
Z score |
154.7656 |
|
|
2018 |
Observation G(d) |
0.000072 |
|
Expected value E(d) |
0.000018 |
|
|
Z score |
156.7536 |
Strength: Both Hot Spot and Cold Spot show the change trend of POI quantity in this region in the past two years. The number of POI in Hot Spot accounts for 79.68% of the number of POI from 2016 to 2018, while the number of Cold Spot accounts for 11.37%. The POI intensity in Hot Spot is significantly higher than that in Cold Spot. This reflects the fact that, within two years, the center of city function POI amount shows an obvious increasing trend, which is mainly concentrated in three major city function centers, manifesting a polycentric trend. The increasing trend in the rest regions is not obvious and even declined, which proves once again the role of central polarization in urban development.
Figure 3. Trends in growth POI from 2016 to 2018
It can be concluded from Getis-Ord General G and Getis-Ord Gi* that the urban spatial structure of Guiyang has a clear growth trend from 2016 to 2018. The changes of function centers caused by POI are also obvious, that is, the growth trend of city function centers will also be accompanied by polycentricity over time.
Through POI, this study identified the city function center and its change trend of Guiyang, China. According to the research, first of all, functional centers show the functional diversity of city centers, and the previous methods and data are not enough for accurate identification and judgment. Through emerging data represented by POI, most city functions are expressed objectively, and the identified city function centers also have high credibility. Secondly, it can avoid the errors brought by previous methods, including the subjective arbitrary setting of the regional threshold and the scale effect in the spatial scale. The practical case of Guiyang reveals the value of this study, which can be used to conduct further research on a large number of cities, thus providing reliable and effective practical experience for solving the research on the spatial structure characteristics of Chinese cities. Finally, the administrative boundary is not used as the research area as usual in Chinese cities, but the actual functional area of the city is replaced, which makes the analysis results more objective and to some extent explains the differences between Chinese cities and those in European and American before.
Of course, there are still some shortcomings need to be improved in this study. First, the study only considers the area and density of each city function center, and these methods are not substitutable. For example, land use classification can be verified through remote sensing images. Besides, the number of POI in city function centers is not homogeneous in each city function category. In this study, the number of POI of life function occupied the largest proportion, while the proportion of POI of leisure and business was less than 10%. However, they were all treated equally without considering whether each type of POI should be weighted and averaged according to the proportion of quantity. These problems need to be further explored in the following research.
The emerging data headed by POI provides a brand-new research perspective and paradigm for the study of urban spatial structure. Both the ideas and methods of urban planning have been greatly changed, and the new innovation is undoubtedly facing great challenges. This study attempts to make use of new data to innovate research, so it focuses on the morphological dimension of urban internal scale and urban spatial structure. However, compared with the traditional research, such kind is still less, which needs to be further deepened by continuous theoretical supplement. Finally, when considering the regional area and density ratio of POI, it only limits the regional area preliminarily. Based on the focus of this study is morphological change, further studies are needed to solve the problem of regional area ratio.
Based on the city functions classified by Amap, this study identifies the city functional centers of vital significance to urban planning and urban spatial structure, and discusses the spatial structure of the city function centers in Guiyang, China. Over the human-related activities, physical attributes assessment and the utilization of POI data, the results of city function center in Guiyang show that the identification and evolution of city function centers need to be determined through the quantity, form and location, and the evaluation and trend of urban functional centers need to be described by spatial analysis.
First of all, the number of city function centers increased from 2016 to 2018, indicating that Guiyang is developing towards city function with polycentricity. Secondly, the morphology of city function centers is characterized by the growth and contraction of densified centers, which can be described as "relatively dispersed" and "relatively concentrated" by referring to the urban evolution model. Finally, the location changes of urban function centers are mainly displacement and division. In addition to the above identification and observation, the evolution trend of city function centers is discussed through spatial statistical analysis whose results show a multi-centered growth trend. All these can provide certain guiding value to the following urban planning revision and urban construction in Guiyang.
By summarizing the analysis results of this study, a general method for the calculation of urban spatial structure in China can be obtained, and its results will also give a guidance to urban development and urban planning from an objective perspective.
This study would like to express our sincere gratitude to Amap which provides us the research data.
[1] Zhao, S., Zhou, D., Zhu, C., Sun, Y., Wu, W.J., Liu, S.G. (2015). Spatial and temporal dimensions of urban expansion in China. Environmental Science & Technology, 49(16): 9600-9609. https://doi.org/10.1021/acs.est.5b00065
[2] Ou, J.P., Liu, X.P., Li, X., Chen, Y.M. (2016). Quantifying spatiotemporal dynamics of urban growth modes in metropolitan cities of China: Beijing, Shanghai, Tianjin, and Guangzhou. Journal of Urban Planning and Development, 143(1): 04016023. https://doi.org/10.1061/(ASCE)UP.1943-5444.0000352
[3] Burger, M., Meijers, E. (2012). Form follows function? Linking morphological and functional polycentricity. Urban Studies, 49(5): 1127-1149. https://doi.org/10.1177/0042098011407095
[4] Vasanen, A. (2012). Functional polycentricity: Examining metropolitan spatial structure through the connectivity of urban sub-centres. Urban Studies, 49(16): 3627-3644. https://doi.org/10.1177/0042098012447000
[5] Li, J., Li, M.Y., Long, Y., Dang, A.R. (2016). China polycentric cities based on Baidu heatmap. Shanghai Urban Planning Review, 3: 30-36.
[6] Taubenböck, H., Standfuß, I., Wurm, M., Krehl, A., Sidentop, S. (2017). Measuring morphological polycentricity-A comparative analysis of urban mass concentrations using remote sensing data. Computers, Environment and Urban Systems, 64: 42-56. https://doi.org/10.1016/j.compenvurbsys.2017.01.005
[7] Grant, J. (2002). Mixed use in theory and practice: Canadian experience with implementing a planning principle. Journal of the American Planning Association, 68(1): 71-84. https://doi.org/10.1080/01944360208977192
[8] Wu, Z.Q., Ye, Z.N. (2016). Research on urban spatial structure based on Baidu heat map: A case study on the central city of Shanghai. City Planning Review, 40(4): 33-40. https://doi.org/10.11819/cpr20160407a
[9] Cai, J.X., Huang, B., Song, Y.M. (2017). Using multi-source geospatial big data to identify the structure of polycentric cities. Remote Sensing of Environment, 202: 210-221. https://doi.org/10.1016/j.rse.2017.06.039
[10] Yang, X., Wang, D., Jia, F. (2019). Exploring the disparities in park access through mobile phone data: Evidence from Shanghai, China. Landscape and Urban Planning, 181: 80-91. https://doi.org/10.1016/j.landurbplan.2018.09.013
[11] He, X., Yang, Z.J., Zhang, K., Yang, P., Zhang, S. (2018). The spatial distribution patterns of the catering trade in Nanchang based on internet public reviews. International Journal of Technology, 9(7): 1319-1328.
[12] Long, Y., Zhang, Y., Cui, C.H. (2012). Identifying commuting pattern of Beijing using bus smart card data. Acta Geographica Sinica, 67(10): 1339-1352. https://doi.org/10.11821/xb201210005
[13] Zhen, F., Wang, B., Chen, Y.X. (2012). China's city network characteristics based on social network space: An empirical analysis of Sina micro-blog. Acta Geographica Sinica, 67: 1031-1043.
[14] Yu, W.T., Ai T.H., Liu, P.C., He, Y.K. (2015). Network kernel density estimation for the analysis of facility POI hotspots. Acta Geodaetica et Cartographica Sinica, 44(12): 1378-1383. https://doi.org/10.11947/j.AGCS.2015.20140538
[15] Ding, B.C., Liu, Y.X., Chen, G. (2018). Urban spatial structure of port city in South China Sea based on spatial coupling between nighttime light data and POI. Journal of Geo-Information Science, 20(6): 854-861. https://doi.org/10.12082/dqxxkx.2018.180020
[16] Chen, Z.D., Qiao, B.W., Zhang, J. (2018). Identification and spatial interaction of urban functional regions in Beijing based on the characteristics of residents' traveling. Journal of Geo-Information Science, 20(3): 291-301. https://doi.org/10.12082/dqxxkx.2018.170531
[17] Zhai, W., Bai, X., Shi, Y., Hna, Y., Peng, Z.R., Gu, C.L. (2019). Beyond Word2vec: An approach for urban functional region extraction and identification by combining Place2vec and POIs. Computers, Environment and Urban Systems, 74: 1-12. https://doi.org/10.1016/j.compenvurbsys.2018.11.008
[18] Giuliano, G., Small, K.A. (1991). Subcenters in the Los Angeles region. Regional Science and Urban Economics, 21(2): 163-182. https://doi.org/10.1016/0166-0462(91)90032-I
[19] Giuliano, G., Redfearn, C., Agarwal, A., Li, C. (2007). Employment concentrations in Los Angeles, 1980-2000. Environment and Planning A, 39(12): 2935-2957. https://doi.org/10.1068/a393
[20] Agarwal, A., Giuliano, G., Redfearn, C.L. (2012). Strangers in our midst: the usefulness of exploring polycentricity. Annals of Regional Science, 48(2): 433-450. https://doi.org/10.1007/s00168-012-0497-1
[21] Craig, S.G., Ng, P.T. (2001). Using quantile smoothing splines to identify employment subcenters in a multicentric urban area. Journal of Urban Economics, 49(1): 100-120. https://doi.org/10.1006/juec.2000.2186
[22] Li, J., Cao, Q., Lu, S., (2016). History of natural gas accumulation in Leshan-Longnyusi Sinian paleo-uplift, Sichuan Basin. Oil & Gas Geology. https://doi.org/10.11743/ogg2016020105
[23] Liu, X., Wang, M. (2016). How polycentric is urban China and why? A case study of 318 cities. Landscape and Urban Planning, 151: 10-20. https://doi.org/10.1016/j.landurbplan.2016.03.007
[24] Erhan, L., Ndubuaku, M., Ferrara, E., Richardson, M., Sheffield, D., Ferguson, F.J., Brindley, P., Liotta, A. (2019). Analyzing objective and subjective data in social sciences: Implications for smart cities. IEEE Access, 7: 19890-19906. https://doi.org/10.1109/ACCESS.2019.2897217
[25] Sun, L., Jin, J.G., Axhausen, K.W., Lee, D.H., Cebrian, M. (2015). Quantifying long-term evolution of intra-urban spatial interactions. Journal of the Royal Society Interface, 12(102): 20141089. https://doi.org/10.1098/rsif.2014.1089
[26] Han, R., Cao, H., Liu, Z. (2018). Studying the urban hierarchical pattern and spatial structure of China using a synthesized gravity model. Science China Earth Sciences, 61(12): 1818-1831. https://doi.org/10.1007/s11430-016-9191-5
[27] Yao, X., Zeng, J., Li, W. (2015). Spatial correlation characteristics of urbanization and land ecosystem service value in Wuhan Urban Agglomeration. Transactions of the Chinese Society of Agricultural Engineering, 31(9): 249-256.
[28] Malleson, N., Andresen, M.A. (2015). The impact of using social media data in crime rate calculations: shifting hot spots and changing spatial patterns. Cartography and Geographic Information Science, 42(2): 112-121. https://doi.org/10.1080/15230406.2014.905756
[29] Mazzulla, G., Forciniti, C. (2012). Spatial association techniques for analysing trip distribution in an urban area. European Transport Research Review, 4(4): 217-233. https://doi.org/10.1007/s12544-012-0082-9
[30] Baker, A., Brenneman, E., Chang, H., McPhillips L., Matsler, M. (2019). Spatial analysis of landscape and sociodemographic factors associated with green stormwater infrastructure distribution in Baltimore, Maryland and Portland, Oregon. Science of The Total Environment, 2019, 664: 461-473. https://doi.org/10.1016/j.scitotenv.2019.01.417
[31] Otiomxa, C., Madureira, A.M., Martinez, J. (2019). Spatial analysis of urban digital divide in Kigali, Rwanda. GeoJournal, 84(3): 719-741. https://doi.org/10.1007/s10708-018-9882-3