Alejandro Acosta Collazo
© 2020 IIETA. This article is published by IIETA and is licensed under the CC BY 4.0 license (http://creativecommons.org/licenses/by/4.0/).
OPEN ACCESS
The interpretation of the historic centre has changed lately and ‘a limited part of the city’ became a better definition in this paper to analyse the relationship among the cultural heritage, the increasing mobility, commercial shops, housing and factories, with land use in the core of the city. Mobility and commercial became a factor of transforming public and private places in the ‘limited part of the city’. It includes 126 city blocks. Hence, two data tables and two figures were elaborated to accumulate the significant information obtained. Also, the data was highlighted to facilitate the analysis in such tables. The results and the discussion demonstrated that the main consequences of land planning and mobility are the decay of population and the loss of historic buildings; also, the preferences on remodelling historic sites in local city planning, as well as the importance of streetscapes with historic façades, but with no historic built structures inside the buildings. It is through the identification of parking lots, land use, historic drawings, a cadastral plan and historical population data that the loss of this type of architecture could be determined. Furthermore, the analysis showed the lack of clean mass transit systems in the city.
land use planning, mobility, historic preservation, circular economy
First ideas of this paper were published in the WIT Transactions on The Built Environment, by the WIT Press [1].
Through the analysis of the environmental design and city planning, the interpretation of the historic centre of Aguascalientes has changed recently. During the last 30 years, the planning of urban spaces has also modified the historic buildings dramatically. In the year of 1990 the city planners recognized the first limits of the historic place. Even though, the limited area was too small to include the whole historic centre, so they chose some iconic buildings to be protected by law against demolition.
Throughout the last two decades the concept of ‘historic centre’ has also been discussed to study correctly the oldest urban structures of towns. In order to find a better way to study such places, nowadays with the help of Geographic Information Systems it’s possible to set ‘a limited part of the city’. As an example of Latin America, Aguascalientes was chosen to discuss if it were possible to achieve a circular economy and cultural sustainability inside the city centre.
Nowadays in Mexico, a city planning problem is that frequently vehicles are considered more important than pedestrians. Cars enter the historic centre and easily find a way to park, because private interests provide parking lots, no matter if they had to tear down some historic buildings. Parking lot size is a variable also evaluated in this paper.
Electric cars cause little noise, no pollution, and are an ethical solution for the discomfort of actual mobility problems in the suburbs and heritage areas of the city, but most of the people still drive gasoline and diesel vehicles in Aguascalientes, so air pollution has become a problem lately. This is part of the idea in having a circular economic process. This means the cars produce part of their energy when they function, generating lower climate change emissions. So, the use of electric or hybrid vehicles is a good idea to preserve the historic centre, following also a circular economic model. Also, if it is possible to reduce the mobility of cars in the ‘limited part of the city’, the pedestrians will have cleaner historic spaces to enjoy.
For this paper, it was better to study certain phenomena in the city by establishing a specific urban area. Aldo Rossi once recommended studying a city in ‘limited parts’. This criterion was used in the writing of this paper. Basically, a historic drawing of Aguascalientes was used as a base to determine the existing buildings at a moment in time (Figure 1).
The entire statistical universe is the ‘limited part of the city’, which includes the streets and the areas of the city blocks. In this case there won’t be a data sample, because it was possible to collect the whole data of the selected ‘part of the city’ and it represented a manageable size. The statistical method mainly used the areas of the city blocks. So the study of all the city blocks became a census, which includes a complete count. This means the analysed data became more reliable and accurate. A cadastral plan –made in 1998– was very useful to identify the land use. Also the new data obtained in the year of 2018 was used to compare the changes in land use –after 20 years. It’s important to mention a historic drawing (from 1855) was used to set the ‘limited part of the city’ of Aguascalientes. This graphic representation, originally drawn by the geographer Isidoro Epstein, clearly shows the buildings, streets and orchards of that moment of time. So it was better to overlap it with a newer cadastral drawing to analyse the loss of historic architecture, urban mobility and land use. In both years (1998 and 2018) (Figure 1), the 126 city blocks were carefully analysed by daily observation; thus, a period of three months –in each case– was required.
The ‘limited part of the city’ doesn’t keep regular shapes of city blocks, whereas it contains the most important historic buildings in town. Also, it was possible to count the areas of parking lots, commercial shops and residential buildings in the year of 1998, as well as in 2018. Most of the buildings used as commercial shops are busy during the daytime, while at night time the buildings aren’t occupied by people. It’s frequent in Latin America that historic buildings regularly occupied by people become better preserved than the historic buildings abandoned. It’s a commonplace in historic centres of Latin America to find state government offices and city hall offices, however for the analysis prepared for this paper it was convenient to recognize that floating population worked at this places during daytime and it wasn’t considered part of the census count in the ‘limited part of the city’. Likewise, a similar situation happened with banks, commercial shops, churches, factories and schools. The condition is that a lot of historic buildings don’t have residents. Progressively, and unfortunately, investors are overlooking the original function of architecture and prefer commercial shops rather than inhabitants. This situation is worse when it becomes a matter of land speculation. Some catalogued historic buildings seem in need of restoration, but since it becomes expensive, some investors prefer land speculation –this means such buildings progressively deteriorate with no preservation works– and a few searches for professional help to restore their buildings.
Besides the land use and all the commercial shops found in the historic centre, mobility has become a problem lately. In Aguascalientes State 21 cyclists died in the year 2018 (50% more than in 2017) [2]. Also, almost 17 people die monthly due to traffic accidents in Aguascalientes State; nonetheless, Aguascalientes City includes the 80% of the whole State population, and still the number of accidents is high compared with other cities of Mexico.
Aguascalientes has 1’312, 544 inhabitants, which means 1.1% of the country of Mexico. 81% live in urban areas and 18% live in rural areas (in the country of Mexico the averages are 78% and 22% respectively) [3]. It can be inferred there’s a lack of cycling culture, also the cycling infrastructure is undeveloped in the city, while the Netherlands built a dense, 35,000-kilometer (22,000-mile) network of fully separated bike infrastructure, equal to a quarter of their 140,000-kilometer (87,000-mile) road network [4].
The “limited part of the city” included the most important buildings in the city, considered as heritage architecture. The lack of traffic regulations in the city allows almost all types of vehicles entering the selected urban heritage area. The main reason for this activity is that the “limited area” is located in the oldest urban centre in town. It included some government and office buildings, primary schools, factories, houses and commercial shops.
Figure 1. Mobility and urban heritage in Aguascalientes City. Drawing made by Alejandro Acosta and Jéssica Rodríguez, January 2019
We can observe (Figure 2) the land use and urban heritage in Aguascalientes in the year of 2018. There’s been a singular interest in building parking lots –and tearing down some buildings (including historic buildings) for the last few years. As part of the methodology used in the writing of this paper, it was better to record the surface areas of all the parking lots inside the ‘limited part of the city’ in 2018 (Figure 1).
This area includes 126 street blocks. The accounting also includes fragments of street blocks within the spatial boundary limits. The total surface of parking lots in 2018 was: 139,441.90 m2. In the year of 1998, during another research experience, they were counted 97, 243.37 m2 [5]. This means the parking lots have expanded 43.39 % in 20 years. The perception of this growth is not very visible, but the perception changes if the loss of architecture is compared in serial values. If we think about data sequences taken in 1885, 1998 and 2018, we can observe a dynamic urban change in the ‘limited part of the city’ chosen during the writing of this paper.
After reviewing each city block in the ‘limited part of the city’, in order to detect the land use –in terms of parking lots (related to mobility), commercial shops and residential areas– the Tables 1 and 2 were elaborated. Since the amount of vehicles in the city has increased considerably during the last two decades, mobility has also become a factor of transforming public and private spaces. So the areas of parking lots in each city block were carefully registered in such data tables. Therefore, in block number 1 the parking area changed from 2,460.03 m2 to 9,977.55 m2 in the year 2018 (see Tables 1 and 2). Another significant change happens in the city block number 9, in other words, the area in the year 1998 was 2,878.07 m2 and it changed to 5,526.24 in the year of 2018. Also, in the city block 11, the area in the year of 1998 was 3,217.64 m2 and increased almost 400% (12,141.44 m2) in the year of 2018. Besides, in the city block number 58 the area of parking lots in the year 1998 was 2,108.27 m2 and it enlarged to 4,204.70 m2 in the year of 2018.
In the group of city blocks 65-126 (see Tables: 1 and 2), the block 66 changed a great deal in the size of parking lots, so the 479.88 (parking area in 1998) increased 800%, and in the year of 2018 the area was 4,143.70 m2. Also, in block number 87, the parking areas changed from 7,042.92 m2 in the year of 1998 to 9,610.16 m2 in the year of 2018. Besides, the city block number 94 changed the parking lots areas from 1,529.60 m2 in the year of 1998 to 4,332.12 m2 in the year of 2018. Moreover, the city block number 109 increased the area of parking lots from 7,525.32 m2 to 8,863.00 m2 in the years from 1998 to 2018. In contrast, the parking lots area in the city block number 126 reduced their size from 1,997.55 m2 (in the year of 1998) to 259.11 m2 in the year of 2018. Finally, the total area of parking lots in the ‘limited part of the city’ in the year of 1998 was 97,243.37 m2, but slowly increased during 20 years to get to 141,481.28 m2 in the year of 2018.
Figure 2. Land use and urban heritage in Aguascalientes City. Drawing made by Alejandro Acosta and Jéssica Rodríguez, January 2019
Table 1. Land use in 1998
|
Land use in a ‘limited part of the city’ 1998 |
|||||
|
Block |
Parking lots (m2) |
Commercial (shop) |
Residential (house) |
||
|
No. |
m2 |
No. |
m2 |
||
|
1 |
2,460.03 |
4 |
1,276.50 |
3 |
895.02 |
|
9 |
2,878.07 |
18 |
5,536.51 |
4 |
1,112.23 |
|
11 |
3,217.64 |
16 |
5,207.31 |
21 |
11,532.71 |
|
26 |
281.46 |
12 |
4,074.24 |
19 |
11,073.41 |
|
30 |
312.83 |
20 |
9,115.52 |
25 |
6,433.05 |
|
43 |
6,278.51 |
23 |
8,322.33 |
16 |
5,371.58 |
|
58 |
2,108.27 |
7 |
727.77 |
101 |
20,086.10 |
|
59 |
0.00 |
10 |
1,162.67 |
27 |
6,088.27 |
|
66 |
479.88 |
6 |
2,098.20 |
19 |
7,137.01 |
|
67 |
1,523.12 |
10 |
1,358.98 |
51 |
15,078.78 |
|
83 |
853.98 |
5 |
672.25 |
38 |
11,911.26 |
|
87 |
7,042.92 |
13 |
4,976.44 |
28 |
3,900.92 |
|
94 |
1,529.60 |
21 |
5,327.26 |
17 |
8,644.86 |
|
103 |
0.00 |
10 |
1,705.96 |
49 |
11,106.59 |
|
107 |
0.00 |
3 |
331.46 |
51 |
9,270.54 |
|
108 |
150.32 |
12 |
2,554.62 |
73 |
13,189.90 |
|
109 |
7,525.32 |
28 |
8,748.30 |
17 |
3,924.62 |
|
110 |
2,829.90 |
44 |
16,557.30 |
9 |
1,111.26 |
|
116 |
2,634.93 |
36 |
5,974.10 |
63 |
8,598.24 |
|
120 |
3,287.34 |
31 |
9,433.44 |
5 |
487.24 |
|
126 |
1,997.55 |
25 |
7,861.98 |
10 |
3,019.98 |
|
|
|
|
|
|
|
|
TOTAL |
97,243.37 |
1,858 |
391,280.75 |
1,851 |
388,398.28 |
Table 2. Land use in 2018
|
Land use in a ‘limited part of the city’ 2018 |
|||||
|
Block |
Parking lots (m2) |
Commercial (shop) |
Residential (house) |
||
|
No. |
m2 |
No. |
m2 |
||
|
1 |
9,977.55 |
2 |
774.53 |
5 |
655.59 |
|
9 |
5,526.24 |
23 |
8,494.65 |
2 |
654.30 |
|
11 |
12,141.44 |
28 |
15,237.76 |
23 |
5,792.38 |
|
26 |
670.95 |
23 |
6,295.77 |
18 |
8,062.92 |
|
30 |
1,459.05 |
24 |
6,857.17 |
27 |
9,144.79 |
|
43 |
4,256.91 |
35 |
14,998.83 |
25 |
5,046.33 |
|
58 |
4,204.70 |
16 |
6,067.51 |
64 |
21,489.94 |
|
59 |
0.00 |
10 |
2,910.30 |
61 |
11,380.06 |
|
66 |
4,143.70 |
4 |
1,070.31 |
29 |
8,250.72 |
|
67 |
728.46 |
12 |
5,342.67 |
60 |
12,834.65 |
|
83 |
0.00 |
9 |
4,050.54 |
47 |
13,798.78 |
|
87 |
9,610.16 |
26 |
15,623.75 |
22 |
4,588.09 |
|
94 |
4,332.12 |
25 |
11,898.84 |
32 |
7,773.78 |
|
103 |
231.32 |
11 |
3,368.20 |
33 |
10,323.56 |
|
107 |
524.38 |
6 |
1,257.37 |
39 |
12,508.62 |
|
108 |
374.80 |
14 |
5,397.57 |
41 |
10,200.09 |
|
109 |
8,863.00 |
32 |
15,315.65 |
23 |
5,989.83 |
|
110 |
3,954.87 |
47 |
19,931.80 |
10 |
1,261.14 |
|
116 |
345.35 |
21 |
9,657.91 |
20 |
5,977.04 |
|
120 |
4,013.78 |
32 |
5,516.41 |
12 |
924.75 |
|
126 |
259.11 |
29 |
8,509.80 |
19 |
4,874.51 |
|
|
|
|
|
|
|
|
TOTAL |
141,481.28 |
2,118 |
826,722.33 |
1,905 |
388,502.53 |
About the analysis of the expansion of commercial shops, the situation is more critical; as a result, there are numerous land changes in several city blocks. Hence, in city block number 9 (see Table 1) the commercial shops increased from 18 to 23 and the area changed from 5,536.51 m2 in the year of 1998 to 8,494.65 m2 in the year of 2018. Also, in the city block number 11, the amount of commercial shops increased from 16 in the year of 1998 to 28 in the year of 2018, also the commercial land changed from 5,207.31 m2 to 15,237.76 m2 respectively. In other words, the commercial area increased almost 300% in the city block number 11. In the city block number 43, the commercial shops changed in number and surface too. This is, from 23 commercial shops in the year of 1998, to 35 commercial shops in the year of 2018. Also the area increased from 8,322.33 m2 to 14,998.83 m2 in the period of 20 years –from 1998 to 2018–. In the city block number 87 (see Tables 1 and 2) the commercial shops changed in number and in area, from 13 to 26 and from 4,976.44 m2 to 15,623.75 m2 respectively, from the year of 1998 to the year of 2018; which means more than 300% increase in surface.
Meanwhile, in the city block number 94 the commercial shops increased from 21 in the year of 1998 to 25 in the year of 2018, and the area changed from 5,327.26 m2 in 1998 to 11,898.84 m2 in 2018. In the city block number 109 the commercial shops and their areas changed from 28 (8,748.30 m2) in the year of 1998 to 32 (15,315.65 m2) in the year of 2018. Also, in a close city block (number 110) the commercial shops increased from 44 (16,557.30 m2) to 47 (19,931.80 m2) during two decades (1998-2018).
And finally, in the city block number 116 the commercial shops decreased from 36 to 21, but in contrast, the area increased from 5,974.10 m2 to 9,657.91 m2 during 20 years (from 1998 to 2018). Another paradigmatic case is the city block number 120, in which the commercial shops increased from 31 to 32 shops, but the area decreased from 9,433.44 m2 to 5,516.41 m2, this occurred during two decades, from 1998 to 2018.
Another essential factor in the search for the causes of loss architecture inside de ‘limited part of the city’ is the residential land use. But in contrast with parking lots and commercial shops, the houses fairly increased from 1,851 units to 1,905 units, as well as the area (from 388,398.28 m2 to 388,502.53 m2) from the year of 1998 to 2018 in the whole ‘limited part of the city’. Thus, in the city block number 11 (see Table 1), the houses increased from 21 to 23, but the area decreased from 11,532.71 m2 to 5,792.38 m2, from the year of 1998 to the year of 2018. But, in the city block number 26, the amount of houses decreased from 19 to 18, as well as the area, from 11,073.41 m2 to 8,062.92 m2 respectively, during 20 years (1998-2018). On the other hand, in the city block number 30, the houses only increased from 25 to 27 units, from the year of 1998 to the year of 2018, as well as the area increased from 6,433.05 m2 to 9,144.79 m2 during the same period of time. Also, in the city block number 58, the number of houses decreased from 101 to 64 units, however, the area increased from 20,086.10 m2 to 21,489.94 m2 from the year of 1998 to the year of 2018. In addition, in the city block number 59, the houses increased from 27 to 61, as well as the area which increased from 6,088.27 m2 to 11,380.06 m2, during 20 years (1998-2018). Besides, in the city block number 67 (see Table 2), the number of houses increased from 51 to 60 (from 1998 to 2018), but decreased in area from 15,078.78 m2 to 12,834.65 m2 during the same period of time. But in the city block number 83, the houses increased from 38 to 47 units, as well as the area, from 11,911.26 m2 to 13,798.78 m2, during two decades (from 1998 to 2018).
Finally, in the city block number 103, the houses decreased in number from 49 to 33, as well as the area, from 11,106.59 m2 to 10,323.56 m2, during 20 years (from 1998 to 2018). However, in the city block number 107, the number of houses decreased from 51 to 39, but the area increased from 9,270.54 m2 to 12,508.62 m2, from the year of 1998 to the year of 2018. In contrast, in the city block number 108, the houses decreased from 73 to 41 units, as well as the area, from 13,189.90 m2 to 10,200.09 m2 (from 1998 to 2018).
In recent years, Aguascalientes administrators have paid special attention to remodelling public spaces: streets, parks, squares and historic buildings façades. But with respect to preserving heritage buildings, government budgets represent a limitation, because they usually assign funds for remodelling public spaces, but this doesn’t often occur for remodelling the inside of these private historic buildings. And it so happens that in several countries, most of the historic buildings are private. So, even if society is interested in the preservation of this type of architecture, government budgets are usually destined for remodelling public spaces (in some cases, this means only the façades of buildings).
Historic buildings preservation has been difficult in Aguascalientes during the last three decades, probably because it hasn’t linked accurately the purpose of planning to reality. A possible solution is the inclusion of management as part of the city planning. Urban planning and management could improve the development of society, too.
Newer parking lots are being built in the ‘limited part of the city’ and some of them still involve the tearing down of heritage architecture (and also nowadays architecture). Besides, the new open space areas relocate inhabitants of the historic centre, so population density is reduced. As a result, in many cases only the façades of the historic buildings are left standing, to keep a historic streetscape.
We can observe the parking lots (areas in square metres) inside the “limited part of the city” and deduce that most of the 126 city blocks have parking lots. But the city blocks 5-7, 13-14, 19-25, 27, 29, 34-35, 38, 44, 51, 54, 59-61, 69-73, 78-79, 81, 83-85, 88-89, 92-93, 96, 98, 100, 102, 105-106, 113, 115, 117-118, 121-122 and 124 don’t include parking lots (Figure 1). The reason might be the block size or the concentration of historic properties.
The city blocks that contain from five to nine parking lots are: 9, 11, 43, 58, 87, 94, 109, 110 and 119. These cases mean there could be a problem in terms of heritage loss. Parking lots within blocks 109, 110, 43 are near to commercial stores in Victoria Street. This street contains many stores and nowadays it is hard to find historic buildings left standing. The former residents were forced out by profitable conditions in the area during the last three decades. Also, city planning should include more commercial centralities, but outside the historic centre. New centralities were built in the city in the second half of the 20th century, but the oldest centrality is still the historic centre; nevertheless, people use it as a commercial core. Also, commercial stores choose this place to achieve the greatest utility.
Some primary schools prefer to locate in the historic centre, too. Zaragoza Street, Madero Avenue, Carranza Street, 5 de Mayo Street and certainly López Mateos Avenue (Figure 2) carry intense traffic, especially during rush hours (at 8-9 a.m., and 14-15 and 18-19 hrs. p.m.), because of schools and commercial places. So the historic centre lost its original sense of being a residential area, especially during the second half of the 20th century. Housing no longer predominates and the question is: What will happen with the city’s urban heritage in the near future?
The city blocks that have more land area taken by parking lots are: 1, 9, 11, 87 and 109 (Figure 1). Most of them are near López Mateos Avenue and Madero Avenue. Also, the city blocks without parking lots are basically away from the principal historic buildings in the city centre. The iconic places in the city of Aguascalientes, like San Marcos Garden (Park), el Encino Garden (Park) and the Main Square still don’t have parking lots. It’s important to mention that city blocks: 1, 38 and 46 have parking spaces under their main buildings, particularly city blocks 38 and 46, with two and three-story car park buildings, respectively.
The data collection inside the ‘limited part of the city’, in terms of industrial land use and services, demonstrates significant changes from the year of 1998 to the year of 2018. In the city block number 65, industries expanded from 6,831.50 m2 to 21,397.78 m2 (Figure 2). Banks decided to move out to financial areas of the city and now there are only 6 rather than 13 (in the year of 1998). Also, the number of tourism offices and hotels changed from 15 in the year of 1998 to 22 in the year of 2018 due to the San Marcos International Fair, which occupies part of the city centre from April to May every year. Besides, government bureaus decreased in number (21) from the year of 1998 to 15 bureaus in the year of 2018. Finally, the area industrial land and services changed from 32,933.65 m2 to 43,368.85 m2 from 1998 to 2018 respectively. The city blocks that substantially changed their land use were 1, 4, 10, 12, 17, 19, 20, 28, 29, 32, 47, 55, 65, 85, 90 and 120. Furthermore, land use planning demanded recently the demolition of several buildings –built in the 1970 decade– surrounding the historical Morelos Theatre.
In Mexico City, on February 15th 2018, the city government decided to promote the use of 101 hybrid taxis, promising they would support the change of 40 (or 50) gasoline taxis to hybrid ones every month, from now on. This is part of the idea in having a circular economic process. This means the cars produce part of their energy when they function, generating lower climate change emissions. About a circular economy, Feng and Yan [6] says: “infrastructure development is indispensable”. This includes the building of water-recycling systems, clean energy systems, and clean mass transit systems.
A sustainable future for the human race will demand system-based thinking that involves, in equal measure, society, environment and economics [7]. So, the use of hybrid vehicles is a good idea to preserve the historic centre, following also a circular economic model. Also, if it is possible to reduce the mobility of cars in the ‘limited part of the city’, the pedestrians will have cleaner historic spaces to enjoy. Also, the reduction of traffic congestion in Aguascalientes might also increase liveability. It means we should give more room to pedestrians in the city.
City planning should include topics of zoning to improve the functions of the city and its morphology. Thus, decisions should be taken about moving out primary schools from the ‘limited part of the city’ or letting them stay there. The fact is that the number of cars going to schools, and then returning, is too high for the historic site. Also, it’s convenient to solve a housing problem, because nowadays some families don’t want to live in the historic centre, as a result of its mobility disadvantages.
It’s convenient to encourage the people who visit the historic centre to use public transportation more often. Also, installing smart traffic lights could reduce traffic jams. As a result, city planners need to apply higher standards in the design of clean transportation in Aguascalientes and its historic centre. This would improve citizens’ quality of life and public health (a condition of the circular economy practice). One solution is improving soft mobility (bicycles) in the designs remodelling some historic parks. There’s a lack of green areas in the ‘limited part of the city’. But if city planning designers start including bikeways in main parks, like nodes, a network could be generated to promote the use of bicycles, reducing the use of cars in the historic centre and also increasing pedestrian spaces.
The use of strategic planning might be a good solution to solve the mobility problem in the ‘limited part of the city’. Rahman says it is not only necessary that planning should respect the prevailing social, environmental, economical and political situation, but the same conditions must need to be congenial and compatible enough to nurture and promote planning as a discipline aimed at lasting social welfare [8]. In this sense, sustainability becomes reasonable and inclusive.
Avoiding streets façadism must be in the agenda of city planning programmes for the historic centre of Aguascalientes, because parking lots are increasing their land area inside the city blocks. If we allow demolition of historic buildings, only façades will be shown to historic centre visitors. George Kubler once mentioned the importance of the shape of time, and it’s still a thinking process that city planning can include in its urban renovation programmes. What’s the reason to keep a historic streetscape, if inside the city blocks there’s no more historic architecture? Hani Hamzah says the concept of time is an important and vital issue in architecture and urban planning. Time means simply the perception of change in one place [9]. And usually, we care much more for what we build in the present than what was built in the past, it’s because few buildings are considered important (culturally speaking) for society. Also, history is the basis of theories about learning from others, to improve professions like architecture and urbanism. We must learn from the past, otherwise we are condemned to repeat the same mistakes. Several contemporary studies compare past and present with significant conclusions. For example, Melo says the trajectory of landscape planning in l'Horta has been evaluated, comparing past and present trends and instruments and assessing them in the light of the literature on landscape planning and peri-urban agriculture [10]. Societies’ legacies should be based on people too, not only on buildings and urbanism. Currently, there’s a lack of integration of societies with their historic centres, and also there’s a lot of research still to do.
Abandoned properties (by homeowners) in the ‘limited part of the city’ must be related to the new, recently-built infrastructure, especially parking lots. Some old citizens still live in the ‘limited part of the city’ but in most cases, their children got married and moved away from their parents. A lot of houses in old remarkable places are big, but with few people living in them now. This is also a historic preservation problem. Also the spatial changes very often become an inconvenience for preservation projects. But the study of history can become relevant in such situations. Sánchez, Luengas & Crespo refer to original spatial distribution when they speak about the Lighthouse of Santa Clara Island: It has been possible to detect the original distribution of the lighthouse keeper. The living quarters and the working place necessarily cohabited: the spatial distribution responded to a programme that was consciously executed. They formed part of another intangible symbol of the working culture of the construction era [11]. Moreover, the elderly homeowners’ resources are too limited to maintain their houses, with so many rooms. Old people only occupy the first floor of some multi-story houses. Stairs become a problem, as people get older.
In the year 1791, Felix Calleja counted the people living in the small village of Aguascalientes and found there were almost 10,000 inhabitants. In the year of 1837, the Governor of Aguascalientes ordered a census of Aguascalientes and detected 19,600 inhabitants, but in the year of 2001 (in the ‘limited part of the city’) 5,553 inhabitants were counted. It’s convenient to say the land area in the study area (Figure 1) contains the old small village of Aguascalientes, so it’s correct to say that there’s decay in the population of 72%. No wonder we find a lot of abandoned houses in such a land area. But the most important fact for this paper isn’t only to analyse the quantity of abandoned buildings, but the amount of parking lots built in the last decades, so now in this discussion we can say that urban mobility is related to the loss of historic heritage within the selected land area used for the writing of this paper. It’s an everyday situation to observe car drivers trying to find spots to park on the streets, but also city regulations more often limit the parking on the streets. The intention of the business shops is to promote the use of parking lots. Instead, we can observe the way they solve this situation in important historic cities in Europe, for example. They promote new driving habits and increase pedestrian spaces in the historic sites, and also promote the use of bikeways. In several countries, and not only in Europe, researchers give more importance to open spaces, for example Zalloom and Tarrad proposed new strategies considering the role of public spaces in linking the historical buildings to the World Heritage List.
Science is necessary for city planning. Urbanism and architecture require the use of new tools for the analysis of social problems. In this paper, the best results were obtained by establishing ‘a limited part of the city’ to study the urban mobility phenomena. The context of space unified special characteristics of buildings with time. Such a context was easier to explain with a historic map, historic data, and the urban reality nowadays, supported by mobility aspects. There’s still a lot to discuss on what a historic centre is; also, how it should be related and integrated into the city. In this paper, a drawing made by Isidoro Epstein in 1855 was used to set a ‘limited part of the city’. The main idea was to select areas with common characteristics to be evaluated, as recently it is facing problems with mobility and land use.
The city block number 1 (Figure 1) increased largely its area of parking lots because of the expansion of the government offices. Also, inside the city block number 9 appears a high concentration of parking lots as a result of high concentration of commercial shops nearby. A similar situation occurs in the city block number 11. So, commercial development has to do with expansion on parking lots. In addition, in the city block 66 the unusual expansion of parking area is related to industrial land use. Also, the city block number 87 increased its parking lots because of commercial land use and a frequent visited street by citizens.
A high concentration of historic buildings occurs close to Carranza Street, and lately, the street is preferred by young people because of the cantinas and restaurants situated nearby. So, several parking lots are being built throughout the last few years in the city blocks number 94 and 101.
The conditions of the parking lots in city block number 109 are similar to those in the city block 87, and also related to commercial development nearby. Additionally, the city block number 110 is linked to commercial shops on Victoria Street, as well as blocks 40 and 109. In fact, examining commercial land use growth (Figure 2), we can detect it occupies a great fragment of the ‘limited part of the city’. Furthermore, the total commercial shops increased from 1,858 to 2,118 in two decades, as well as the area changed from 391,280.75 m2 in 1998 to 826,722.33 m2 in 2018. This is more than 200% in the 126 blocks explored. City block number 11 is a severe altered case, inside its architecture, because of commercial shops. Some other paradigmatic cases are city blocks 87 and 94 due to commercial development.
A particular case in this paper is the residential land use, the total number of houses only increased from 1,851 to 1,905 in 20 years (from 1998 to 2018), which means that people don´t want to live in the historic centre (‘limited part of the city’) and the land use gives room to commercial shops, and as a consequence, parking lots for many cars. So the main origin of the mobility problem is the high concentration of commercial shops in the 126 city blocks analysed.
The implementation of politics related to circular economy, preservation of cultural sites and sustainable development are necessary to make Aguascalientes a better place to live. It's important to create a positive outcome, like reduction of living costs, through revenues generated by circular economy design as a local level strategy. Also a good conclusion is that improvement can be achieved in city planning by studying history topics related to mobility conflicts. The decay of population by 72% during 164 years in the ‘limited part of the city’ is overwhelming. Yet the parking lots have expanded 45 % in 20 years, according to the results of this paper. These situations for sure relate to the way we are trying to set preservation heritage rules for the city.
After reviewing topics about urban growth and smart cities, and trying to relate the concept to specific urban cases, it was found that urban growth basically leans now –in Mexico– on economics. Nevertheless, it’s not obligatory to decrease the interaction between mobility of cars and commercial shops in the historic centre of Aguascalientes, to achieve a circular economy model immediately. An important characteristic of circular economy is social development. Commercial shops, restaurants and offices that have settled in the ‘limited part of the city’ constantly offer jobs to people. Also, in recent years, tourism has been producing significant incomes for City Hall and for businesses installed in the historic site. The real problem is the lack of legislations to stop demolition of historic buildings. Also the problem of parking lots can be solved proficiently by designing specific places close to the city centre of Aguascalientes –authorized by historic preservation agencies. In addition, there is still more to do in terms of mobility technology. This means new centralizations of urban economies should emerge away from the historic centre, in the search for new relationships with city structures, in order to stop the loss of heritage architecture. Thus, innovating solutions to use current resources in a smarter way. Also, the designs of bikeways in the city pretend the improvement of an ethical urban growth, following sustainability principles: social, economics and the environment.
Even though the phenomenon of mobility in urban heritage sites is fragmented and has multi-causal difficulties, it’s obvious the parking lots mentioned in this paper are severely altering the rest of the historic buildings inside the ‘limited part of the city’, becoming collateral effects, in terms of urban sciences. But the study of history can become a useful tool to identify architecture to be preserved. Majestic buildings are easier to identify than small historic houses. Thus, governments pay more attention in the preservation of touristic buildings rather than small places, and economy becomes a factor in the way we contemplate architecture retrospectively.
It was demonstrated in this paper that we can learn from the past to set new scenarios for historic preservation. The methodology proposed in this paper showed facts to help determine which historic buildings are in risk and the urban transformations that modify cultural sustainability. It’s a fact that cultural sustainability is required to accomplish an efficient circular economy in a city.
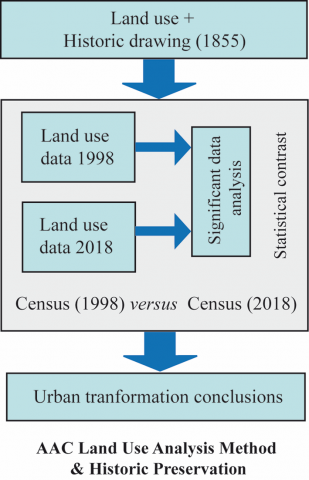
Figure 3. The method and future scenarios. AAC stands for Alejandro Acosta Collazo. Drawing made by the author, June 2020
A mind map (Figure 3), expressly made for this paper, represents the concepts used as a methodology to identify urban transformations related to historic preservation. This Methodology –named: AAC Land Use Analysis Method & Historic Preservation starts with the study of a historic map. In this case a drawing made by Isidoro Epstein in 1855 was selected because it was the most accurate map from the 19th century of the city of Aguascalientes. Such map includes the most important buildings and specifies the residential land use. Afterwards, the historical map was overlaid onto a more recent drawing: a cadastral map made in 1998. Notice the scale of the two maps should be the same. Then ‘a limited part of the city’ was obtained (Figure 1). In this case, land use data from 1998 to 2018 was available, so it became useful to apply a statistical contrast, analysing historic information with land use data. So, only significant data were used in Tables 1 and 2, in order to demonstrate urban transformation conclusions. Also, it’s convenient to remark there’s an emphasis on parking lots, commercial and residential land use transformation.
The method can be useful for city planning since it can demonstrate which historic buildings are in risk due to mobility and the commercial shops inside a core of a historic place. It’s a fact there should be historic information about the buildings in order to create a catalogue. Then, for cultural sustainability, economic factors should be explored to determine how they impact ‘a limited part of the city’, and this includes the mobility that comes with commercial shops.
But the disaster due to loss of historic buildings can be avoided with a correct city planning. With the help of the AAC Land Use Analysis Method & Historic Preservation the variables that affect urban transformations can be recognized. The method can be as accurate as the city planner can decide. If it’s possible use a Geographic Information System to display significant data related to land use in critical areas in the city. In this case a historical area was mentioned, but ‘a limited part of the city’ can be defined to study different types of urban problems in a city. Also, there are several historical neighborhoods in a lot of cities that require precise analysis in order to be preserved.
Nowadays cultural sustainability should be in the agenda of the city administrators because it’s related to identity of people, and one good solution is the use of electric and hybrid cars in historic centres. It’s time to recognize they are a good solution to promote a circular economy model. Historic buildings deterioration could be reduced by the implementation of a more friendly mobility system. For example, important car companies established in Aguascalientes could explore and support new technologies to improve mobility choices and ecologically friendly. In Spain, for example, a Sustainable Urban Mobility Plan (SUMP) has been developed at La Manga in order to encourage sustainable mobility through a rational use of the private car and to ensure and make easier the intermodality among public transport, bicycles and pedestrian areas. Urbanism and architecture schools can also help to develop new mobility possibilities. In addition, restoration schools can also help to design the way clean mass transit systems should access the city centre and share parking lots correctly with historic buildings. So the final solution becomes a multidisciplinary option. To give an instance, Hmood and DiŞli propose the inclusion of several experts with different skills to manage the increasing range of historic places and landscapes to improve a sustainable development.
Also, pedestrians need places to enjoy the city centre on a secure way with fewer vehicles. Electric and hybrid cars also reduce engine noises and pollution. Since these types of vehicles make part of their energy when they function, less organic chemicals are used.
This work was made with the help of Jéssica Alejandra Rodríguez Torres, Saananda Luzayn Delgado Rodríguez, Karla Yarithza Maldonado Macías, Ana Cristina Bernal de la Paz & Wendy Abril Lemus Briano. Appreciation is extended to the researcher: Marco Alejandro Sifuentes Solís.
[1] Acosta Collazo, A. (2018). Mobility and collateral effects on city heritage in Aguascalientes, Mexico. WIT Transactions on the Built Environment, 179: 57-68. https://doi.org/10.2495/UG180061
[2] El Hidrocálido newspaper, Aguascalientes, Ags, http://www.hidrocalidodigital.com/
local/articulo.php?idnota=150745, accessed on Dec. 31, 2018.
[3] INEGI. http://www.cuentame.inegi.org.mx/monografias/informacion/ags/, accessed on Dec. 31, 2018.
[4] Bruntlett, M., Bruntlett, C. (2018). Building the Cycling City: The Dutch Blueprint for Urban Vitality. Island Press, Washington, DC. https://issuu.com/islandpress/docs/ch1_optimized.
[5] Acosta Collazo, A. (2007). The Historic Centre of Aguascalientes. UAA: Aguascalientes.
[6] Feng, Z., Yang, N. (2007). Putting a circular economy into practice in China. Sustainability Science, 2: 95-101. https://doi.org/10.1007/s11625-006-0018-1
[7] Murray, A., Skene, K., Haynes, K. (2017). The circular economy: An interdisciplinary exploration of the concept and application in a global context. Journal of Business Ethics, 140: 377. https://doi.org/10.1007/s10551-015-2693-2
[8] Rahman, A.U. (2016). Urban sustainability through strategic planning: A case of metropolitan planning in Khulna City, Bangladesh. Journal of Urban Management, 5(1): 16-22. http://doi.org/10.1016/j.jum.2016.06.001
[9] Hani Hamzah, H., Syed Zubir, S.S., Yahya, Z., Kholid, F. (2017). Space simulacrum: A paradox of conceptual novelty. WIT Transactions on Ecology and the Environment, 226: 157-167. https://doi.org/10.2495/SDP170141
[10] Melo, C. (2020). L'HOrta de València: Past and present dynamics in landscape change and planning. International Journal of Sustainable Development and Planning, 15(1): 39. https://doi.org/10.2495/SDP-V15-N1-28-44
[11] Sánchez-Beitia, S., Luengas-Carreño, D., Crespo de Antonio, M. (2020). Historical-constructive analysis of the lighthouse of Santa Clara Island (San Sebastian, Spain). International Journal of Sustainable Development and Planning, 15(4): 428. https://doi.org/10.18280/ijsdp.150402