Galina S. Chebotareva
© 2020 IIETA. This article is published by IIETA and is licensed under the CC BY 4.0 license (http://creativecommons.org/licenses/by/4.0/).
OPEN ACCESS
The author was tasked to investigate the dynamics of default level of renewable energy (RES) projects, to conduct a comparative assessment in the global and Russian markets and to study the causes of emerging trends. The article provides a detailed analysis of investments in the global RES market, the contribution of public and private capital to the sector development. Based on the findings of a comprehensive study of the market, the potential of RES development is described. A methodological approach to assessing the risk of RES projects was proposed that is based on logit-modeling and taking into account the sector specifics. Calculations were made on the example of Russian and foreign projects, taking into account the industry and regional specifics. The assessment showed that although the Russian market is characterized by a jump in default level, but by the end of the project, the indicator decreased; in the foreign market the risk gradually increased. This trend is due to the peculiarities of state support for these projects. The results will be used for studying the dynamics of risk for projects without state support, and for complementing an approach to the study of competition in the global market.
default, energy, global energy market, investment project, investments, logit-model, renewable energy sources, risk
At initial stages, state support for renewable energy was an important incentive for the development of renewable energy as an independent sector. Within the framework of this study, state support is understood as a set of mechanisms to stimulate the renewable energy market, implemented at the national and regional levels; such mechanisms include: selection of projects for concessional government lending, subsidies, etc.
Nevertheless, practical experience and studies show that government support for this sector contributes to the emergence of such dangerous risks as [1-7]:
(1) Risks of sudden changes in the strategy of RES development and schemes of its support;
(2) Financial risks stemming from investors' dependence on state programs;
(3) Regulatory risk e.g. means flaws in legislation, etc.
On the one hand, government incentives for RES primarily serve to provide the required social effect: energy independence, environmental safety, electrification of remote cities etc. However, government support does not always provide necessary economic benefits to the investors. On the other hand, private investors are interested in obtaining a stable economic result and minimizing risks for their projects.
The study of the level of default risk of RES projects presented in this paper enhances the definition of risk level with a comprehensive assessment of the financial standing on the basis of a system of quantitative and qualitative indicators.
Therefore, there is an urgent task to conduct not only theoretical, but also applied research of the level of default risk of renewable energy projects in developed and developing countries.
The article presents a practical evaluation of the level of default risk of Russian and foreign RES projects based on the industry-specific logit-model that takes into account regional (national) peculiarities. A comparative analysis of the level of default risk of RES projects in Russia and the world is made on the basis of these calculations.
The result of the study is a comprehensive investigation of the global RES market, including investment aspects, the launch of new capacities and assessment of the potential of the regions. The obtained results have practical importance and will be used to develop a deterministic approach to assessing the risk of default of RES projects in the absence of state incentives for the sector and its integration into the concept of competition research in the global energy market.
This paragraph presents a short description of investment activity in the field of RES, an analysis of new renewable energy capacity in the world market, as well as an assessment of the potential of the Russian RES market.
2.1 Investments in the global RES market
The current investment process in the field of renewable energy is characterized by the following features [8, 9]:
(1) Growth of private investments in RES projects;
(2) Increase in the number of large commercial banks financing RES projects, as well as the growth of loans issued;
(3) Emergence of new financial instruments tailored to the need of the renewable energy sector: green bonds, asset-backed securities, yield cos, crowdfunding, etc.
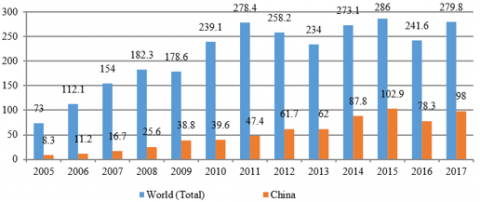
Figure 1. Global new investments volume in RES and renewable fuels (2005-2017), $ bln
Figure 1 presents the dynamics of global investments in the renewable energy market, as well as the main market engine– China – in 2005-2017 [10-12].
According to REN21, the global volume of new investments increased almost fourfold over the period of 2005-2017. The peak of investment activity in the global market was reached in 2015 when the volume of investments in RES amounted to $286 billion. In 2016 the investment performance of renewable energy for all leading countries slowed down dramatically. In 2017, the growth of investment in RES was largely provided by China: its total investments increased by 24%. A significant increase of investment in “green” energy was recorded in Brazil (10%), France (15%), Sweden (109%), the Netherlands (30%) and Canada (45%). In the UK, investment has halved, and in Europe as a whole it was down by 26%, while in the USA it has remained at about the same level over the past three years.
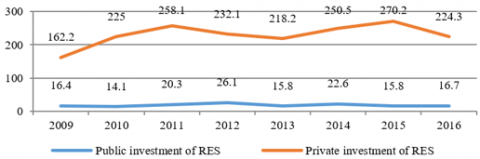
The gradual growth of investment in RES is largely ensured by private investors' capital rather than state financing of renewable energy (Figure 2) [13, 14]. For example, in 2015, the share of institutional financing of RES was only 5.52%; in 2011 - 7.28%. The largest share of state support for RES in 2009-2016 was recorded in 2012 – more than 10%. During the same period the absolute value of state financing of RES in the world market also reached a maximum of $26.1bln.
Figure 2. Structure of investment in renewable energy development (2009-16), $ bln
The leading areas of the renewable energy industry in terms of investment are presented in Table 1 [10, 11]. They account for an average 6.7% of global investment and more than 85% of public financing of RES.
Table 1. Global volume of renewable energy financing by type of RES (2009-16), $ bln [10, 11]
|
Type of RES |
2009 |
2010 |
2011 |
2012 |
2013 |
2014 |
2015 |
2016 |
|
Hydropower |
10 015 |
3 298 |
8 146 |
17 202 |
3 922 |
5 916 |
2 411 |
1 694 |
|
Wind energy |
2 328 |
5 469 |
5 314 |
3 800 |
5 971 |
7 585 |
4 663 |
5 308 |
|
Solar energy |
569 |
1 135 |
2 180 |
1 938 |
1 895 |
3 280 |
1 564 |
2 705 |
|
Bioenergy |
2 430 |
2 478 |
1 617 |
1 378 |
1 313 |
1 473 |
1 255 |
705 |
|
Geothermal energy |
258 |
982 |
953 |
128 |
458 |
1 250 |
966 |
2 121 |
|
TOTAL |
15 600 |
13 362 |
18 210 |
24 446 |
13 559 |
19 504 |
10 859 |
12 533 |
The global dynamics of new RES capacity commissioning over the last decade is shown in Figure 3 [12]. For example, in 2017 a record volume of almost 2.2 gigawatts was achieved, primarily thanks to hydro- as well as wind power installations. According to experts, the total capacity of 2.5 gigawatts will be exceeded in the next 2-3 years.
Figure 3. New capacity commissioning in RES in the world (2007-2017), GW
Structural analysis of new capacity commissioning by type of renewable energy sources and country are presented below. It is based on a comparison of the world rankings for the input of new capacity of renewable energy in 2016-2017, made by REN21 [11, 12]. Compared with 2016 [9], the Asian market considerably solidified its position while the European region is somewhat lagging. While China is the absolute leader in terms of investment in RES and the commissioning of new capacities, India, Japan, Indonesia are among the leading countries too. Only a few European countries have kept their place in the top-ranking. The analysis shows that the issue of increasing investment in the global renewable energy market does not lose its relevance. The world's regions continue to implement capital-intensive investment projects in the field of RES. However, the governments of different countries use mainly indirect instruments to support this sector, and their share in the total investment does not exceed 8% on average [9].
2.3 Potential of Russia in the renewable energy market
The statistical analysis of IRENA Agency data [13, 14] showed that Russia as part of the Eurasian region is among the countries with the weakest potential for RES development. Hydropower occupies the overwhelming share in the total volume of RES capacity (about 97%). The remaining part is distributed among other types of RES: geothermal power, bio- power, coastal wind power, marine power (less than 3%).
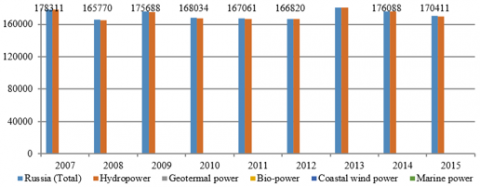
The dynamics of the maximum capacity in the Russian RES market is presented in Figure 4 [13, 14]. It is positive: for ten years the market has grown by almost 10%. However, this value is 10 times less than the world average and 18 times less than the Asian market growth.
Figure 4. Dynamics of Russia RES capacity by types (2007-2016), MW
Renewable energy production in Russia is also driven by hydropower (over 99%) (Figure 5) [13, 14]. The negative dynamics of the sector is caused by a decrease in hydroelectricity generation. The influence of other types of RES is minimal.
Figure 5. Dynamics of actual production of RES in Russia (2007-2015), GWh
In this study, “default risk of RES project” refers to the probability that within the framework of this project, the RES facility will not be put into operation due to the influence of a variety of both financial and political factors [15]. However, this paper looks at projects of the past for which the outcomes are known, so there is no incomplete information. Therefore, in this study terminology “probability” is changed on “frequency”.
The study of the level of default risk of RES projects is based on the assessment of the forecast industry-specific logit-model in Eq. (1) [16-19]. The choice of logit-model is due to its practical applicability in contemporary risk management; the purpose of the model is to assess the frequency of default of RES projects on the basis of a set of financial indicators.
$F D=\frac{1}{1+\mathrm{e}^{\mathrm{Y}}}$ (1)
The calculation of the frequency of default of energy projects is based in the Eq. (2), taking into account the specific characteristics of the country's economy, local and international energy market [18-21]. For this purpose, the evaluation of RES projects in the Eq. (2) is based not only on the data of the project, as well as the energy company-initiator. This Eq. (2) was calculated from a statistical sample of data directly from energy companies (bankrupts and non-bankrupts) realized projects in the global market. The inclusion of a set of external indicators in the model allows us to solve the problem of taking into account the regional specifics of each project. Currently lack of sufficient experience bankruptcy/non-bankruptcy of RES projects makes it impossible to develop and apply a new logit-model specific only for this sector.
$\mathrm{Y}=-\mathrm{a}_{0}-\mathrm{a}_{1} \cdot \mathrm{K}_{1}-\mathrm{a}_{2} \cdot \mathrm{K}_{2}-\mathrm{a}_{3} \cdot \mathrm{K}_{3}-\cdots-\mathrm{a}_{11} \cdot \mathrm{K}_{11}$ (2)
$\mathrm{K}_{1}=\left\{\begin{array}{c}0, \text { if the company was created } \\ \text { more than } 10 \text { years ago } \\ 1, \text { if the company was created } \\ \text { less than } 10 \text { years ago }\end{array}\right.$
$\mathrm{K}_{2}=\left\{\begin{array}{c}0, \text { if company has } \\ \text { positive history } \\ 1, \text { if company has } \\ \text { negative history }\end{array}\right.$ (3)
$\mathrm{K}_{7}=\left\{\begin{array}{l}0, \text { if project is located in the capital } \\ 1, \text { if project is not located in the capital }\end{array}\right.$
The quantitative assessment of default risk is based on the calculation of other exogenous and endogenous financial and economic indicators, including project’s and company’s indicators: K3 is the current ratio; K4 is the ratio of profit before tax and interest paid; K5 is the weighted average capital; K6 is the weighted average key interest rate of the Central Bank; K8 is Return on Assets; K9 is Return on Equity; K10 is growth rate of the project equity capital; K11 is the growth rate of assets of the project for the period.
Taking into account the specific features of the fuel and energy complex, the distribution of industry-specific constants is presented in Table 2.
This model assumes the following total values in (4):
$F D=\left\{\begin{array}{c}[0 ; 0,2)-\text { minimal risk (level) of default } \\ [0,2 ; 0,4)-\text { low risk (level) of default } \\ [0,4 ; 0,6)-\text { average risk (level)of default } \\ [0,6 ; 0,8)-\text { high risk (level) of default } \\ [0,8 ; 1]-\text { maximum risk (level) of default }\end{array}\right.$ (4)
Table 2. The value of the constant coefficients of the model for fuel and energy complex
|
Indicator |
a0 |
a1 |
a2 |
a3 |
a4 |
a5 |
|
Value |
30,74 |
3,70 |
8,97 |
-8,67 |
-7,01 |
-1,64 |
|
Indicator |
a6 |
a7 |
a8 |
a9 |
a10 |
a11 |
|
Value |
-0,14 |
-0,69 |
-5,09 |
-15,39 |
7,37 |
-22,03 |
This paragraph briefly presents the characteristics of the studied projects, as well as the results of the assessment of the frequency of default of foreign and Russian RES projects in accordance with the logit-model.
Project default in this paper refers to the maximum level of the FD indicator at the end of the project period in accordance with (4).
The main criterion for the selection of projects is their geographical diversity, the actual implementation of the projects and the availability of the full portfolio of the required project documentation.
The initial information for practical assessment is based on official reports of RES projects, companies-initiators, as well as statistical data of the regions where the projects were implemented; the initial information is formed for each year of projects’ implementation.
4.1 Assessment of frequency of default level of foreign renewable energy projects
The evaluation of the frequency of default covered 25 foreign RES projects implemented in 16 countries, including China, USA, Canada, India, Germany etc. Their characteristics are presented in Investing.com [22]. The results of the calculations are presented in Table 3. The evaluation was conducted over the period of 2013 through 2017. Each project has an individual level of default over the entire period of implementation [23, 24].
Table 3. The distribution of the frequency of default in foreign RES projects
|
Project |
Period |
||||
|
2013 |
2014 |
2015 |
2016 |
2017 |
|
|
SPP in Germany |
-* |
- |
- |
→0 |
→0 |
|
Object of solar generation in the Mojave desert, USA |
- |
- |
- |
0.48 |
→1 |
|
Object of hydrogenerion in Canada |
- |
- |
0.94 |
0.94 |
- |
|
Solar generation facility in India |
- |
- |
→1 |
→1 |
- |
|
Solar generation facility in Australia |
- |
- |
→0 |
→0 |
- |
|
Wind generation facility in Greece |
- |
- |
0.24 |
0.02 |
- |
|
Solar generation facility in Canada |
- |
→1 |
→1 |
→1 |
- |
|
Solar generation facility in Alamida district, USA |
- |
→0 |
→0 |
- |
- |
|
Wind generation facility in North sea |
- |
→0 |
→0 |
- |
- |
|
Wind generation facility in Sweden |
- |
- |
→0 |
→1 |
- |
|
HPP in Columbia |
- |
0 |
0.23 |
- |
- |
|
WPP in North sea, Belgium |
- |
- |
→0 |
→0 |
|
|
Solar generation facility in India |
- |
- |
→0 |
→0 |
- |
|
GPP in Philippines |
- |
0.99 |
- |
- |
- |
|
Photovoltaic SPP in China |
- |
- |
- |
0.89 |
0.99 |
|
Photovoltaic power plant in El Salvador |
- |
- |
→1 |
0.99 |
0.96 |
|
Conversion of CHP to a biomass plant, Denmark |
- |
- |
- |
→0 |
- |
|
Solar generation facility in Japan |
- |
- |
→0 |
→0 |
- |
|
Tidal marine power plant, UK |
- |
- |
- |
→1 |
→1 |
|
SPP in China |
- |
→0 |
→0 |
- |
- |
|
Dam and HPP in Canada |
- |
- |
→0 |
- |
- |
|
SPP in North Carolina, USA |
→0 |
→0 |
0.22 |
- |
- |
|
Solar generation facility in New-York, USA |
- |
- |
- |
→1 |
→0 |
|
Solar thermal PP, Arizona, USA |
→0 |
→0 |
→1 |
→1 |
- |
|
Solar generation facility in Canada |
- |
→0 |
→0 |
→0 |
- |
The first year of implementation is an important indicator for the financial success of a project. Table 3 shows that the level of default in most projects remains unchanged after the first year: the indicator is either in the zone of maximum or minimal default level. One of the reasons for this “stability” is the shorter pre-investment stage of RES projects (no more than six months) compared to traditional energy projects; also the projects were accompanied by active financial and non-financial support from governments, which does not increase the level of financial risks [15]. The frequency of default in the second, third (or fourth) year of implementation is not reduced or remains in the zone of maximum FD for almost all projects considered. The only exceptions are the projects No. 6 (the level of default is reduced and the group is changed to “minimal”) and 23 (the level of default is reset after the maximum value). As a result, out of the eight projects that had the maximum default level in the first year, the share of defaulted projects was 75%. Of the remaining projects, the default level rose to the maximum only in 18% of cases. Nevertheless, all the projects presented were successfully implemented in the global energy market. This was achieved mainly through active government support for these projects or the market as a whole.
4.2 Assessment of frequency of default level of Russian renewable energy projects
Twenty-five RES projects in the Russian energy market were studied. Their description is presented in Investing.com [22] and ATSENERGO [25]. The results of the calculations for the Russian projects are presented at Table 4. The evaluation was conducted for the period of 2013 through 2017. Each project has an individual level of default over the entire period of implementation.
In contrast to foreign projects, the Russian projects are characterized by a longer average project cycle: 4-5 years. Table 4 presents fluctuations in the FD indicator for many projects: a sharp decrease of the minimal default, an increase of the maximum value or multidirectional changes. Such fluctuations in the indicator are primarily due to an unstable external political and economic environment: fluctuations in currency exchange rates, profitability and efficiency, rising costs of investment, etc. After the first year, there is a constant level of default among Russian projects, which can be explained by reasons similar to those for the foreign market. The maximum value of default throughout the study period is typical of only three projects. Of the eight projects with the maximum default level in the first year, only 33% of them remained in this zone by the end. Among other projects, 25% went into default zone by the last year. Despite the high level of default for a third of Russian projects by the end of the period (or by 2017) all projects were successfully implemented. The high impact of risks was usually artificially reduced by active government subsidies to the sector.
Table 4. Distribution of the frequency of default on Russian RES projects
|
Project |
Period |
||||
|
2013 |
2014 |
2015 |
2016 |
2017 |
|
|
Adygeyskaya 1-3: Ground WPP |
- |
- |
- |
→0 |
→1 |
|
Wind farm -1 |
- |
- |
- |
0.16 |
→0 |
|
WPP «Fortum – Simbirskaya» |
- |
- |
→0 |
→0 |
→0 |
|
SPP Aleyskaya |
- |
- |
- |
- |
1 |
|
Wind measurement complex in Stavropol region |
0.33 |
→1 |
→1 |
- |
- |
|
Buribaevsky SPP-3 |
- |
- |
- |
→0 |
→0 |
|
Beloporozhskaya HPP-1 |
- |
- |
0.98 |
→1 |
0.06 |
|
Kalmykskaya SPP |
- |
- |
→0 |
0.99 |
0.15 |
|
SPP Borzya Zapadnaya |
- |
- |
- |
→1 |
→1 |
|
HPP Sengileevskaya |
→0 |
→0 |
→0 |
→0 |
- |
|
SPP Caspian |
→1 |
→1 |
→1 |
→0 |
- |
|
SPP Zarya |
- |
→1 |
→1 |
→0 |
→0 |
|
SPP Kabanskaya |
- |
→1 |
→1 |
→1 |
→0 |
|
WPP Priyutnenskiy |
- |
→1 |
→1 |
→1 |
- |
|
SPP Aleksandrovskaya |
→0 |
→0 |
→0 |
→0 |
→0 |
|
SPP Staromaryevskaya |
- |
→0 |
→0 |
0.99 |
→1 |
|
SPP in Abakan |
→0 |
→0 |
- |
- |
- |
|
SPP Derzhavinskaya |
→0 |
0.5 |
0.6 |
→1 |
→1 |
|
WPP Aksarayskaya |
0.4 |
0.3 |
0.23 |
0.19 |
0.02 |
|
Wind power in the far East of Russia |
- |
→1 |
→1 |
→1 |
→1 |
|
Wind-diesel complex at oil field (Tatarstan) |
→1 |
→0 |
- |
- |
- |
|
HPP Boguchanskaya |
→0 |
→0 |
→0 |
- |
- |
|
Sunny Park in Belgorod region |
- |
- |
- |
→0 |
→0 |
|
SPP in Volgagrad |
- |
- |
- |
→0 |
→0 |
|
WPP in Western Siberia |
- |
- |
→0 |
→0 |
- |
The study of the default level of renewable energy projects has used the cases of Russian and foreign projects, including those implemented in China, USA, Canada, India, and Germany. Each of the projects presented in the article is characterized by strictly individual conditions: different regions (countries), types of RES, set of investors, types of state support, periods, budget, commissioned capacity, etc. The results of the practical assessment are based on a comparative analysis of the Russian and foreign renewable energy markets. The comparison was made for the first, second and final (or 2017) years of the projects. The overall spread of the default level across the markets is absolutely identical: it varies from zero to the maximum value. The medium level of default of foreign projects was gradually growing from 0.34 value of default level in the first year to 0.41 of default level by 2017. In contrast, the Russian market had a peak level of default (amount makes up 0.47) in the second year of projects, which was reduced to a low level in the last year (it is equal to 0.33). Naturally, in the foreign market the number of projects gradually moved from the category of “minimal level” to “maximum”: 15 and 8 projects in the first year & 13 and 10 projects in the last year, respectively. The reverse trend is typical for the Russian market: in the first year there were 14 projects with minimal level of default, in the last year there were 17; with maximum level – 9 and 8, respectively. Structural analysis showed that default reduction in the Russian market can be associated with mostly non-returnable subsidies to the sector [22, 25], while in the foreign market the most popular one is concessional government lending [22].
Obviously, this study has its limitations - the wide applicability of its results is limited due to the size of the Russian renewable energy market and limited access to additional data of RES projects. Nevertheless, this article provides a valuable insight into the problematique of the research of default level of renewable energy projects in comparison of global and Russian practice.
Further areas of research are related to the development of a methodology for comprehensive assessment of the default of RES projects. Also it includes a study of the dependence of the default level on the types of state support, as well as improving a methodology for assessing competition in the global market. In the long-term perspective, this will make it possible to comprehensively study the economic attractiveness of renewable energy projects by region and by type of renewable energy, to assess the investment potential of different regions and companies in the sector, to identify the stage at which renewable energy projects will not require state support.
The work is supported by Act 211 of the Government of the Russian Federation, contract № 02.A03.21.0006 and by GSEM UrFU Development Fund.
|
Bln. |
Billion |
|
CHP |
Combined heat and power |
|
FD |
Frequency of default |
|
GPP |
Geothermal power plant |
|
GW |
Gigawatt |
|
GWh |
Gigawatt hour |
|
HPP |
Hydro power plant |
|
MW |
Megawatt |
|
PP |
Power plant |
|
RES |
Renewable energy |
|
SPP |
Solar power plant |
|
WPP |
Wind power plant |
[1] Ermolenko, G.V., Tolmacheva, I.S., Ryapin I.Y., Fetisova, Y.A., Matshura, A.A., Reutiva, A.B. (2016). Handbook on renewable energy the European Union. Institute of Energy SRU GSE, Moscow, p. 96.
[2] Dia-Core project. The impact of risks in renewable energy investment and the role of smart policies. http://diacore.eu/results/item/enhancing-res-investments-final-report, accessed on Jun. 01, 2018.
[3] Chioncel, C.P., Tirian, G.O., Gillich, N, Hatiegan, C., Spunei, E. (2017). Overview of the wind energy market and renewable energy policy in Romania. IOP Conference Series: Materials Science and Engineering, 163(1): 012009. http://dx.doi.org/10.1088/1757-899X/163/1/012009
[4] Campatelli, G., Benesperi, F., Barbieri, R., Meneghin, A. (2015). New business models for electric mobility. IEEE International Electric Vehicle Conference, IEVC 2014, 7056136. http://dx.doi.org/10.1109/IEVC.2014.7056136
[5] Chebotareva, G. (2019). Impact of state support mechanisms on the cost of renewable energy projects: The case of developing countries. WIT Transactions on Ecology and the Environment, 217: 881-891. http://dx.doi.org/10.2495/SDP180741
[6] Parpas, D.S., Savvides, A.l. (2020). On the determinants of a successful, sustainable-driven adaptive reuse: A multiple regression approach. International Journal of Sustainable Development and Planning, 15(1): 1-13. http://dx.doi.org/10.2495/SDP-V15-N1-1-13
[7] Pristupa, A.O., Mol, A.P. (2015). Renewable energy in Russia: The takeoff in solid bioenergy? Renewable and Sustainable Energy Reviews, 50: 315-324. http://dx.doi.org/10.1016/j.rser.2015.04.183
[8] Porfirev, B.N. (2016). Green trends in the global financial system. World economy and International Relations, 60(9): 5-16. http://dx.doi.org/10.20542/0131-2227-2016-60-9-5-16
[9] Chebotareva, G. (2018). Leading factors of market profitability of the renewable energy companies. Proceedings of the 2nd International Conference on Social, Economic and Academic Leadership. Atlantis Press, 217: 277-287. http://dx.doi.org/10.2991/icseal-18.2018.39
[10] Renewable Energy Policy Network for the 21st Centure (REN21). State of renewable energy 2016. Global report. http://www.ren21.net/wp-content/uploads/2016/10/REN21_GSR2016_KeyFindings_RUSSIAN.pdf, accessed on Oct. 11, 2018.
[11] Renewable Energy Policy Network for the 21st Centure (REN21). State of renewable energy 2017. Global report. http://www.ren21.net/wp-content/uploads/2017/10/17-8399_GSR_2017_KEY-FINDINGS_RU_low.pdf, accessed on Oct. 20, 2018.
[12] Renewable Energy Policy Network for the 21st Centure (REN21). RENEWABLES 2018. Global status report. http://www.ren21.net/gsr-2018, accessed on Oct. 20, 2018
[13] International Renewable Energy Agency (IRENA). Renewable Energy Statistics 2017. http://www.irena.org/DocumentDownloads/Publications/IRENA_Renewable_Energy_Statistics_2017.pdf, accessed on Oct. 12, 2018.
[14] International Renewable Energy Agency (IRENA). Renewable energy highlights. http://www.irena.org/DocumentDownloads/Publications/IRENA_Renewable_energy_highlights_July_2017.pdf, accessed on Oct. 15, 2018.
[15] Shimbar, A., Ebrahimi, S.B. (2020). Political risk and valuation of renewable energy investments in developing countries. Renewable Energy, 145: 1325-1333. http://dx.doi.org/10.1016/j.renene.2019.06.055
[16] Mokhov, V.G., Chebotareva G.S., Khomenko P.M. (2018). Modelling of “green” investments risks. Bulletin of the South Ural State University. Series "Mathematical Modelling, Programming and Computer Software", 11(2): 154-159. http://dx.doi.org/10.14529/mmp180213
[17] Sorland, B.F., Rudel, M.G.N. (2015). What drives Financial Distress Risk and Default Rates of Leveraged Buyout Targets? Empirical Evidence from European Transactions. Norwegian School of Economics.
[18] Khaidarshina, G.A. (2009). Integrated model to assess the risk of bankruptcy. Finance, 2: 67-69.
[19] Qi, M., Yang, Y., (2018). Towards a sustainable oil supply: a risk diversification model to measure oil security risk in Japan and South Korea. International Journal of Sustainable Development and Planning, 13(5): 746-757. http://dx.doi.org/10.2495/SDP-V13-N5-746-757
[20] Xie, X., Tu, H., Chen, H., Lin, Y. (2018). Modeling the range information inaccuracy risk of battery electric vehicle. CICTP 2017: Transportation Reform and Change - Equity, Inclusiveness, Sharing, and Innovation - Proceedings of the 17th COTA International Conference of Transportation Professionals, pp. 4994-5003. http://dx.doi.org/10.1061/9780784480915.515
[21] Li, W., Adachi, T. (2017). Quantitative estimation of resource nationalism by binary choice logit model for panel data. Resources Policy, 53: 247-258. http://dx.doi.org/10.1016/j.resourpol.2017.07.002
[22] Investing.com. https://www.investing.com, accessed on Oct. 01, 2018.
[23] Schreiner, G.O., Snyman-Van Der Walt, L. (2018). Risk modelling of shale gas development scenarios in the central Karoo. International Journal of Sustainable Development and Planning, 13(2): 294-306. http://dx.doi.org/10.2495/SDP-V13-N2-294-306
[24] Kozhevnikov, M., Gitelman, L., Magaril, E., Magaril, R., Aristova, A. (2017). Risk reduction methods for managing the development of regional electric power industry. Sustainability (Switzerland), 9(12): 2201. http://dx.doi.org/10.3390/su9122201
[25] ATSENERGO. http://www.atsenergo.ru/vie/proresults, accessed on Oct. 02, 2018.