An Guo* | Zhaoran Liu
© 2020 IIETA. This article is published by IIETA and is licensed under the CC BY 4.0 license (http://creativecommons.org/licenses/by/4.0/).
OPEN ACCESS
Needless to say, green buildings have now become an inevitable trend for the sustainable development of society, and they have paved a way for the harmonious coexistence between man and nature. The design of building facade is an important part in green building construction, to achieve the optimal energy-saving effect of building facade, scholars in the field have attached great importance to this aspect and they have done works to optimize it from constituent materials, structural forms, and thermal insulation properties, etc. For the same purpose, this paper proposed a new method for the energy efficiency design of building facade and a thermodynamic evaluation method. First, the paper analyzed the factors that can affect the energy efficiency design of the wall, windows and roof of building facade; then it gave the calculation methods of parameters that are related to the energy-saving performance of building facade such as the coefficient of building shape (CBS), resistance of heat transfer, and thermal inertia (TI); after that, the paper summarized tips for the energy efficiency design of building facade, put forward a thermodynamic evaluation method for assessing the energy-saving efficiency and economic efficiency of green building facade based on the life cycle theory, and it elaborated the calculation process of energy consumption, exergy consumption and total cost of each stage in the life cycle of the building facade; at last, the paper verified the effectiveness of the new design method and the proposed evaluation method with experimental results, and the research findings of this paper can be applied to the design and evaluation of other buildings.
building facade, energy efficiency design, thermodynamic evaluation
With the global urbanization progress, the energy consumption of buildings around the world is increasing year by year. Green buildings have now become an inevitable trend for the sustainable development of society, and they have paved a way for the harmonious coexistence between man and nature [1-5]. The design of building facade is an important part in green building construction, to achieve the optimal energy-saving effect of building facade, scholars in the field have attached great importance to this aspect.
In China, the central government issued the Assessment Standard for Green Building in 2016, which requires that the entire life cycle of green buildings, including stages such as production and operation, should be built with minimum natural resource occupancy and least pollutant emission, and the premise of green buildings is environmental protection and energy efficiency improvement [6-10].
The constituent materials, structural forms, and thermal insulation properties of building facade have a great impact on the energy-saving performance of buildings, therefore, it is also of certain necessity to further explore the different energy-saving patterns of building facade, and the thermodynamic evaluation methods under different heat capacities.
When consulting foreign experience about methods of energy efficiency design of building facade, we found that a few advanced and innovative techniques have been developed, such as Lachat et al. [11] employed a number of successful cases to combine theoretical research with the energy efficiency design of actual commercial building projects, and they gave a systematical analysis from three aspects: the energy-saving curtain walls, the ecological materials, and the sun-shading system of building facade. In China, the documents of Opinions of the Beijing Municipal Government on Promoting Three-dimensional Greening Construction issued in 2011 and the Greening Regulations for Shenzhen Special Economic Zone issued in 2016 clarified the principles and scope of vertical greening of buildings. Based on a review of studies concerning vertical greening of buildings, Piratheepan and Anderson [12] summarized the forms of vertical greening of residential building facade and the influencing factors, and gave detailed design elements and energy-saving strategies for the design of vertical greening of commercial building facade and the exterior walls of cultural and sports centers.
As an important energy-saving method, the self-insulation technology of building exterior walls has attracted the attention of scholars in the field [13-16], for example, targeting at problems existing in the energy conservation design of building facade such as the poor thermal performance of the wall and the obvious thermal bridge effect of the steel structures, Mintorogo et al. [17] proposed an exterior wall insulation system for spray-printed composite wall made of thermal insulation boards, and calculated the heat transfer coefficient of the wall. Shakouri et al. [18] conducted a market survey on the thermal bridge ratio range applicable to different self-insulation systems in fixed areas, and on the price and construction cost of insulation materials; then aiming at the “heat bridge” problem of the building nodes when self-insulation system is adopted in frame structure buildings, they built a PBECA model and calculated its energy saving rate, and then proposed targeted measures for the said problem.
The condition of building facade has a great impact on the energy consumption of the building and the comfort level of its internal environment [19-21]. In summer, the outside temperature is lower and the temperature inside buildings is generally higher, and the situation is opposite in winter. To buffer the changes in the thermal characteristics of the indoor and outdoor environment of the buildings, Paravolidakis et al. [22] emphasized in their research that the design of the self-insulation of building facade needs to comprehensively consider the boundary conditions such as the energy consumption of air conditioning and the comfort level of indoor environment; their study compared and the analyzed the response characteristics of building facade under different boundary conditions, and explored the load changes of the wall under different facade design schemes. Then, the study applied the BIM technology to the energy efficiency design of buildings, and their method had reduced the simulation and calculation costs, and improved the energy efficiency of the buildings [23-25]. Umdu et al. [26] put forward requirements for the application of BIM technology in green building design from five aspects: daylighting in architecture, indoor and outdoor wind environment simulation, light intensity, light direction, and architectural thermal engineering. Marchand et al. [27] analyzed the energy consumption of green buildings based on BIM technology, and used an underground air distribution system to replace the HVAC (heating ventilation air conditioning) system and optimized the existing energy-saving design schemes.
After reviewing the previous research results, we found that the existing research findings are mostly focusing on the analysis of the heat transfer and insulation characteristics of the building facade, and few of them have conducted experiments or on-site investigations to explore the application of new energy saving technologies in the energy efficiency design of building facade. Moreover, in terms of energy consumption statistics, these studies have not considered the energy consumption of building facade and the energy consumed during the building demolition process.
As a result, in order to achieve the best energy-saving effect of building facade and better reflect the significance of green buildings, this paper attempts to propose a new method for the energy efficiency design of building facade and give the corresponding thermodynamic evaluation, in the hopes of providing a reference for the design and development of energy saving methods of building facade.
The research content of this paper is arranged as follows: Section 2 analyzes the influencing factors of the energy efficiency design of building facade. Section 3 gives the calculation methods of the building facade’ performance parameters such as the coefficient building shape (CBS), resistance of heat transfer, and thermal inertia (TI). Section 4 summarizes a few tips for the energy efficiency design of building facade. Section 5 puts forward a thermodynamic evaluation method for assessing the energy-saving efficiency and economic efficiency of green building facade based on the life cycle theory; and it elaborates the calculation process of the energy consumption, exergy consumption and the total cost of each stage in the life cycle of the building facade; then this part also verifies the effectiveness of the proposed energy-saving design scheme and the corresponding thermodynamic evaluation method. Section 6 is the conclusion.
When the indoor-outdoor temperature difference of a building is too large, the “heat bridge effect” would occur to the heat bridge positions on the wall (namely the position on the building facade where the heat transfer is weaker), heat bridges often have fast heat transfer speed and high heat flux, which will result in moisture condensation and mildew on the inner wall. When analyzing the influence of heat bridges, the first parameter that should be considered is the temperature difference ratio. For the temperature difference ratio at any point on the facade of the building under steady-state conditions, it can be expressed as Formula 1:
$\left\{ \begin{matrix} {{\delta }_{o}}=\frac{{{h}_{i}}-{{t}_{p,i}}}{{{h}_{i}}-{{h}_{o}}} \\ {{{{\delta }'}}_{o}}=\frac{{{h}_{i}}-{{{{t}'}}_{p,i}}}{{{h}_{i}}-{{h}_{o}}} \\\end{matrix} \right.$ (1)
For the temperature difference ratio at any point on the interior wall of the building under steady-state conditions, it can be expressed as Formula 2:
$\left\{ \begin{matrix} {{\delta }_{i}}=\frac{{{h}_{i}}-{{t}_{p,o}}}{{{h}_{i}}-{{h}_{o}}} \\ {{{{\delta }'}}_{i}}=\frac{{{h}_{i}}-{{{{t}'}}_{p,o}}}{{{h}_{i}}-{{h}_{o}}} \\\end{matrix} \right.$ (2)
where, hi and ho are respectively the humidity of indoor and outdoor air. tp,i and tp,o are respectively the temperature of any point P on a normal part of the facade and inner wall; δi and δo are the corresponding temperature difference. t'p,i and t'p,o are respectively the temperature of any point P on the heat bridge of the facade and inner wall; δ'i and δ'o are also the corresponding temperature difference. If the surface temperature of the facade and inner wall can meet Formula 3, then the position of the heat bridge could be determined:
$\left\{ \begin{matrix} \frac{\text{1-}{{\delta }_{o}}}{\text{1-}{{{{\delta }'}}_{o}}}<0.95 \\ \frac{{{\delta }_{i}}}{{{{{\delta }'}}_{i}}}<0.95 \\\end{matrix} \right.$ (3)
Using three parameters of the total indoor-outdoor heat flow HT, the additional heat flow ΔHTTB generated by the thermal bridge effect, and the additional heat flow ΔHTTBL generated on the heat bridge, we can calculate the heat loss of the heat bridge. Then, with the help of the finite element software, the distribution of the heat flux density λ of the heat bridge could be obtained; assume the unit length of the heat bridge is dx, then HT can be calculated using Formula 4:
$HT=\int{\lambda dx}$ (4)
Assume λ* is the heat flux density of a normal part on the wall, L is the total length of the facade, then ΔHTTB can be calculated using Formula 5:
$\Delta H{{T}_{TB}}=HT-{{\lambda }^{*}}\cdot L$ (5)
ΔHTTBL can be calculated using Formula 6:
$\Delta H{{T}_{TBL}}=\int{\left( \lambda -{{\lambda }^{*}} \right)dx}$ (6)
The heat loss at the heat bridge can be expressed as:
$Los{{s}_{TB}}=\frac{\Delta H{{T}_{TBL}}}{\Delta H{{T}_{TB}}}\times 100{\scriptstyle{}^{0}/{}_{0}}$ (7)
In this way, for a typical heat bridge effect, the influence area, total heat flow, additional heat flow, and the surface temperature of the facade and inner wall could be analyzed quantitatively, which is helpful to clarify the direction and method of the energy efficiency design of building facade.
2.2 Factors affecting the energy-saving performance of windows
The effect of heat transfer path blocking directly determines the energy-saving performance of a building. When there is a difference between the indoor and outdoor temperature, the windows of the building will act as the main carriers of heat transfer, and they have a great impact on the indoor temperature. The thermal performance of the windows is mainly described by the light transmittance, air tightness, shielding coefficient and heat transfer coefficient. Natural lighting is one of the basic functions of the building’s exterior windows, and it is usually measured by the daylighting coefficient CL:
${{C}_{L}}=\frac{{{I}_{i}}}{{{I}_{o}}}\times 100%$ (8)
where, Ii and Io are the illuminance generated at any point on the building facade and inner wall under the condition of diffused light. In case of sufficient daylighting, the energy consumption generated by lamplight will be greatly reduced. The airtightness of windows is mainly affected by wind pressure, temperature difference, materials, windowing method, and installation deviation, etc., it is usually measured by the volume of permeated air under corresponding wind pressure. Both the shielding coefficient and the heat transfer coefficient can be used to describe the heat blocking effect of the windows, in contrast, the heat transfer coefficient CHT is more intuitive, as shown in Formula 9:
${{C}_{HT}}=\frac{{{C}_{G}}\bullet {{S}_{G}}+{{C}_{F}}\bullet {{S}_{F}}}{{{S}_{G}}+{{S}_{F}}}$ (9)
where, CG and CF are respectively the heat transfer coefficients of window glass and window frame; SG and SF are the areas of window glass and window frame.
2.3 Factors affecting the energy-saving performance of the roof
In a building with large indoor and outdoor temperature difference, the heat loss of the space in higher floors is much greater than that in lower floors. Improving the thermal insulation performance is very important for the energy-saving effect of the entire building; it will improve the living comfort of residents, and the energy consumption of air conditioning can be reduced by about 15-20%. Commonly-used roof energy saving methods include setting a thermal insulating layer on the roof, roof greening, and installing inverted thermal insulation roof (namely laying a hydrophobic thermal insulation material layer on the waterproof layer). The thickness of the roof insulating layer that determines the heat transfer coefficient is the key to the energy-saving effect of the roof. Among the above-mentioned methods, roof greening is a most favorite one due to its most intuitive effect and lowest carbon emission, it not only helps to increase urban vegetation, but also improves the regional environment, and now, roof greening has gradually become a separate industry sector.
The heat loss area of the building facade is greatly affected by the change of CBS (building shape), as shown in Formula 10:
${{C}_{BS}}=\frac{{{S}_{o}}}{V}=\frac{{{F}_{B}}{{H}_{B}}{{P}_{B}}+{{S}_{B}}}{{{F}_{B}}{{H}_{B}}{{S}_{B}}}=\frac{{{P}_{B}}}{{{S}_{B}}}+\frac{1}{{{F}_{B}}{{H}_{B}}}$ (10)
where, PB and SB are respectively the perimeter and area of the bottom of the building; FB and HB are respectively the number of floors of the building and the height of each floor. According to above formula, CBS is mainly determined by the ratio of facade area SO to the building's specific volume V. The smaller the value of CBS, the less the heat exchange caused by the indoor and outdoor temperature difference, and the better the energy-saving effect. In engineering practice, parameters such as heat transfer resistance and thermal inertia should be measured to judge whether a building has met the design standards.
$r={{r}_{i}}+\sum\limits_{k}{{{r}_{k}}}+{{r}_{o}}$ (11)
According to Formula 11, the heat transfer resistance of the building is the sum of the heat transfer resistance of the facade and inner wall ri and ro and the sums of the heat transfer resistance of each layer of the insulation materials. Assume gi and ci are respectively the thickness of the i-th insulation material layer and its heat transfer coefficient, then the heat transfer resistance of the multi-layer insulation material is the sum of the heat transfer resistance of each layer of the insulation material:
$R={{R}_{1}}+{{R}_{2}}+\ldots \ldots +{{R}_{n}}=\frac{{{g}_{1}}}{{{c}_{1}}}+\frac{{{g}_{2}}}{{{c}_{2}}}+\ldots \ldots \frac{{{g}_{\text{n}}}}{{{c}_{n}}}$ (12)
The thermal inertia TI of the wall can describe the attenuation of periodic heat flow waves and temperature waves during the indoor and outdoor heat transfer process, the greater the value of TI, the greater the attenuation, and the better the thermal stability of the building wall. Assume ui is the heat storage coefficient of the i-th layer of the thermal insulation material of the building facade, then the thermal inertia of the multi-layer insulation material is the sum of the thermal inertia of each layer of the insulation material:
$TI=T{{I}_{1}}+T{{I}_{2}}+\ldots \ldots +T{{I}_{n}}={{R}_{1}}{{u}_{1}}+{{R}_{2}}{{u}_{2}}+\ldots \ldots +{{R}_{n}}{{u}_{n}}$ (13)
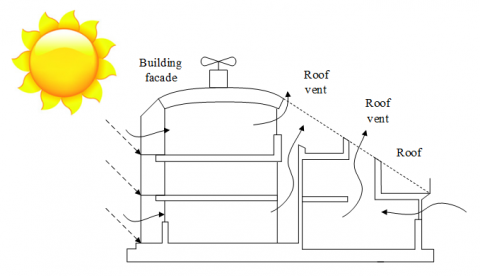
Based on above parameter calculation, the windowing method of the building facade, as well as the heat preservation, heat storage and heat insulation methods could be arranged in a more reasonable way, and adopting the passive-type solar technology shown in Figure 1 can minimize the energy consumption of the building by making full use of the daylight.
Figure 1. A diagram of passive-type solar technology
The shape design of the building facade determines the appearance of a building, and it has a great impact on the heat loss generated in the process of indoor and outdoor heat exchange. Greater CBS values indicate greater building facade surface area corresponding to the unit building area, and the heat loss increases with the increase of heat transfer. Table 1 shows the design criterion of building facade CBS stipulated by the Design Standard for Energy Efficiency of Public Buildings.
Table 1. Design criterion of building facade CBS of public green buildings
|
Number of layers |
≤2 |
3-7 |
8-12 |
≥13 |
|
CBS |
0.60 |
0.47 |
0.42 |
0.30 |
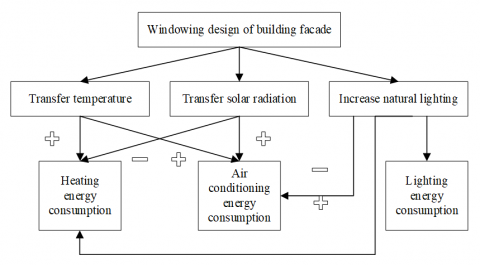
The windowing method of building facade has a complicated relationship with the indoor energy consumption. Figure 2 gives a diagram of such relationship, increasing or decreasing the window area of building facade can affect the indoor heating, air conditioning, and lighting energy consumption of a building through temperature conduction and solar radiation, and reasonable window area and direction can ensure uniform lightening in the building. Under normal conditions, the 150lx is taken as the reference value for the indoor ground natural lighting illuminance, if a building’s illuminance value is greater than this reference value, there is no need to supplement artificial lighting which requires energy consumption.
Figure 2. Relationship between windowing design and indoor energy consumption
Adding window frame sealing strips and using insulating glass with air interlayer can effectively improve the air tightness and thermal insulation capacity of the window. Table 2 shows the heat transfer coefficients of various energy-saving glass and window frames. According to the table, the low-emissivity insulating glass with air interlayer can reduce energy absorption and control indoor and outdoor heat exchange, and thereby achieving the purpose of energy saving.
Table 2. Heat transfer coefficients of various energy-saving glass and window frames
|
Window frame type |
Wooden |
Plastic |
Aluminum alloy |
Stainless steel |
Reinforced concrete |
|
3mm Single-layer glass |
5.12 |
4.85 |
6.74 |
5.42 |
5.21 |
|
3mm+9mm+3mm Insulating glass |
3.22 |
2.89 |
4.51 |
3.76 |
4.39 |
|
3mm+12mm+3mm Insulating glass |
3.01 |
2.62 |
4.02 |
3.01 |
3.84 |
|
3mm+12mm+3mm Insulating reflecting glass |
2.91 |
2.61 |
3.85 |
2.99 |
3.50 |
|
5mm+9mm+3mm Low-emissivity insulating glass |
2.52 |
2.52 |
3.74 |
2.94 |
2.98 |
|
5mm+12mm+3mm Low-emissivity insulating glass |
2.17 |
2.11 |
3.16 |
2.59 |
2.41 |
|
5mm+12mm+3mm Color low-emissivity insulating glass combination |
2.04 |
1.98 |
2.54 |
2.11 |
1.93 |
In the past, the insulation materials of building facade were made of rock wool, aerated concrete, wheat straw, or rice husk; then, with the development of material science, new materials such as Styrofoam, polyurethane, and intumescent polystyrene have replaced them as insulation materials of building facade, and these new materials generally have the merits of low heat loss, light weight, and easy to process. The thermal conductivity and thickness of the insulation materials determined the insulation effect of the building, and the smaller the value of thermal conductivity, the better the insulation effect. The insulating layers of a building can be a composite structure consisting of traditional insulation materials, foam materials and the exterior wall of the building, and the material layers can be arranged in different positions (such as inner layer, middle layer and outer layer) according to requirements. Table 3 and Table 4 respectively give the parameters of different building facade structure types. Table 3 is suitable for the roof and Table 4 is suitable for exterior wall.
In order to make full use of the solar energy, heat storage materials or solar photovoltaic panels can be installed on the facade of the building, so that when the sunlight condition is good, the solar energy can be converted into electric energy and stored in the batteries; later, when the sunlight condition is not good or there is no sunlight, the stored energy can be released as heat. In peak electricity price hours, the electric energy stored in the batteries could be released to reduce the energy consumption of the users, and thus achieving the purpose of energy saving.
Table 3. Parameters of building facade structure types (for roof)
|
Material name |
Thickness |
Thermal conductivity |
Thermal resistance |
Thermal storage coefficient |
Thermal inertia |
|
Cement mortar |
15.0 |
0.930 |
0.0161 |
11.7 |
0.1887 |
|
Cement mortar |
20.0 |
0.930 |
0.0215 |
11.7 |
0.2516 |
|
Gravel concrete |
40.0 |
1.510 |
0.0264 |
0.026 |
0.0006 |
|
Reinforced concrete |
120.0 |
1.740 |
0.068 |
0.069 |
0.0047 |
|
EPG (Expanded Polystyrene Granule) insulating mortar |
60.0 |
0.058 |
1.0344 |
2.473 |
2.5582 |
|
Total |
250.0 |
|
1.1675 |
|
3.0040 |
Table 4. Parameters of building facade structure types (for exterior wall)
|
Material name |
Thickness |
Thermal conductivity |
Thermal resistance |
Thermal storage coefficient |
Thermal inertia |
|
Cement |
5.0 |
0.930 |
0.0054 |
11.7 |
0.0629 |
|
Cement mortar |
10.0 |
0.930 |
0.0107 |
11.7 |
0.1258 |
|
Cement mortar |
15.0 |
0.930 |
0.0161 |
11.7 |
0.1887 |
|
Rock wool boards |
60.0 |
0.040 |
1.5 |
0.75 |
1.125 |
|
Polyurethane foam |
120.0 |
0.026 |
2.3076 |
0.24 |
0.5538 |
|
Total |
210 |
|
3.8399 |
|
2.0562 |
To give a comprehensive evaluation on the resource, energy utilization and environmental impact of the entire life cycle of the building facade, this paper employed exergy-energy ratio (EER), exergy consumption, and other thermodynamic indicators to analyze the energy-saving efficiency and economic efficiency of building facade, wherein the EER can be calculated using Formula 14:
$EER=\frac{CO{{N}_{EER}}}{CO{{N}_{E}}}$ (14)
where, CONE and CONEER respectively represent the energy consumption and exergy consumption of the entire life cycle of the building facade. Assume T and TB are respectively the ambient temperature and the adiabatic combustion temperature of the fuel, the exergy value of the fuel can be calculated using the energy quality coefficient that represents the fuel’s energy level, as shown in Formula 15:
${{\beta }_{F}}=1-\frac{T}{{{T}_{B}}-T}ln\left( \frac{{{T}_{B}}}{T} \right)$ (15)
The electric energy is a kind of high-quality energy source, its energy utilization rate is quite high, therefore, its energy quality coefficient is 1. The exergy value of the energy consumption of the building facade can be expressed by Formula 16:
$CO{{N}_{EER-F}}={{\beta }_{F}}\cdot NV$ (16)
According to the formula, CONEER-F is the product of NV (net calorific value of the energy) and βF. Based on the life cycle theory, this paper divided the energy consumption, exergy consumption, and EER of the entire life cycle of the building facade into three stages: the production and maintenance of facade materials (production and maintenance stage), the construction and demolition of building facade (construction and demolition stage), and building operation (stage).
(1) Production and maintenance stage
Coal and electricity are the main sources of energy required in the production stage of various building materials such as bricks, cement, lime, glass, insulation materials and aluminum alloys, etc. The energy consumption and exergy consumption of a single-type building material at this stage can be calculated by Formula 17:
$\left\{ \begin{matrix} CO{{N}_{E-P}}=\sum{{{\omega }_{F-i}}}\cdot N{{V}_{i}} \\ CO{{N}_{EER-P}}=\sum{{{\omega }_{F-i}}}\cdot CO{{N}_{EER-P-i}} \\\end{matrix} \right.$ (17)
where, ωF-i is the weight coefficient assigned to the i-th energy type consumed by the production of the building material. The EER of this single-type building material can be calculated by Formula 18:
$EE{{R}_{P}}=\frac{CO{{N}_{EER-P}}}{CO{{N}_{E-P}}}$ (18)
The energy consumption of the maintenance stage was estimated according to a preset proportion, assume τ is the proportional coefficient, then the energy consumption and exergy consumption of this single-type building material in this stage can be calculated by Formula 19:
$\left\{ \begin{matrix} CO{{N}_{E-M}}=\tau \cdot CO{{N}_{E-P}} \\ CO{{N}_{EER-M}}=\tau \cdot CO{{N}_{EER-P}} \\\end{matrix} \right.$ (19)
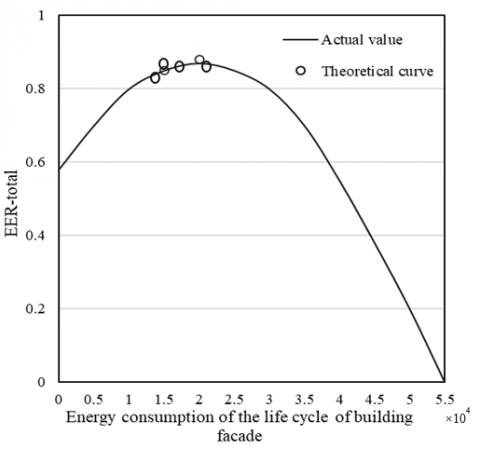
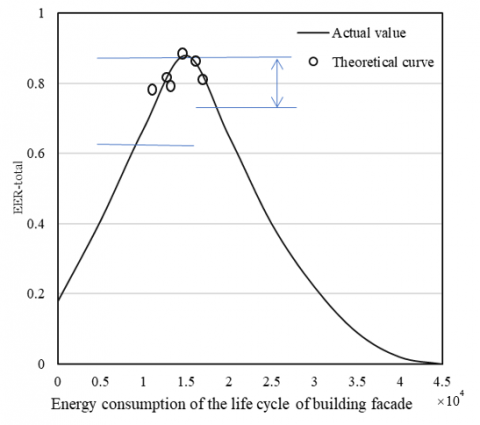
According to Formulas 18 and 19, the EER of the single-type building material at this stage is equal to the EER of the single-type building material at the production stage. Figure 3 shows the energy consumption and EER curves in the building material production and maintenance stages, the curves were obtained based on the quadratic polynomial and Gaussian regression equation. It can be seen from the figure that, for buildings adopted more or fewer innovative materials and technologies, all building facade showed energy-saving sections, and the EER was not at the highest point of the curve.
(a)
(b)
Figure 3. Energy consumption and EER curves of the life cycle of building facade
(2) Construction and demolition stage
In this stage, various machinery equipment is required to build or dismantle the building facade, and the main energy source of such machinery equipment is mainly electricity and petroleum products. As shown in Formula 20, the energy consumption and exergy consumption of the construction and demolition stage could be calculated based on the NV value of the energy and the respective exergy value:
$\left\{ \begin{matrix} CO{{N}_{E-B}}=\sum{{{w}_{i}}}\cdot N{{V}_{i}} \\ CO{{N}_{EER-B}}=\sum{{{w}_{i}}}\cdot CO{{N}_{EER-P-i}} \\\end{matrix} \right.$ (20)
where, wi is the quality of the i-th energy type consumed in this stage. Also, the energy consumption of the demolition stage was estimated according to a preset proportion, assume τ' is the proportional coefficient, then the energy consumption and exergy consumption of this stage can be calculated by Formula 21:
$\left\{ \begin{matrix} CO{{N}_{E-D}}={\tau }'\cdot CO{{N}_{E-B}} \\ CO{{N}_{EER-D}}={\tau }'\cdot CO{{N}_{EER-B}} \\\end{matrix} \right.$ (21)
According to Formulas 19 and 20, the EER of this stage is equal to the EER of construction stage.
(3) Building operation stage
The building operation stage lasts longer, and its energy and exergy consumption are the most. The resource and energy saving of the building’s water, lighting, communication, heating, air conditioning, and ventilation systems at this stage is very important for the energy saving of the entire life cycle of the building facade, especially the energy and exergy consumption of the heating, air conditioning, and ventilation systems account for more than half of the total consumption. In this paper, the electric energy consumption of these three systems was taken as the energy consumption of the building operation stage for calculation, as shown in Formula 22:
$\left\{ \begin{matrix} CO{{N}_{E-R}}=CO{{N}_{E-E}}\cdot P{{C}_{Y}} \\ CO{{N}_{EER-R}}=CO{{N}_{EER-E}}\cdot P{{C}_{Y}} \\\end{matrix} \right.$ (22)
where, CONE-E and CONEER-E are respectively the energy value and exergy value of the electric energy consumed by the three systems. PCY is the annual electric energy consumption of the three systems, its value is determined by the energy efficiency ratio of the system and the cooling and heating load of the building. For the high-quality energy sources with an energy quality coefficient of 1, such as electricity in this case, the exergy consumption is equal to the energy consumption, therefore, the EER of this stage is equal to 1.
In China, the Unified Standard for Reliability Design of Building Structures stipulated that the designed service life of building structures is 50 years, and the values of load and material parameters of the building facade design were based on the 50 years as the statistical period. Then, the energy consumption and exergy consumption of all stages in the life cycle of building facade can be calculated by Formula 23:
$\left\{\begin{array}{c}C O N_{E \text { -toal }}=C O N_{E-P}+C O N_{E-M}+C O N_{E-B}+C O N_{E-D}+50 \cdot C O N_{E-R} \\ C O N_{E E R-\text { total }}=C O N_{E E R-P}+C O N_{E E R-M}+C O N_{E E R-B}+C O N_{E E R-D}+50 \cdot C O N_{E E R-R}\end{array}\right.$ (23)
The EER of the life cycle of the building facade can be calculated by Formula 24:
$EE{{R}_{\text{total}}}=\frac{CO{{N}_{E-\text{total}}}}{CO{{N}_{EER-\text{total}}}}=\frac{\sum{CO{{N}_{E}}}}{\sum{CO{{N}_{EER}}}}$ (24)
The above thermodynamic analysis of the energy efficiency design of building facade was conducted from the perspective of technology, however, for any technology or engineering project, its practical value can only be realized when both the thermodynamic evaluation results and the economic efficiency have been taken into consideration at the same time. Therefore, based on the life cycle consumption analysis, this paper discussed the problem from an economic point of view, it took the minimum consumption of the life cycle of building facade as the goal to determine the optimal investment cost, and the economical thickness of the insulating layer. Under the condition that the basic building materials are determined, the investment cost of building materials for the building facade is mainly determined by the cost of insulation materials. Assume UPIM is the unit price of the insulation material, it can be calculated by Formula 25:
$\operatorname{Cos}{{t}_{P}}=U{{P}_{IM}}\cdot {{S}_{o}}\cdot \bar{\mu }$ (25)
where, $\bar{\mu}$ is the average thickness of the insulation material of the building facade. The maintenance cost of the insulation material was estimated according to a preset proportion of the investment cost, CostM=τCostP. Assume UPIM is the use cost of a single machinery, UPP is the labor cost of an operator, then the investment cost of the construction stage of building facade can be calculated by Formula 26:
$\operatorname{Cos}{{t}_{B}}=U{{P}_{CM}}\cdot {{N}_{CM}}+U{{P}_{P}}\cdot {{N}_{P}}$ (26)
where, NCM and NP are respectively the number of machineries and the number of operators in the construction stage. The building material maintenance cost was estimated based on a preset proportion of the investment cost of building materials, CostD=τ'CostB. The operation cost of the building facade is mainly the electric energy cost of the heating, air conditioning, and ventilation systems, it can be calculated by Formula 27:
$\begin{align} & \operatorname{Cos}{{t}_{R}}=\operatorname{Cos}{{t}_{H}}+\operatorname{Cos}{{t}_{AC}}+\operatorname{Cos}{{t}_{V}} \\ & =\left( {{c}_{H}}+{{c}_{AC}}+{{c}_{V}} \right)\cdot {{p}_{e}} \\\end{align}$ (27)
where, CostH, CostAR, and CostV are respectively the operation costs of the heating, air conditioning, and ventilation systems; cH, cAR, and cV are respectively the electric energy consumption of the heating, air conditioning, and ventilation systems, and pe is the unit price of electricity. Since the building operation stage would last a long time, it is more reasonable to use the net present value considering inflation and time value to evaluate the operation cost of the building facade. Assume DR is the discount rate, IR is the inflation rate, then the net present value factor can be calculated by Formula 28:
$\eta =\frac{{{\left( 1+X \right)}^{50}}-1}{X{{\left( 1+DR \right)}^{50}}} \left\{ \begin{align} & DR>IR,X=\frac{DR-IR}{1+IR} \\ & DR<IR,X=\frac{IR-DR}{1+DR} \\\end{align} \right.$ (28)
The total cost of the consumption of the life cycle of the building facade can be expressed as:
$\begin{align} & Cos{{t}_{total}}=\operatorname{Cos}{{t}_{P}}+\operatorname{Cos}{{t}_{M}}+\operatorname{Cos}{{t}_{B}} \\ & +\operatorname{Cos}{{t}_{D}}+50\cdot \operatorname{Cos}{{t}_{R}}\cdot \eta \\\end{align}$ (29)
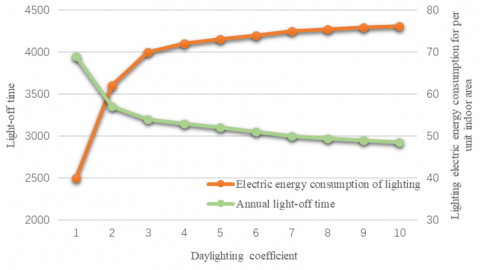
Based on engineering examples, this paper analyzed the relationships among the widowing method of the building, the electric energy consumption of the lighting system, and the annual light-off time. As shown in Figure 4, the green curve shows the relationship between annual light-off time and daylighting coefficient, and the orange curve shows the relationship between the lighting electric energy consumption for per unit indoor area and the daylighting coefficient. According to the figure, the lighting electric energy consumption for per unit indoor area decreased with the increase of daylighting coefficient, while the annual light-off time increased with it. When the daylighting coefficient was relatively small, the decrement and increment of the parameters were greater.
Figure 4. Relationships among lighting electric energy consumption, annual light-off time, and the natural daylighting condition of the building
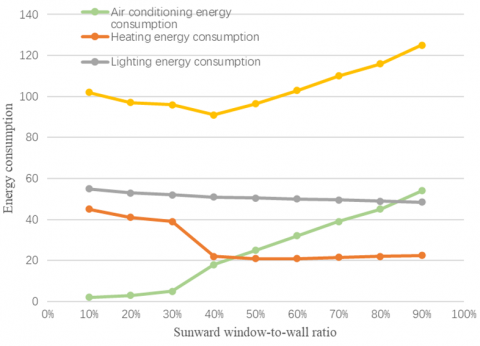
Figure 5. Influence of sunward window-to-wall ratio on energy consumption
Figure 5 shows the influence of the sunward window-to-wall ratio on the electric energy consumption of air conditioning, lighting and heating and the total energy consumption in actual engineering projects. It can be seen from the figure, after the building had been put into operation, the electric energy consumption of air conditioning increased with the increase of the sunward window-to-wall ratio, and the electric energy consumption of lighting and heating decreased with the increase of the sunward window-to-wall ratio. When the sunward window-to-wall ratio was relatively small, the influence of the electric energy consumption of lighting and heating on the total energy consumption was relatively large; when the sunward window-to-wall ratio was relatively large, the influence of the electric energy consumption of air conditioning on the total energy consumption was relatively large. Moreover, it can be clearly seen from the figure, when the sunward window-to-wall ratio was between 35% and 45%, the total energy consumption of building facade was the lowest.
(a)
(b)
(c)
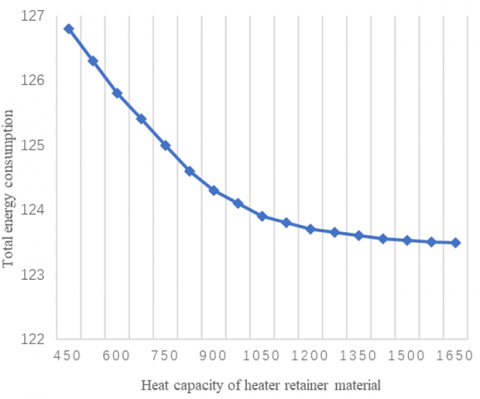
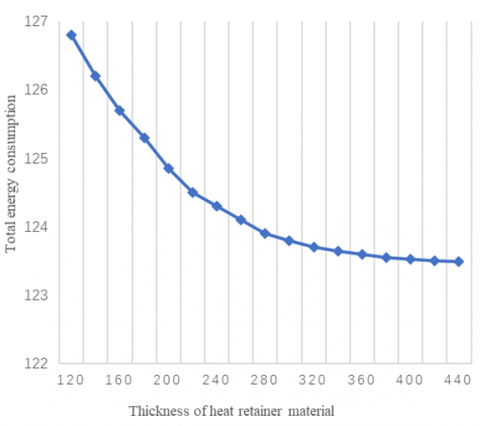
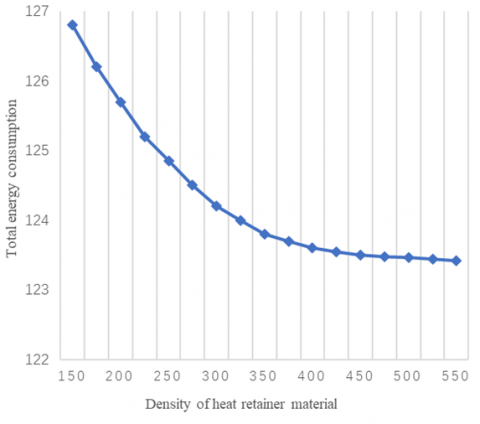
Figure 6. Test on the performance of heat retainer
Figure 6 shows the influence of the performance of the heat retainer on the total energy consumption of the building facade. According to Figure 6(a), the total energy consumption decreased with the increase of the heat capacity of the heat retainer, when the heat capacity increased to more than 1200J/kg·K, the change trend tended to be stable. According to Figure 6(b), as the thickness of the heat retainer material increased, the total energy consumption decreased exponentially, when the thickness increased to more than 320mm, the change trend tended to be stable. According to Figure 6(c), with the increase of the density of the heat retainer material, the total energy consumption decreased rapidly, and its change trend was the same with Figures 6(a) and 6(b).
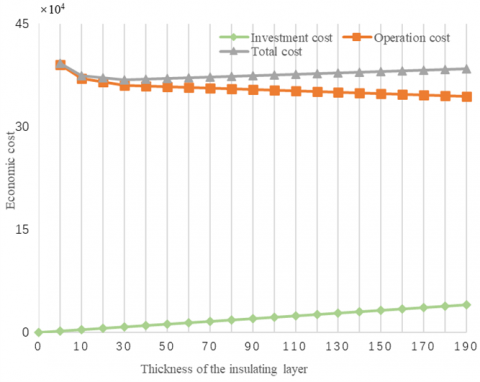
Figure 7. Relationship between the total cost of the building facade and the thickness of the insulating layer
In order to verify the effectiveness of the thermodynamic evaluation method for the energy-saving efficiency and economic efficiency of the building facade, this paper designed related experiments. Figure 7 shows the relationship between the investment cost, annual operation cost, total cost of building facade, and the thickness of the insulating layer. According to the figure, the investment cost of building facade increased linearly with the increase of the thickness of the insulating layer, while the annual operation cost decreased with it, and the decrease speed was faster when the thickness of the insulating layer was relatively small, and the total cost showed a trend of decrease first and increase later. It can be clearly seen from the figure that, when the insulating layer thickness was between 30mm and 50mm, the total cost reached the minimum value, and the corresponding thickness at this point was the optimal thickness.
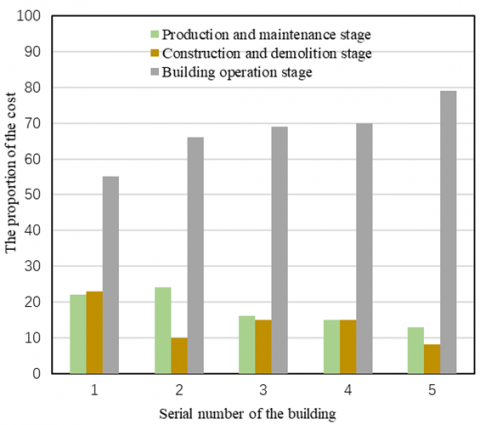
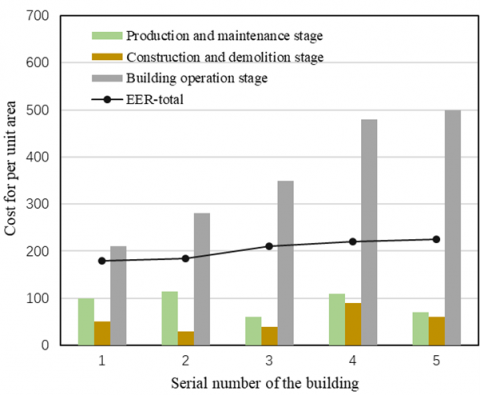
Figure 8 shows the proportions of costs of each stage in the life cycle of building facade in actual engineering projects. According to the figure, the proportion of the cost of the building operation stage was the highest, accounting for 55% to 78%. The operation costs of building No. 1 and building No. 2 (office buildings) were lower than the costs of buildings No. 3, No. 4, and No. 5 (commercial buildings), therefore, the energy efficiency design of commercial buildings should pay more attention to the formulation and implementation of the energy saving strategies of the building operation stage. Figure 9 shows the cost and EER of each stage in the life cycle of building facade, it can be seen from the figure, for buildings No. 3, No. 4, and No. 5, their energy consumption of the building operation stage was greater, and the EER was greater as well. However, lager EER value indicates that the economic efficiency of the life cycle of the building facade is not ideal enough, and it is necessary to find a balance between the two in the design process.
Figure 8. Proportions of costs of each stage in the life cycle of building facade
Figure 9. Cost and EER of each stage in the life cycle of building facade
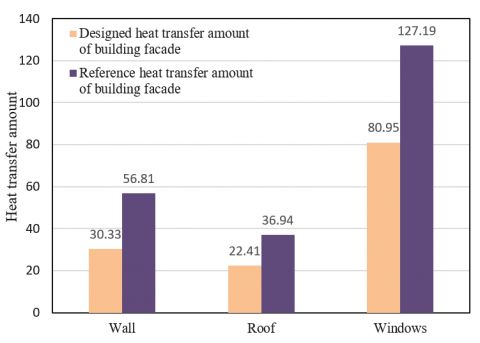
Figure 10. Comparison of heat transfer amount of building facade before and after energy efficiency design
Under the condition of same equipment operation status, this paper gave the heat transfer amount of the building facade before and after the energy efficiency design, as shown in Figure 10. Through comparison we can see that, after the building facade had been optimized by the energy efficiency design, the overall heat transfer of the building had been greatly reduced. The heat transfer of the wall, roof, and windows was reduced by 46.61%, 39.33%, and 36.35% respectively.
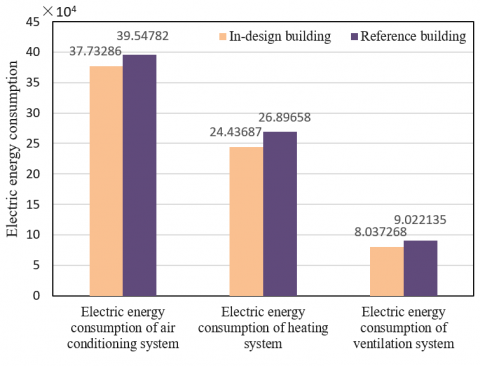
Figure 11. Comparison of electric energy consumption (after the building was put into operation) before and after the energy efficiency design
Figure 11 shows the comparison results of the electric energy consumption of the building before and after the energy efficiency design. It can be seen from the figure, after the building facade had been optimized by the energy efficiency design, the energy consumption of the building operation stage had been greatly reduced. The electric energy consumption of the air conditioning, heating and ventilation systems decreased by 5581kWh, 246kWh, and 10kWh respectively. According to the building energy-saving requirements stipulated by the Design Standard for Energy Efficiency of Public Buildings, the energy efficiency design method proposed in this paper could be applied to the energy efficiency design of building facade, it can reduce the costs of each stage in the life cycle of building facade, the electric energy consumption for per unit area is lower, and the annual electric energy consumption can basically meet the requirements.
This paper presented a new method for the energy efficiency design of building facade and it gave the corresponding thermodynamic evaluation method. Based on an analysis of the influencing factors of the energy efficiency design of building facade from three aspects of wall, roof and windows, first, this paper gave the calculation methods of the building facade performance parameters such as the coefficient of building shape (CBS), the resistance of heat transfer, and thermal inertia (TI). Then, in the experiment part, this paper analyzed the relationships among the windowing method of the building, the electric energy consumption of the lighting in the building, and the annual light-off time; after that, the paper gave a comparative analysis on the influence of sunward window-to-wall ratio and heat retainer performance on the energy consumption of the building, and obtained the corresponding experimental conclusions. Moreover, this paper also summarized the key points in the energy efficiency design of building facade, and put forward a thermodynamic evaluation method for assessing the energy-saving efficiency and economic efficiency of building facade based on the life cycle theory. At last, the experiment gave the calculation results of the energy consumption, exergy consumption and the total cost of each stage in the life cycle of building facade. The changes in the heat transfer amount of the building facade and the electric energy consumption of the building operation stage had verified the effectiveness of the thermodynamic evaluation method proposed in the paper. This paper provided a reference for the energy efficiency design of building facade and its evaluation, and the research findings could also be applied to the design of other buildings.
This work was supported by the Research on the precise service docking between Hebei Vocational Colleges and the Grand Canal cultural tourism brand construction, Research topics of social science development in Hebei Province (Grant No.: 20200403113).
[1] Roslan, N.H., Ismail, M.R. (2018). Influence of building shapes on thermal and energy performances in glass facade high-rise buildings: A review. In MATEC Web of Conferences, 250: 06006. https://doi.org/10.1051/matecconf/201825006006
[2] Salameh, T., Assad, M.E.H., Tawalbeh, M., Ghenai, C., Merabet, A., Öztop, H.F. (2020). Analysis of cooling load on commercial building in UAE climate using building integrated photovoltaic facade system. Solar Energy, 199: 617-629. https://doi.org/10.1016/j.solener.2020.02.062
[3] Zolanvari, S.I., Laefer, D.F., Natanzi, A.S. (2018). Three-dimensional building facade segmentation and opening area detection from point clouds. ISPRS Journal of Photogrammetry and Remote Sensing, 143: 134-149. https://doi.org/10.1016/j.isprsjprs.2018.04.004
[4] Taddia, Y., González-García, L., Zambello, E., Pellegrinelli, A. (2020). Quality assessment of photogrammetric models for facade and building reconstruction using DJI Phantom 4 RTK. Remote Sensing, 12(19): 3144. https://doi.org/10.3390/rs12193144
[5] Beasley, K.J. (2016). Building facade failures in the urban environment. Proceedings of the Institution of Civil Engineers-Forensic Engineering, 170(1): 8-13. https://doi.org/10.1680/jfoen.16.00018
[6] Kubilay, A., Carmeliet, J., Derome, D. (2017). Computational fluid dynamics simulations of wind-driven rain on a mid-rise residential building with various types of facade details. Journal of Building Performance Simulation, 10(2): 125-143. https://doi.org/10.1080/19401493.2016.1152304
[7] Ravyts, S., Moschner, J.D., Yordanov, G.H., Van den Broeck, G., Dalla Vecchia, M., Manganiello, P., Driesen, J. (2020). Impact of photovoltaic technology and feeder voltage level on the efficiency of facade building-integrated photovoltaic systems. Applied Energy, 269: 115039. https://doi.org/10.1016/j.apenergy.2020.115039
[8] Niiuchi, Y., Matsumoto, S., Fujii, D. (2017). Computational morphogenesis of building structures using IESO method-Natural shape of buildings which resist vertical and seismic load. Journal of Structural and Construction Engineering (Transactions of AIJ), 82(731): 97-103.
[9] Martinez, A., Choi, J.H. (2017). Exploring the potential use of building facade information to estimate energy performance. Sustainable Cities and Society, 35: 511-521. https://doi.org/10.1016/j.scs.2017.07.022
[10] Guldentops, G., Van Dessel, S. (2017). A numerical and experimental study of a cellular passive solar facade system for building thermal control. Solar Energy, 149: 102-113. https://doi.org/10.1016/j.solener.2017.03.078
[11] Lachat, E., Landes, T., Grussenmeyer, P. (2017). First experiences with the Trimble SX10 Scanning Total Station for building facade survey. The International Archives of Photogrammetry, Remote Sensing and Spatial Information Sciences, 42: 405. https://doi.org/10.5194/isprs-archives-XLII-2-W3-405-2017
[12] Piratheepan, M., Anderson, T.N. (2017). Performance of a building integrated photovoltaic/thermal concentrator for facade applications. Solar Energy, 153: 562-573. https://doi.org/10.1016/j.solener.2017.06.006
[13] Coydon, F., Duran, M., Dinkel, A., Herkel, S. (2016). Monitoring results and optimization of a facade integrated ventilation concept for building retrofit. International Journal of Ventilation, 14(4): 349-362. https://doi.org/10.1080/14733315.2016.11684092
[14] Perlova, E., Platonova, M., Bondarenko, E., Togo, I., Tereshchenko, A., Fikfak, A. (2016). Nano filled facade plasters to increase durability of building and structures. In Materials Science Forum, 871: 76-83. https://doi.org/10.4028/www.scientific.net/MSF.871.76
[15] Lee, J., Jeon, Y., Jeong, K., Shin, Y., Kim, W. (2016). A method for data-mining of defects on building facade elements. International Journal of Smart Home, 10(12): 97-106. http://dx.doi.org/10.14257/ijsh.2016.10.12.10
[16] Gelesz, A., Lucchino, E.C., Goia, F., Serra, V., Reith, A. (2020). Characteristics that matter in a climate facade: A sensitivity analysis with building energy simulation tools. Energy and Buildings, 229: 110467. https://doi.org/10.1016/j.enbuild.2020.110467
[17] Mintorogo, D.S., Elsiana, F., Budhiyanto, A. (2020). Effect of tilt angle of building-integrated wind turbine and photovoltaic facade on wind pressure and solar radiation. In IOP Conference Series: Earth and Environmental Science, 520(1): 012016. https://doi.org/10.1088/1755-1315/520/1/012016
[18] Shakouri, M., Ghadamian, H., Noorpoor, A. (2020). Quasi-dynamic energy performance analysis of building integrated photovoltaic thermal double skin facade for middle eastern climate case. Applied Thermal Engineering, 179: 115724. https://doi.org/10.1016/j.applthermaleng.2020.115724
[19] Abediniangerabi, B., Shahandashti, S.M., Makhmalbaf, A. (2020). A data-driven framework for energy-conscious design of building facade systems. Journal of Building Engineering, 29: 101172. https://doi.org/10.1016/j.jobe.2020.101172
[20] Gholami, H., Røstvik, H.N., Kumar, N.M., Chopra, S.S. (2020). Lifecycle cost analysis (LCCA) of tailor-made building integrated photovoltaics (BIPV) facade: Solsmaragden case study in Norway. Solar Energy, 211: 488-502. https://doi.org/10.1016/j.solener.2020.09.087
[21] Pahn, M., Schultz-Cornelius, M. (2016). High-performance concrete facade with energy-efficient anchorage: Innovative developments in the area of building materials. Betonwerk und Fertigteil-Technik/Concrete Plant and Precast Technology, 82(2): 102-103.
[22] Paravolidakis, V., Bacharidis, K., Sarri, F., Ragia, L., Zervakis, M. (2016). Reduction of building facade model complexity using computer vision. In 2016 IEEE International Conference on Imaging Systems and Techniques (IST), pp. 454-459. https://doi.org/10.1109/IST.2016.7738269
[23] Powell, D., Hischier, I., Jayathissa, P., Svetozarevic, B., Schlüter, A. (2018). A reflective adaptive solar facade for multi-building energy and comfort management. Energy and Buildings, 177: 303-315. https://doi.org/10.1016/j.enbuild.2018.07.040
[24] Vanaga, R., Blumberga, A., Freimanis, R., Mols, T., Blumberga, D. (2018). Solar facade module for nearly zero energy building. Energy, 157: 1025-1034. https://doi.org/10.1016/j.energy.2018.04.167
[25] Ishak, N.M., Hien, W.N., Jenatabadi, H.S., Ignatius, M., Yaman, R. (2018). The effect of building facade reflectivity on urban dwellers in tropics. In IOP Conference Series: Earth and Environmental Science, 117(1): 1755-1315. https://doi.org/10.1088/1755-1315/117/1/012038
[26] Umdu, E.S., Kahraman, İ., Yildirim, N., Bilir, L. (2018). Optimization of microalgae panel bioreactor thermal transmission property for building facade applications. Energy and Buildings, 175: 113-120. https://doi.org/10.1016/j.enbuild.2018.07.027
[27] Marchand, K.A., Earl, W.R., Davis, C.E., Conrath, E.J., Hadjioannou, M. (2018). Extending building facade performance requirements for blast: Hazard and injury assessment investigations. In Structures Congress 2018: Bridges, Transportation Structures, and Nonbuilding Structures, pp. 509-517. https://doi.org/10.1061/9780784481332.046