Syed Talha Tirmizi* | Syed Rizwan Ul Haq Tirmizi | Syeda Amara Tirmizi
© 2020 IIETA. This article is published by IIETA and is licensed under the CC BY 4.0 license (http://creativecommons.org/licenses/by/4.0/).
OPEN ACCESS
Lubricants help combat an array of challenges posed during both onshore and offshore operations including in the application of thrusters, mud pumps, mud agitators, drive systems, lifts/hoists systems etc. The evaporation loss of lubricating engine oil can significantly impact the engine’s performance and emissions, by thermal degradation and corrosion. The present research focuses on challenges arising due to oxidation of lubricating oils used in different machinery by implementing thorough quantitative analysis. The interferometry was adopted to test oil samples and infrared rays were resolved into its component wavelength relative to associated functional group such as C=O and O-H groups. The frequency domain was retrieved from interferometric data by Fourier transformation with the help of FTIR (Fourier Transform Infrared Ray) spectrometer. To comprehensively understand the wear and tear process inside the peripheries of the engine, atomic absorption spectroscopy (AAS) was used for determination of metals concentration. The changes in physical and chemical properties of oil samples were discussed to retrieve useful interpretations including percentage of wear and tear was found to be 15.2% at 3000 engine running hours. The research concluded by addressing the potential impact of oxidation by-products on the lubrication performance which ultimately influence the efficiency of the oil and gas upstream operations. The research inferred to contribute towards establishing a relative deterministic approach for predicting the oxidative tendencies of lubricating oils whilst keeping in view its physical characteristics.
atom absorption spectroscopy (ASS), corrosion, FTIR (Fourier Transform Infrared Ray), spectroscopy, thermal degradation
In the modern-era of industrialization and technology, lubrication is essential to streamline the operations of machinery in nearly every industrial sector. In petroleum drilling and production operations, the machinery and equipment have to endure rough environments and just an hour of down time could cause spiraling losses of revenue. Therefore, reliable and proper lubrication of the machine components is highly anticipated in the industry [1]. While considering the complications of onshore petroleum industry, offshore operations imply huge maintenance expenses which could be significantly reduced if proper lubrication systems is implemented [2-4]. Lubricants could be defined as the substance used to reduce wear and tear due to mutual contact between surfaces, eventually reducing generation of heat [5, 6]. The specifications of a typical diesel engine lubricating oil are shown in Table 1 [7].
During the relative motion of lubricated devices, a monolayer film of lubricant and the solid asperities are absorbed onto the bearing surfaces. The formation of monomolecular or multimolecular films of lubricants helps reduce surface wear by impeding contacts between solid surfaces [8-10]. This phenomenon is very important for the life of the components. When the solid surfaces come into contact, surface wear and friction is produced because of the stresses due to tangential and normal forces. This causes dissipation of heat which acts as a catalyst for the chemical reactions occurring at the contact zone [11, 12]. Thus, a fertile ground for chemical reactions is provided at the surface. These chemical reactions include oxidation reactions, organometallic chemical reactions, decomposition reactions, and polymerization of organic molecules [13]. The chemical reactions are very complex and frequent. Amongst which is oxidation reaction that is our major concern in this research. It is a well-established fact that oxidization of hydrocarbons occurs by free radical mechanism. This reaction can be well-explained in four steps, as mentioned below:
Initiation: RH $\rightarrow$R+H
Propagation:
$R^{\cdot}+O_{2} \rightarrow R O O^{\cdot}$
$R O O^{\cdot}+R H \rightarrow R O O H+R^{\cdot}$
Branching:
$R O O H \rightarrow R O^{\cdot}+H O^{\cdot}$
$R O^{\cdot}+R H \rightarrow R O H+R^{\cdot}$
$H O^{\cdot}+R H \rightarrow H_{2} O+R^{\cdot}$
Termination:
$\begin{array}{c}R^{\cdot}+R^{\cdot} \\R^{\cdot}+R O O^{\cdot} \\R O O^{\cdot}+R O O^{\cdot} \\R O^{\cdot}+R^{\cdot}\end{array} \rightarrow \rightarrow\left\{\begin{array}{c}\text { alcohols } \\\text { aldehydes } \\\text { ketones } \\\text { acids }\end{array}\right.$
Copper, iron, nickel and many other similar metals when reacted with hydrocarbons, have catalytic reactions. The hydrocarbons react with oxygen to produce carboxylic acids and other similar species [14, 15]. These acids then react with metal surfaces to from complexes that are soluble in oil. The mechanism of such reactions is illustrated below [16]:
Initiation:
$R_{n} M+R H \rightarrow R^{\cdot}+R H+R_{n-1} M$
Propagation:
$R^{\cdot}+O_{2} \rightarrow R O O$
$R O O^{\cdot}+R H \rightarrow R O O H+R^{\cdot}$
$R_{n} M+R O O H \rightarrow R O^{\cdot}+R_{n} M H$
$R_{n} M H+R O O H \rightarrow R O O^{\cdot}+R_{n} M+H_{2} O$
$R_{n} M H+R H \rightarrow R^{\cdot}+R_{n} M+H_{2} O$
$R_{N} M H+C-O / C=O \rightarrow R C ^{\cdot} O+H_{2} O+R_{n} M$
Termination:
$R·+R_{n} M H \rightarrow R_{n} M+R O H$
and further oxidation products
$R^{\cdot}+R_{n} M H \rightarrow R-R+R_{n-1} M$
$R O O^{\cdot}+R_{n} M \rightarrow R_{n} M-R O O$
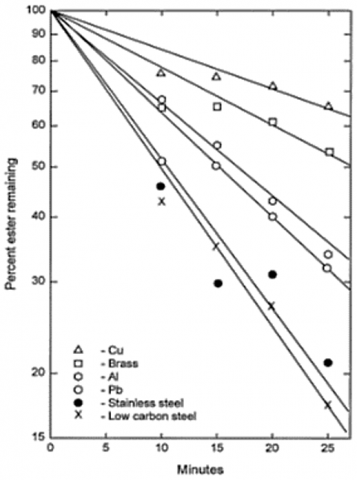
These reactions are basically the general reaction steps as it is impossible to have a detailed explanation of catalytic mechanism. The possible directions of reactions and number of isomers are immense, and the mechanism of these reactions depends on molecular structures. Figure 1 is used to illustrate this dependency of reaction mechanism and molecular structures [17].
Figure 1. The influence of different metals on oxidation reactions in lubricants [17]
The oxygenate compounds produced in the oil, causes an increase in the viscosity and acidity. It also produces deposits that block valves and cause malfunction of the equipment. Elevated temperature accelerates these reactions. The high temperature encourages vaporization which causes clogging of the pipes in the engines. In case of ineffective lubrication, the wear and tear of components could produce asperities of metals which act as catalysts for the oxidation process. For example, the wear of bearing could release copper, products of oxidation reaction and ferrous compounds produced by reaction of oxidized complexes and water in oil [18]. Fourier Transform Infrared Ray (FTIR) spectrometer is a highly advanced and prompt mechanism to determine the degree of oxidation and nitration in oil. It is a highly advanced and sophisticated electronic system. The advantage to this system is that it is operated through microcomputers. The FTIR utilizes mid-infrared (IR) spectroscopy concept in which the quantitative analysis through determining absorption with respect to wave number (cm-1). The involvement of FTIR spectroscopy has been discussed in detail in the subsequent section. To improve the effectiveness of lubricants and ultimately the overall performance of the machinery, we must concentrate on the elements and indications that encourage oxidation reactions in lubricating oils by thorough quantitative analysis of oil.
Table 1. Specifications of lubricating oil
|
Specification |
Initial values |
|
Viscosity at 40℃ |
85.6 mm2/s |
|
Viscosity at 100℃ |
13.1 mm2/s |
|
TBN |
15.6 mgKOH/g |
|
Flash Point |
224℃ |
|
Pour Point |
-33℃ |
The lubricating oils shows many indications and symptoms that could help in the determination of degree of deterioration and oxidation in it. For the present research, we have considered the physical characteristics of lubricating oil. These include viscosity which increases as the median density of the carboxylic acid increases. It is measured using viscometer bath. Total acid number (TAN) measures the volume of potassium hydroxide or similar alkaline reagent required to neutralize the acid which gives the idea of acid concentration. One drawback of involving TAN is that it doesn’t differentiate between acidity caused by the oxidation products and the additives such as rust inhibitors and anti-wear etc. that were initially added into the oil. Flash point is the temperature at which starts to flow and there is a drastic change in viscosity which is also the function of degree of deterioration of oil. The oxidation reaction is itself an exothermic reaction which produces the condition that further escalates its rate of reaction [13]. All these parameters demonstrated the extent of oxidation reactions occurred in the lubricating oil. Therefore, there has been performed a quantitative analysis of these parameters by measuring them using the appropriate instruments. The American Society of Testing and Materials (ASTM) International has defined the international technical standards with the sole purpose of maintaining safety and quality assurance of manufactured products [19]. The ASTM methods implemented in this research for different instruments are shown in Table 2.
Table 2. ASTM Methods used for the determination of different characteristics of lubricating oil
|
No. |
Characteristics |
Instrument/Method |
ASTM Code |
|
1 |
Oxidation |
FTIR spectrometer |
ASTM (D7414-09) |
|
2 |
Nitration |
FTIR spectrometer |
ASTM (D7624-10) |
|
3 |
Wear Metal Concentration |
Atom Absorption Spectrometer |
MM-1011 |
|
4 |
Flash Point |
Cleveland open cup apparatus |
ASTM D-92 |
|
5 |
TBN |
Potentiometric titrimeter |
ASTM D-2896 |
|
6 |
TAN |
Titration |
ASTM D-974 |
|
7 |
Density |
Digital Density Meter (DDM) |
ASTM D-4052 |
|
8 |
Kinematic Viscosity |
Viscometer bath |
ASTM D-445 |
Table 3. Physicochemical properties of lubricating oil in sample A
|
Time period (hrs) |
0 |
1000 |
2000 |
3000 |
|
Flash Point (℃) |
262℃ |
245℃ |
226℃ |
214℃ |
|
Viscosity index |
99.00 |
103.35 |
108.76 |
116.06 |
|
Density at 15.6℃ (g/cm3) |
0.8900 |
0.9007 |
0.9124 |
0.9210 |
|
Viscosity at 40℃ (mPa.s) |
130 |
144 |
158 |
165 |
|
Viscosity at 100℃ (mPa.s) |
13.50 |
14.89 |
16.28 |
17.55 |
|
TBN (mg KOH/g) |
6.20 |
3.02 |
1.48 |
0.72 |
|
TAN (mg KOH/g) |
0.00 |
2.89 |
4.98 |
6.19 |
Table 4. Physicochemical properties of lubricating oil in sample B
|
Time period (hrs) |
0 |
1000 |
2000 |
3000 |
|
Flash Point (℃) |
265℃ |
234℃ |
210℃ |
118℃ |
|
Viscosity index |
106.0 |
103.7 |
107.0 |
113.4 |
|
Density at 15.6℃ (g/cm3) |
0.850 |
.865 |
0.879 |
0.884 |
|
Viscosity at 40℃ (mPa.s) |
121.0 |
128.6 |
143.1 |
156.8 |
|
Viscosity at 100℃ (mPa.s) |
13.40 |
13.76 |
14.81 |
15.47 |
|
TBN (mg KOH/g) |
5.30 |
3.63 |
2.50 |
1.87 |
|
TAN (mg KOH/g) |
1.10 |
1.84 |
2.83 |
3.82 |
To have a detailed analysis of the oxidation tendencies of the lubricants, atomic absorption spectroscopy (AAS) was involved in the study. It is used for the determination of the concentration of elements quantitatively. AAS examines the wavelength of lights absorbed by the element, corresponding to the required excitation energy of the electrons. This could be better explained by saying that the atoms absorb characteristic wavelength of light. To know if a particular element is present in a sample, the energy emitted from the corresponding source element would be emitted. For instance, consider lead lamp emitting excited lead atoms, it would produce the respective wavelengths of light that would be easily absorbed by the lead element if lead is present in the lubricating oil. In ASS, a sample is energized to change from ground state to free electrons in vapor state. This is achieved by using a light source, usually a hollow cathode lamp, sealed in a cylindrical glass tube with inert gas filled at a pressure of 1 Nm^2 to 5 Nm^2. The atoms are excited from the gaseous state of acetylene or air by raising temperature from 2200℃ to 2400℃. Acetylene\dinitrogen oxides are usually used with temperature of 2600℃ to 2800℃. Due to intense temperature, only 1% to 5% sample nebulized. The gaseous ions were bombarded, causing spluttering (releasing of nascent atoms). The energy (hv) is released from the excited metals and atoms return to their ground state consequently.
$P b^{+} \rightarrow P b+$ energy $(h v)$
This vaporized sample is exposed to the electromagnetic rays being emitted from the excited lead atoms. The cathode's shape is such that it concentrates beam through a quartz window and the shape of lamp deposits the spurred atoms back to cathode, as shown in Figure 2. The degree of absorption of the radiations is proportional to the concentration of the element under consideration, for example lead. The absorbance of the radiations is compared to the calibration curve which is obtained by testing the sample with known concentration. Thus, the concentration of the element is obtained from the calibration curve. In our current research, we have tested our oil samples for the concentration of different samples which is given in Table 3.
Figure 2. Path of excited electromagnetic rays inside atom absorption spectrometer
In the recent years, Fourier Transform Infrared Ray (FT-IR) Spectroscopy has emerged as an important tool for quantitative analysis for the identification of functional group and molecular characterization of substances. FT-IR spectroscopy has numerous advantages, most importantly that any state of substance could be analyzed in a relatively short time period. FT-IR works on the basis of vibrational motion of atoms of a molecule. The interferometry was adopted to test oil samples and infrared rays were resolved into its component wavelength relative to associated functional group such as C=O and O-H groups. The frequency domain was retrieved from interferometric data by Fourier transformation with the help of spectrometer. In FTIR analysis, the lubricating oil sample is placed in a n attenuated total reflectance (ATR) crystal inside the transmission flow cell accessory having a peristaltic pump. The mid-IR spectrum of the lubricating oil was obtained with the phenomenon of absorption of range of mid-IR radiations associated with different functional groups. The different peaks and area measurements of the mid-IR spectrum helps in determining decaying conditions of the oil. A time domain FTIR spectrometer passes the signals with varying frequencies simultaneously through the sample. The signal is detected and retrieved by the microcomputer which produces a frequency domain spectrum by Fourier Transformation.
$G(t)=\int_{-\infty}^{+\infty} g(t) e^{-2 \pi i f t} d t$ (1)
To perform a Fourier Transform of a sinusoidal signal of frequency fo,
$g(t)=\cos f_{o} t$ (2)
By Euler’s relation,
$g(t)=\frac{e^{2 \pi i f_{o} t}+e^{-2 \pi i f_{o} t}}{2}$ (3)
After substituting the value g(t) from Eq. (2) into Eq. (1), interpolation is performed as under,
$G(f)=\int_{-\infty}^{+\infty} \cos f_{o} t e^{-2 \pi i f t} d t$
The value of cosf0 t is substituted by the relation given in Eq. (3) since both equate to g(t).
$=\int_{-\infty}^{+\infty}\left[\frac{e^{2 \pi k f_{o} t}+e^{-2 \pi i f_{o} t}}{2}\right] e^{-2 \pi i f t} d t$
$=\frac{1}{2}\left[\int_{-\infty}^{+\infty} e^{2 \pi i f_{o} t} e^{-2 \pi i f_{o} t} d t+\int_{-\infty}^{+\infty} e^{-2 \pi i f_{o} t} e^{-2 \pi i f t} d t\right]$
$\quad=\frac{1}{2}\left[\delta\left(f-f_{o}\right)+\delta\left(f+f_{o}\right)\right]$ (4)
The Eq. (4) shows that Fourier Transform is basically an impulse at fo. From the spectroscopy perspective, we can say that the pulse passes through the sample and frequency excited by the Fourier Transform of the pulse, thus giving a frequency domain spectrum.
Now, consider that a wide range of signal is sampled over a particular time interval, a series of discrete readings of the signals could be retrieved. The dataset considered is {g1,g2,g3,…….,gN} which would be transformed to frequency domain with the help of Discrete Fourier Transform (DFT).
$G_{f}=\sum_{n=1}^{N} g_{n} e^{\frac{2 \pi i f n}{N}}$ (5)
where,
$G_{f}=A+i B$
Gf is the signal in frequency domain whose magnitude is given by,
$\left|G_{f}\right|=\sqrt{A^{2}+B^{2}}$
Nyquist frequency is the upper limit of the discrete sampling of the time domain. It is represented by fNyq. It can be given by,
$f_{N y q u i s t}($cycles $/ \sec$ or Hertz $)=\frac{f_{\text {Meas}}\left(\frac{\text {samples}}{\text { sec }}\right)}{2}$ (6)
Considering Eq. (5), we can see that the calculation by Discrete Fourier Transformation for the spectrum requires evaluation at all N data points at a specific frequency f, meaning that the algorithm requires computational time equivalent to N2. Sometimes a rapid module is executed by considering calculations N log N.
From above Eq. (7), we found a relation for the wave number spacing $(\nabla \bar{v})$ for frequency domain spectrum given by,
$\nabla \bar{v}=\frac{2 f N_{y q}}{N_{c}}$ (7)
The results obtained after the Fourier Transform of the oil sample is discussed in much detail in the subsequent section.
The physicochemical properties are important to establish general relationships causing the variation in lubricating oil sample. Table 5 represents the values of physicochemical properties of two lubricating oil samples taken at different time intervals of 1000 running hours. The table also includes the properties of the fresh oil under 0 engine running hours. One of the oil samples was originally run in diesel engine and the other in gas engine. The properties were measured at specified time periods of 1000 hours interval. The properties were measured as per the ASTM codes by the presented instruments in Table 2. The regression was applied to get the extent to which the oil samples remained stable for use in engines. To apply regression equation, the independent value (x) was used as time period (hrs.) and estimated value (y) was used as specific physicochemical property for dependent variable [20, 21]. Basically, regression equation is a linear equation of form $\hat{y}=b_{o}+b_{1} x$. For linear regression analysis, following equations were used,
$b_{1}=\frac{\sum\left(x_{i}-\bar{x}\right)\left(y_{i}-\bar{y}\right)}{\sum\left[\left(x_{i}-\bar{x}\right)^{2}\right]}$ (8)
$b_{o}=\bar{y}-b_{1} * \bar{x}$ (9)
where,
$b_{1}=$regression coefficient,
$b_{o}=$regression slope.
The calculated results are presented in following figures.
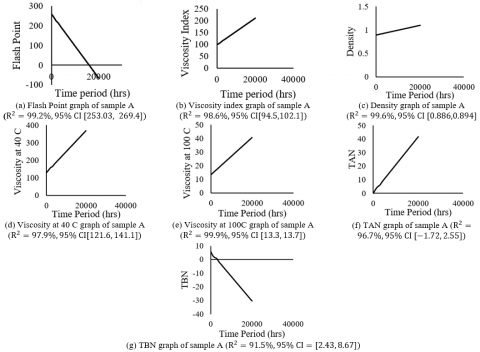
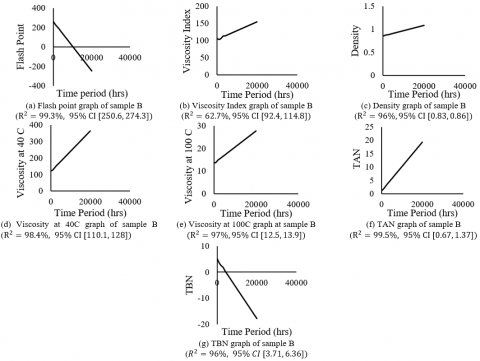
To help explain the variability in our data, the coefficient of determination and 95% confidence interval is considered, which clearly shows that the data will fall more closely to fitted regression line. Figure 3(a) and Figure 4(a) illustrate the variation of flash point in terms of running engine time periods. As we know that flash point is the lowest temperature at which the vapors ignite in the lubricants. The high temperature and ignition of vapors could cause leakage of seals and equipment. From the graphs, a flash point of 100℃ was achieved at around 9850 hours for sample A and 6370 hours for sample B. The graphs have shown a relative sharp slope with 100 C being reached within the 10000 hours. The flash point temperature below 100 C is considered very dangerous as liquids ignite easily. The relative drop in flash point temperature depends on a number of factors such as to what were the maintenance practices and was the oil collected in a proper manner. Most importantly, this change is associated to the viscosity of the oil. Figures 3(b), 3(d), 3(e), 4(b), 4(d) and 4(e) display the graphs for the viscosity index, viscosity at 40 C and viscosity at 100 C as indicated in the figure labels. The graphs interpret that the viscosity is associated with the flash point temperatures. Lubricants are manufactured with high TBN value as TBN signifies the quantity of acid required to neutralizes alkaline compounds existing in it, thereby, determining the appropriate time for change of lubricant. TBN reduces with the use of lubricant, thereby decreasing its ability to protect engine from corrosion. Therefore, in Figure 3(g) and Figure 4(g), clearly shows this decreasing trend of TBN value [22, 23]. TAN and TBN graphs will be used to interpret the results obtained from FTIR spectroscopy.
The atom absorption spectroscopy was used to evaluate the concentration of different elements present in the lubricants.
Figure 3. Calculated results for different physiochemical properties of sample A
Figure 4. Calculated results for different physiochemical properties of sample B
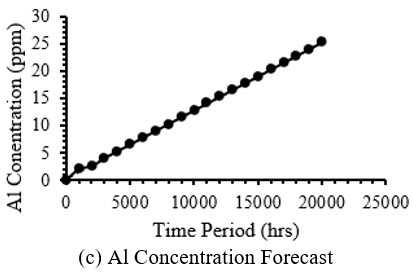
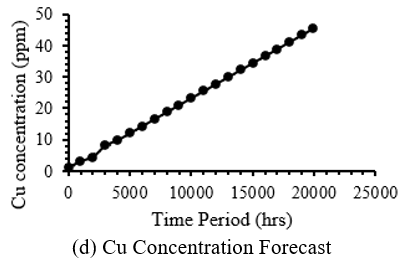
Table 5. Concentration of different metals obtained from atom absorption spectroscopy
|
Sample |
A |
B |
||||||
|
Time Period (hrs) |
0 |
1000 |
2000 |
3000 |
0 |
1000 |
2000 |
3000 |
|
Fe (ppm) |
5 |
12 |
26 |
38 |
4 |
6 |
10 |
17 |
|
Na (ppm) |
4 |
6 |
6.43 |
8 |
3.3 |
4 |
7 |
10 |
|
Al (ppm) |
0 |
2 |
2.5 |
4 |
0 |
4 |
5 |
6 |
|
Cu (ppm) |
1 |
3 |
4.34 |
8 |
0.54 |
1.4 |
2 |
4 |
Figure 5. Concentration forecast of different metals in lubricating oil
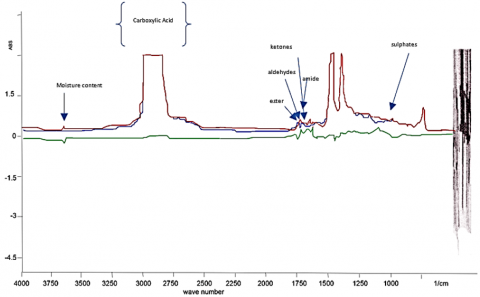
Figure 6. FT-IR Spectra of sample A lubricating oil at 1000 hrs
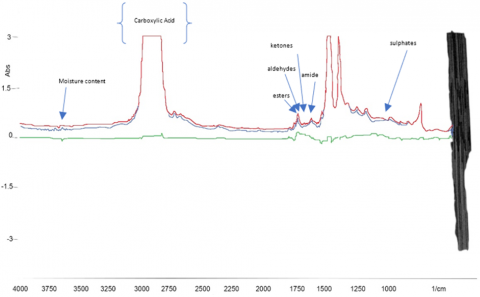
Figure 7. FT-IR Spectra of sample B lubricating oil at 1000 hrs
FTIR analysis is a very important tool for measuring the extent of degradation of lubricating oil due to oxidation reactions. In the present research, the FTIR spectrometer was used in which the liquid sample cell having path length of 0.1 mm and made up of Zn-Se. It was first cleaned with toluene and later with hexane. It was dried using dry nitrogen. The plastic syringe was used to introduce oil sample into the sample cell. The FTIR spectrometer produced the transmittance spectrum in the range of 500 cm-1 and 4000 cm-1 with satisfactory signal to noise ratio. The FT-IR spectrums in Figures 6 & 7, shows the general absorption signals of hydrocarbon. Alcohol group $v_{\text {asym}}(O H)$ signals were seen between 3550 and 3200 cm-1. The asymmetrical $\delta_{\text {asym}}($CH3$)$ and symmetrical $\delta_{s y m}(C H 3)$ bending vibrations of the methyl group absorbs at 1454 cm-1 and 1376 cm-1, respectively. It has been observed that the transmission spectra from Figure 6 and Figure 7. The moisture content has been put under consideration though the use of FTIR spectroscopy. The moisture present inside the lubricant depends on the amount of hydrated acetone gem-diol which is the product of the reaction between water and 2,2-dimethoxypropane (DMP).
$\left(C H_{3}\right)-C\left(O C H_{3}\right)+H^{+}-O H^{-} \rightarrow C H_{3} C O C H_{3}+2 C H_{3} O H$
In the above chemical reaction, DMP reacts with water producing two moles of methanol and one mole of acetone. In the transmission spectrum, we could easily observe that the spectra at 3690 cm-1 and 3500 cm-1 present a sharp spike which illustrate that increase of peak heights is proportional to water content (moisture) in the lubricating oil. The oxidation reaction is basically the by-product of combustion. Wide range of by-products are produced during the combustion reaction. These by-products include aldehydes, carbonates, carboxylic acids, ketones and esters. A number of these compounds could also dissolve in the oil. The acidity of oil is dominantly influenced by carboxylic acid. The long-term effect of continuous oxidation results in increased acidity, ultimately causing corrosion. It can also increase the oil’s viscosity. From the FT-IR spectra, the level of oxidation is found out by considering the carbonyl region that lies between 1800 to 1670 cm-1. This technique can be attributed as the direct measurement of level of oxidation. Along with oxidation reactions, organic compounds when brought to elevated temperatures and pressure conditions, produces nitration products when nitrogen and oxygen also exist in the environment. These nitration products include NO, NO2 and N2O4. They cause oil thickening, acidity and produce deposits of lacquer or varnish. The FT-IR helps in determination of extent of nitration by considering the region between 1650 cm-1 to 1600 cm-1. The FT-IR spectra has also been used to evaluate the level of sulphation, by considering the region between 1180 and 1120 cm-1. The sulphates compounds such as SO2 and SO3 deteriorate the lubricating oil. In the FTIR spectra, scattering of infrared radiation could be seen at higher wave number which is due to the presence of severe soot particles in the lubricating oil which normally occurs at 2000 cm-1 absorbance intensity. Water easily absorbs the infrared rays which can be easily detected. In Figures 6 and 7, the red line represents the spectrum of used oil, blue line is for fresh oil and green line shows the difference between the absorption of used and fresh oils. In both Figures 6 and 7, we could observe common features, including a sharp increase at a broad region centered around 1730 cm-1 because of the development of oxidation by-products containing carbonyl bands. The broadness of peaks indicates a number of compounds occurring around that region. The point of maximum intensity seems to be different in both the features as they are of different lubricating oils as well as working conditions. The variation of peaks in FT-IR spectra have a lot of importance for measuring the deterioration of oil as compared to TAN and viscosity.
Considering Figure 6 and Figure 7, area of peaks in different regions have been calculated with respect to the base. The area of peaks of different oxidation by-products have been shown in Table 6 and Table 7 for sample A and sample B, respectively.
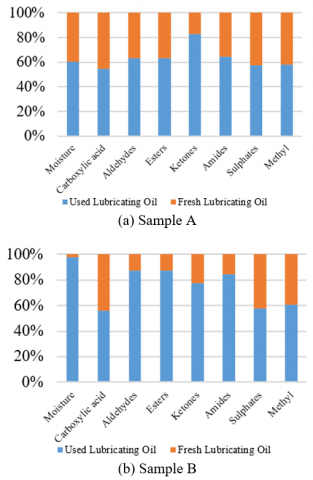
The FT-IR spectroscopy has shown that the oxidation reaction has produced significant carbonyl compounds along with sulphonates and esters. It has also been observed that the moisture content has been very insignificant because of the working environment of the lubricating oil where air is not allowed to enter the inner peripheries of the engine as shown in Figure 8(a) and Figure 8(b). The forecast analysis has predicted that the feasible conditions remain valid till 6000 to 7000 hours of running engine. This could vary if the working conditions are changed. The drastic increase in total acid number (TAN) values of both oil samples, is confirmed by FTIR analysis which also shows high peaks at the regions of oxidation by-products. The prolonged exposure of lubricating oil to oxidation reactions resulted in increase in TAN. In general, after performing all of the above tests, we have reached a conclusive observation that each physical characteristic of lubricating oil deteriorates at an interval which is proportional to other physical properties however the rate of deterioration can vary between them.
Table 6. Area of peak calculation of FT-IR spectra of sample A
|
Compound |
Structure |
Area of Peak (mm2) |
|
|
Used Lubricating oil |
Fresh Lubricating oil |
||
|
Moisture |
H2O |
5.1338 |
3.3333 |
|
Carboxylic Acid |
-COOH |
362.193 |
302.6576 |
|
Aldehydes |
-CHO |
30.0674 |
17.3575 |
|
Esters |
-COOR' |
13.2678 |
7.6736 |
|
Ketones |
-CO- |
20.6624 |
4.2218 |
|
Amides |
-C(O)NH2 |
29.8614 |
16.6725 |
|
Sulphates |
-SO2 |
49.862 |
36.4803 |
|
Methyl group |
-CH3 |
97.1703 |
70.6266 |
|
Compound |
Structure |
Area of Peak (mm2) |
|
|
Used Lubricating oil |
Fresh Lubricating oil |
||
|
Moisture |
H2O |
13.5176 |
0.3048 |
|
Carboxylic Acid |
-COOH |
341.7528 |
270.456 |
|
Aldehydes |
-CHO |
24.4776 |
3.4668 |
|
Esters |
-COOR' |
5.2622 |
0.7728 |
|
Ketones |
-CO- |
10.6191 |
3.1066 |
|
Amides |
-C(O)NH2 |
20.2007 |
3.6421 |
|
Sulphates |
-SO2 |
47.5394 |
34.9851 |
|
Methyl group |
-CH3 |
39.3954 |
25.2648 |
The present research has endeavored to provide a general understanding of the efficiency of lubricating oil sample by evaluating the standard physiochemical properties such as TAN, flash point, viscosity etc. and compared to the FT-IR transmission spectrum. The proper addition of additives could extend the working tenure of the lubricating oil. FT-IR has helped comprehend the anomalies at the molecular level of the oil.
An effective lubricant solution could help overcome many challenges faced in oil and gas operations such as excessive heat, extreme loads, corrosion and fluid leakages etc. Vigilant monitoring of lubricant deterioration rate could help combat foam and sludge formation, increase production rate and decrease downtime. Lubricating oils are used in many operations such as drilling, completion, workover, simulation and refining encompassing many equipment such as diesel engines, mud pumps, top drive units etc.
The research inferred to contribute towards establishing a relative deterministic approach for predicting the oxidative tendencies of lubricating oils whilst keeping in view its physical characteristics.
[1] Noria Corporation. Lubrication Basics. https://www.machinerylubrication.com/Read/24100/lubrication-basics, accessed on Feb 25, 2019.
[2] ATS Electro-Lube (Europe). Oil & Gas Lubrication Systems. https://atselectrolube.eu/oil-and-gas-sector-lubrication, accessed on Feb 26, 2019.
[3] Tirmizi, S.T., Tirmizi, S.R.U.H. (2017). Hierarchical linear modelling of risk assessment of petroleum installations. Mathematical Modelling of Engineering Problems, 4(4): 139-144. https://doi.org/10.18280/mmep.040401
[4] Tirmizi, S.T., Tirmizi, S.R.U.H. (2017). GIS based risk assessment of oil and gas infrastructure in Sindh, Pakistan. Environmental and Earth Sciences Research Journal, 4(3): 55-59. https://doi.org/10.18280/eesrj.040301
[5] Weatherford, W.D., Valtierra, M.L., Ku, P.M. (1968). Mechanisms of wear in misaligned splines. ASME Journal of Lubrication Technology, 90(1): 42-48. https://doi.org/10.1115/1.3601559
[6] Godfrey, D. (1974). Fretting wear of steels in lubricating oil. In AGARD Conference Proceedings.
[7] Yuksek, L., Kaleli, H., Zener, O., Zouz, B. (2009). The effect and comparison of biodiesel-diesel fuel on crankcase oil, diesel engine performance and emissions. FME Transactions, 2(37): 91-97. https://doi.org/10.1007/BF01204044
[8] Klaus, E.E., Bieber, H.E. (1964). Effect of some physical and chemical properties of lubricants on boundary lubrication. ASLE Trans, 7(1): 1-10. https://doi.org/10.1080/05698196408972030
[9] Fein, R.S., Kreuz, K.L. (1965). Chemistry of boundary lubrication of steel by hydrocarbons. ASLE Trans., 8(1): 29-38. https://doi.org/10.1080/05698196508972076
[10] Wilson, B.S, Garner, F.H. (1951). The role of peroxides in the corrosion of lead by lubricating oils. Journal of the Institute of Petroleum, 37(1): 225.
[11] Rudston, S.G., Whitby, R.D. (1971). The effect of model lubricating oil constituents on the wear of steel. Journal of the Institute of Petroleum, 57(1): 189-203.
[12] Yasutomi, S., Maeda, Y., Maeda, T. (1981) Kinetic approach to engine oil. 2. Antioxidant decay of lubricant in engine system. Ind. Eng. Chem. Prod. Res. Dev., 20(3): 246-540. https://doi.org/10.1021/i300003a021
[13] Shah, R., Kelly, J. (2016). Estimation of Temperature and Effects of Oxidation in Thermal Elastohydrodynamic Lubrication. Lubrication Fundamentals III–Session 3B, Las Vegas, USA.
[14] Hsu, S., Klaus, E.E., Cheng, H.S. (1988). A mechano~hemical descr~tive model for wear under mixed lubrication conditions. Wear, 128(1988): 307-323.
[15] Tirmizi, S.R.U.H., Khan, N. (2014). Mathematical analysis of side effects of HIV/AIDS medication. Bangladesh Journal of Medical Sciences, 13(2): 119-123. https://doi.org/10.3329//bjms.v13i2.13884
[16] Hucknall, D.J. (1974). Selective Oxidation of Hydrocarbon. Academic Press. New York, USA.
[17] Klaus, E.E., Ugwuzor, D.I. (1985). Lubricant-metal interaction. JSLE International Tribology Conference, Tokyo, Japan.
[18] Lubricantion Management. What Effects Does Oxidation Have on Lubricant Oil. http://lubrication-management.com/en/2017/05/11/what-effects-does-oxidation-have-on-lubricant-oil/, accessed on Feb. 27, 2019.
[19] Avomeen. The uses of ASTM standards for chemical analysis. https://www.avomeen.com/the-uses-of-astm-standards-for-chemical-analysis/, accessed on Mar. 2, 2019.
[20] Tirmizi, S.T., Tirmizi, S.R.U.H. (2018). GIS based risk assessment of oil spill and gas leakage vulnerable zones in Pakistan. Mathematical Modelling of Engineering Problems, 5(3): 190-196. https://doi.org/10.18280/mmep.050309
[21] Tirmizi, S.R.U.H., Khan, N., Tirmizi, S.T., Tirmizi, S.A. (2019). Mathematical epidemic model of HIV/AIDS in Pakistan. Bangladesh Journal of Medical Science, 18(1): 14-23. https://doi.org/ 10.3329/bjms.v18i1.39541
[22] Tirmizi, S.R.U.H., Tirmizi, S.T., Khan, N. (2018). Spatial analysis of HIV/AIDS in Pakistan. Bangladesh Journal of Medical Sciences, 17(3): 443-438. https://doi.org/10.3329/bjms.v17i3.36999
[23] Fox, N.J., Stachowiak, G.W. (2007). Vegetable oil-based lubricants-A review of oxidation. Tribology International, 40(7): 1035-1046. https://doi.org/10.1016/j.triboint.2006.10.001