Bayu Rudiyanto* | Titah Ano Raga | Totok Prasetyo | Dedi Eko Rahmanto | Mochammad Nuruddin | Nugroho Agung Pambudi | Kukuh Mukti Wibowo
© 2020 IIETA. This article is published by IIETA and is licensed under the CC BY 4.0 license (http://creativecommons.org/licenses/by/4.0/).
OPEN ACCESS
PT. POMI Paiton Unit 3 is one of big steam power plant in Indonesia that provide electricity with a capacity of 1 x 815 MW. This power plant requires a large amount of coal to produce electricity with a lot of large quantities, estimates of the total consume coal amounted to 3.06 million tons / year. The performance of the power plant PT. POMI Unit 3 can be optimized by modifying the Heat Exchanger Network (HEN). Pinch method is used to optimize HEN, this method provides a good opportunity in the design or in evaluating HEN system. Research has been carried capable increase efficiency of 0.5% of the power plant that was originally 28.45% to 28.95%, and can reduce fuel use by 1.71 kg / s initially as much as 97.99 kg / s to 96.28 kg / s, and can also be reconstructed from the re-arrangement of Heat Exchanger Network of Power Plant PT. POMI Unit 3 Paiton.
analysis of efficiency, pinch analysis, heat exchanger network
World energy usage is increasing rapidly, this increasing energy caused by many of the world community highly dependent on energy to support day-to-day life. Based on the Agency for the Assessment and Application of Technology (2018) Ministry of Energy and Mineral Resources in Indonesia Energy Outlook 2018 [1] the electricity demand continues to grow rapidly in all sectors, especially in the household and commercial sectors. It increased on average by 6.0% per year until 2050 to 7.4 times that of consumption in 2016.
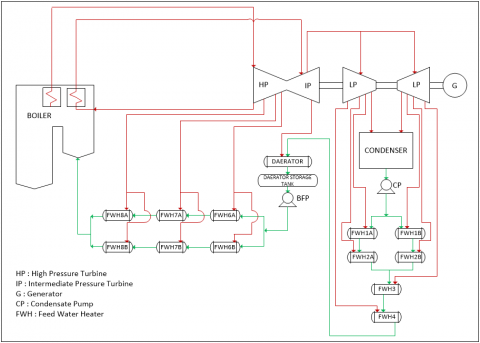
Generator Steam Power (power plant) is a power generation system that uses the energy of hot steam is converted into mechanical energy and transmitted to a generator to produce electricity [2, 3]. One of electricity producers that use this type of power plant steam is PT. POMI Unit 3 Paiton Power Plant with installed capacity of 1 x 815 MW. The power generated by three turbines installed one axis, the turbine HP (High Pressure), IP (Intermediate Pressure) and LP (Low Pressure). This unit using two types of feed system water heater which consist of 12 closed feedwater heater and an open feedwater heater.
Feedwater heater is useful to raise the temperature of water in the boiler. Feedwater heater source comes from the extraction on steam turbine, but this process reduces power generation by turbine. However, it can be reducing the thermal load of the boiler [4]. Pinch analysis is used to calculate the design or in evaluating a system height exchanger Networks (HEN) such as reduced operating costs, simplify processes, improve efficiency, reduction and capital investment planning [4-9].
The research was conducted on components Feed Water Heater and Extraction Steam which is a component of Heat Exchangers where the Feed Water Heater as cold flow and Extraction Steam as the heat flow, function Feed Water Heater in Power Plant as preheating water will enter the boiler is expected to use the analysis Pinch can increase efficiency and energy savings as well as giving an overview of design more efficient on Heat Exchanger Network (HEN) geothermal plant PT. POMI Paiton [10].
2.1 Heat Exchanger Networks (HEN)
Heat exchangers network (HEN) is an arrangement of several heat exchangers that operate in an integrated manner in a process. This formation is expected to increase system efficiency. The design of the heat exchanger network is a key aspect in designing chemical processes, even in certain circumstances, to improve the composition of the heat exchanger network can reduce energy consumption in line with the reduction of capital by 20-30% [6, 8]. The HEN planning based on minimum energy requirements. The minimum number of HE (Umin,) is generally the number of process streams and utilities. The calculation of the (Umin) on a HEN required under energy needs minimum or maximum energy that can be recycled, or evaluation of heat exchanger network design that already exist can be done by using the graph Euler's theorem. This calculation can be completed by the following equation:
Umin = N-1 (1)
Umin is the minimum number and N is the number of process streams and utilities.
2.2 Pinch analysis
Pinch analysis is done by calculating the balance of Mass and Energy Balance of System Processes and equality - equality based on the first and second law of thermodynamics. The equation used is as follows:
Heat capacity flow (CP)
CP = M x Cp (2)
The enthalpy change (ΔH), Law of Thermodynamics I
$\Delta \mathrm{H}=\mathrm{Q} \pm \mathrm{W}$ (3)
The lack of change in the mechanical energy of W = 0, So the equation is transformed into ΔH = Q, and Q = C x (Tout - Tin), so that it becomes:
$\Delta \mathrm{H}=\mathrm{CP} x(\text { Tout-Tin })$ (4)
The thermal efficiency (ƞ) is defined as the ratio of net business (WNET) generated against energy input (Qin). Thermal Efficiency Heat Exchanger can be formulated as follows [11]:
$\eta=\mathrm{W}$ net/Q $\mathrm{in} \times 100 \%$ (5)
Steam cycle power plant in PT. POMI Unit 3 has 10 main components as in Figure 1. The study was conducted on Heat Exchangers in Feed Water Heater with heat flow in the form of Extraction Steam or residual steam turbine propulsion seen on the red color line. Table 1 is preliminary data obtained from log sheet operations and production data. The data taken is as follows:
3.1 Problem analysis table
Analysis of the Problem Table aims to determine the value of the pinch and describes the maximum amount of heat energy exchange at each interval to determine the temperature and also the lack of energy in the process of heat exchange in each of the streams of hot and cold flow.
Table 1 is the data needed for the analysis process pinch. The value of the specific heat capacity (CP) resulting from the calculation by using Eq. (2). This preliminary data is the result of the extraction of data that has not changed ΔTmin.
ΔTmin obtained from the analysis in Table 2 is by way of determining the smallest of temperature differences in the flow of hot or cold flow contained in the data used.
Table 2 shows the smallest value of ΔT is ΔTmin allowable value that is equal to 19,755℃. After determining the value of ΔTmin, will dilakuakan analysis on the problem of table.
Figure 1. Schematic of steam power cycle power plant PT POMI Unit 3
Table 1. Initial data analysis pinch
|
No. |
Component |
Tin (℃) |
Tout (℃) |
M (kg / s) |
Cp (kJ / kg℃) |
CP (kW / ℃) |
|
1 |
LP FWH No. 1A |
37.794 |
59.718 |
226.409 |
4.174 |
945.03117 |
|
2 |
LP FWH No. 1B |
38.283 |
59.914 |
226.409 |
4.174 |
945.03117 |
|
3 |
LP FWH No. 2A |
59.718 |
84.329 |
226.409 |
4.182 |
946.84244 |
|
4 |
LP FWH No. 2B |
59.914 |
84.247 |
226.409 |
4.182 |
946.84244 |
|
5 |
LP FWH No. 3 |
84.329 |
105.33 |
226.409 |
4,203 |
951.59703 |
|
6 |
LP FWH No. 4 |
105.3 |
137.92 |
226.409 |
4.244 |
960.8798 |
|
7 |
deaerator |
138.34 |
167.37 |
220.2 |
4.32 |
951.264 |
|
8 |
HP FWH No. 6A |
174.35 |
200.97 |
265.063 |
4.352 |
1153.5542 |
|
9 |
HP FWH No. 6B |
174.45 |
201.06 |
265.063 |
4.352 |
1153.5542 |
|
10 |
HP FWH No. 7A |
200.97 |
238.64 |
265.063 |
4.487 |
1189.3377 |
|
11 |
HP FWH No. 7B |
201.06 |
238.82 |
265.063 |
4.488 |
1189.6027 |
|
12 |
HP FWH No. 8A |
238.64 |
263.95 |
265.063 |
4.69 |
1243.1455 |
|
13 |
HP FWH No. 8B |
238.82 |
264.16 |
265.063 |
4.692 |
1243.6756 |
|
14 |
LP Extraction No. 1A |
60.965 |
40.963 |
247.7 |
4.182 |
1035.8814 |
|
15 |
LP Extraction No. 1B |
61.727 |
41.972 |
247.5 |
4.182 |
1035.045 |
|
16 |
LP Extraction No. 2A |
127.2 |
62.853 |
9.422 |
38.49 |
362.65278 |
|
17 |
LP Extraction No. 2B |
126.98 |
63.47 |
9.326 |
38.9 |
362.7814 |
|
18 |
LP Extraction No. 3 |
189.61 |
89.514 |
104.1 |
1,918 |
90.35698 |
|
19 |
LP Extraction No. 4 |
283.71 |
109.07 |
12.15 |
14.78 |
179.577 |
|
20 |
LP Extraction No. 5 |
373.94 |
167.37 |
11.02 |
12.13 |
133.6726 |
|
21 |
HP Extraction No. 6A |
462.84 |
178.74 |
11.65 |
9.274 |
108.0421 |
|
22 |
HP Extraction No. 6B |
462.84 |
178.74 |
11.65 |
9.274 |
108.0421 |
|
23 |
HP Extraction No. 7A |
312.04 |
203.35 |
20.83 |
19.78 |
412.0174 |
|
24 |
HP Extraction No. 7B |
312.04 |
204.54 |
20.94 |
19.95 |
417.753 |
|
25 |
HP Extraction No. 8A |
363.17 |
243.08 |
15.31 |
17.11 |
261.9541 |
|
26 |
HP Extraction No. 8B |
363.17 |
243.08 |
15.34 |
17.11 |
262.4674 |
|
No. |
Component |
Tin (℃) |
Tout (℃) |
ΔT (℃) |
|
1 |
LP FWH No. 1A |
37.794 |
59.718 |
21.924 |
|
2 |
LP FWH No. 1B |
38.283 |
59.914 |
21.631 |
|
3 |
LP FWH No. 2A |
59.718 |
84.329 |
24.611 |
|
4 |
LP FWH No. 2B |
59.914 |
84.247 |
24.333 |
|
5 |
LP FWH No. 3 |
84.329 |
105.326 |
20.997 |
|
6 |
LP FWH No. 4 |
105.299 |
137.922 |
32.623 |
|
7 |
deaerator |
138.337 |
167.367 |
29.03 |
|
8 |
HP FWH No. 6A |
174.354 |
200.9715 |
26.618 |
|
9 |
HP FWH No. 6B |
174.447 |
201.057 |
26.61 |
|
10 |
HP FWH No. 7A |
200.972 |
238.638 |
37.666 |
|
11 |
HP FWH No. 7B |
201.057 |
238.817 |
37.76 |
|
12 |
HP FWH No. 8A |
238.638 |
263.952 |
25.314 |
|
13 |
HP FWH No. 8B |
238.817 |
264.164 |
25.347 |
|
14 |
LP Extraction No. 1A |
60.965 |
40.963 |
20.002 |
|
15 |
LP Extraction No. 1B |
61.727 |
41.972 |
19.755 |
|
16 |
LP Extraction No. 2A |
127.2 |
62.853 |
64.347 |
|
17 |
LP Extraction No. 2B |
126.979 |
63.47 |
63.509 |
|
18 |
LP Extraction No. 3 |
189.606 |
89.514 |
100.09 |
|
19 |
LP Extraction No. 4 |
283.708 |
109.066 |
174.64 |
|
20 |
LP Extraction No. 5 |
373.944 |
167.367 |
206.58 |
|
21 |
HP Extraction No. 6A |
462.839 |
178.737 |
284.1 |
|
22 |
HP Extraction No. 6B |
462.839 |
178.737 |
284.1 |
|
23 |
HP Extraction No. 7A |
312.042 |
203.348 |
108.69 |
|
24 |
HP Extraction No. 7B |
312.042 |
204.539 |
107.5 |
|
25 |
HP Extraction No. 8A |
363.168 |
243.076 |
120.09 |
|
26 |
HP Extraction No. 8B |
363.168 |
243.076 |
120.09 |
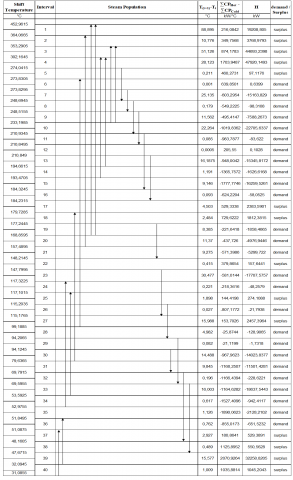
Table 4 shows the population of the relationship between the flow or cold flow and heat flow. Results from Table Problem analysis algorithms were used to describe the cascade diagram as shown in Figure 3 is used to analyze the utility of hot and cold utility also has a function as determining the value of a pinch. Pinch value is determined by addressing energy shortage, minus the value of the Cascade diagram showing a lack of energy that is used to achieve the desired temperature
Based on Figure 2 it can be seen that the pinch is 51,0875℃. Pinch Point value lies in the utility value of 0 (zero) then pulled straight to determine the temperature that corresponds to the Problem Pinch table algorithms.
3.2 Composite curve analysis, shifted composite and grand composite
Composite curve analysis, composites and Grand Composite shifted using the data from the analysis of the problem of table.
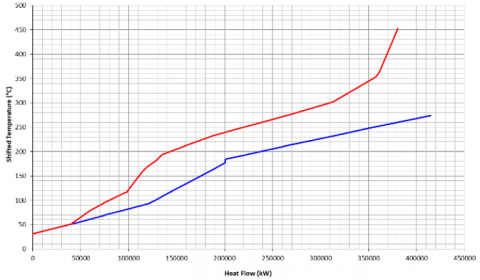
3.2.1 Composite curves
Analysis of the composite curve in Figure 3. The curves obtained from the relationship between the temperature in the hot stream and the cold stream of the Heat Flow. Heat flow curve depicted on the red line and the cold flow curve drawn from the blue line, Value pinch it can be seen from a position adjacent stream.
3.2.2 The curve shifted composites
Analysis shifted composite curves have the same process with a composite curve, the difference lies in the shift of the curve caused by a shift in the temperature of the treatment ΔTmin so that it can be seen that the curve of the yield curve ΔTmin treatment of cold flow and heat flow into contact as shown in Figure 4.
Figure 2. Cascade
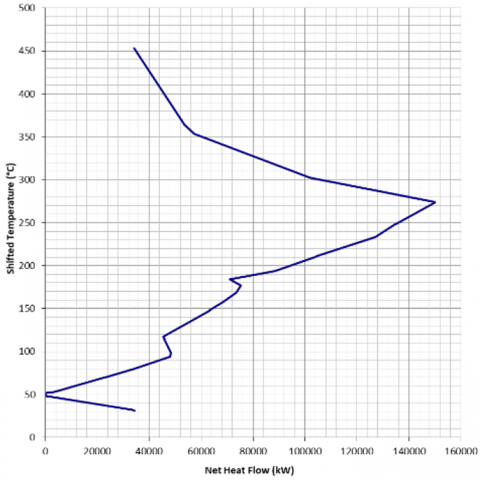
3.2.3 Grand composite curve
Grand composite curve in Figure 6 derived from net heat flow graph with temperatures already in the pan or the temperature shifted. Grand composite curves are used to establish the utility of multiple targets. Grand composite curve also illustrates the difference between the possible heating of the heat flow to the heating required by cold flow.
Based on Figure 4 and Figure 5 knowable differences before and after analyses flow pinch. Figure 4 shows the distance between the hot and cold flow far enough when compared with Figure 5. The effect of distance between the cold flow and heat flow caused by the temperature difference is greater the distance between the flow, the greater the energy needs, loss of energy, and more little effectiveness. Heat Value Recovery when two streams of hot and cold streams are combined in Figure 4 is 380555,9744kW and in Figure 5. amounting 346,243.4772 kW. Heat Recovery value obtained from slices of the curve, while the remainder of the slices on each of the heat flow curve or cold flow is minimum energy demand.
Based on Figure 6, known that touches the curve shifted diagram Pinch Temperature is a value that is 51.0875℃, the diagram on the highest position that is equal to 34321.49717 Duty Heating kW, and the diagram on the bottom shows the Cooling Duty is equal to 34383.97676 kW.
3.3 Efficiency analysis
Analysis of the efficiency of using Eq. (5) with WNET is the turbine output value and Qin is the value of the input energy. The efficiency obtained is the efficiency of the entire power plant.
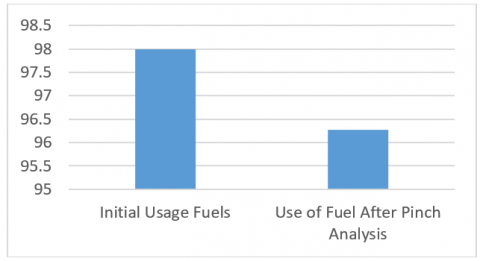
Based on Table 5 it can be seen that pinch analysis is able to reduce energy consumption in the process of electricity production in power plants PT POMI Unit 3 is equal to 34383.98 kW. Later in Table 6 and Figure 6 note that the analysis pinch able to increase the efficiency of 0.506%, and in Table 7 and Figure 7 known that pinch analysis is also able to reduce fuel consumption that is equal to 1.714 kg / s.
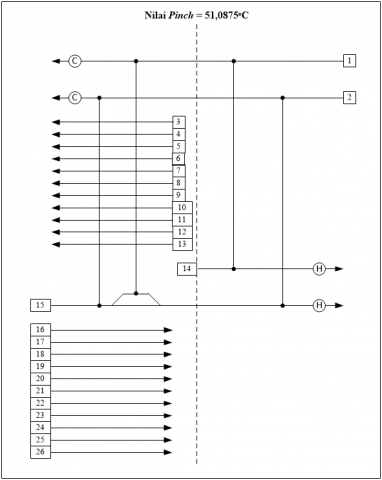
3.4 Grid diagram
Heat Exchanger Design Network is a procedure combining the two streams of hot and cold with mutual objectives and optimize energy transfer requiring less additional energy (either heating or cooling [12]. Diagram grid work according to the rules of analysis Pinch i.e. (Figure 8), no additional heat below Pinch utilities, no additional utility over Pinch cold, and there is no heat transfer across the pinch. If there is displacement across Pinch, then it must be set back Pinch to add some heat on the top of the Pinch and a cold load at the bottom of the Pinch.
Diagram design grid on the final results use a split or separation of flow, flow separation occurs because of lack of appropriate flow if integrated so that the necessary separation with no violation of the rules on the CP using design data from Table 3.
Based on the results of the design grid diagrams have been obtained, derived design modifications to the flow diagram of Feed Water Heater and a new Steam Extraction. Here is a flow diagram after Pinch analysis (Figure 9).
Table 3. ΔTmin problem 19,755℃
|
No. |
Component |
Tsin (℃) |
Tsout (℃) |
CP (KW / ℃) |
H (KW) |
ΔH (KW) |
|
1 |
LP FWH No. 1A |
47.67 |
69.60 |
945.03 |
20718.86 |
|
|
2 |
LP FWH No. 1B |
48.16 |
69.79 |
945.03 |
20441.97 |
|
|
3 |
LP FWH No. 2A |
69.60 |
94.21 |
946.84 |
23302.74 |
|
|
4 |
LP FWH No. 2B |
69.79 |
94.12 |
946.84 |
23039.52 |
|
|
5 |
LP FWH No. 3 |
94.21 |
115.20 |
951.60 |
19980.68 |
|
|
6 |
LP FWH No. 4 |
115.18 |
147.80 |
960.88 |
31346.78 |
|
|
7 |
deaerator |
148.21 |
177.24 |
951.26 |
27615.19 |
|
|
8 |
HP FWH No. 6A |
184.23 |
210.85 |
1153.55 |
30704.73 |
|
|
9 |
HP FWH No. 6B |
184.32 |
210.93 |
1153.55 |
30696.08 |
|
|
10 |
HP FWH No. 7A |
210.85 |
248.52 |
1189.34 |
44797.59 |
|
|
11 |
HP FWH No. 7B |
210.93 |
248.69 |
1189.60 |
44919.40 |
|
|
12 |
HP FWH No. 8A |
248.52 |
273.83 |
1243.15 |
31468.98 |
|
|
13 |
HP FWH No. 8B |
248.69 |
274.04 |
1243.68 |
31523.45 |
380,555.97 |
|
14 |
LP Extraction No. 1A |
51.09 |
31.09 |
1035.88 |
20719.70 |
|
|
15 |
LP Extraction No. 1B |
51.85 |
32.09 |
1035.05 |
20447.31 |
|
|
16 |
LP Extraction No. 2A |
117.32 |
52.98 |
362.65 |
23335.62 |
|
|
17 |
LP Extraction No. 2B |
117.10 |
53.59 |
362.78 |
23039.88 |
|
|
18 |
LP Extraction No. 3 |
179.73 |
79.64 |
90.36 |
20047.27 |
|
|
19 |
LP Extraction No. 4 |
273.83 |
99.19 |
179.58 |
31361.69 |
|
|
20 |
LP Extraction No. 5 |
364.07 |
157.49 |
133.67 |
27613.68 |
|
|
21 |
HP Extraction No. 6A |
452.96 |
168.86 |
108.04 |
30694.98 |
|
|
22 |
HP Extraction No. 6B |
452.96 |
168.86 |
108.04 |
30694.98 |
|
|
23 |
HP Extraction No. 7A |
302.16 |
193.47 |
412.02 |
44783.82 |
|
|
24 |
HP Extraction No. 7B |
302.16 |
194.66 |
417.75 |
44909.70 |
|
|
25 |
HP Extraction No. 8A |
353.29 |
233.20 |
261.95 |
31458.59 |
|
|
26 |
HP Extraction No. 8B |
353.29 |
233.20 |
262.47 |
31520.24 |
380,627.45 |
Figure 4. The curve shifted composites
Table 4. Problem table algorithm
Figure 5. Grand composite curve
Figure 6. Efficiency
Table 5. Data calculation of efficiency
|
|
Value |
Unit |
|
HHV Coal |
20058.10 |
kJ / kg |
|
wnet Turbine |
559,099.97 |
kW |
|
Early Qin |
1,965,493.22 |
kW |
|
Qin After Pinch Analysis |
1,931,109.24 |
kW |
|
Qin reduction |
34383.98 |
kW |
|
|
Value |
Unit |
|
Early Plant Efficiency |
28.445785 |
% |
|
Efficiency After Pinch Analysis |
28.952271 |
% |
|
Increased Efficiency |
0.5064857 |
% |
|
|
Value |
Unit |
|
Initial Usage Fuels |
97.99 |
kg / s |
|
Use of Fuel After Pinch Analysis |
96.275781 |
kg / s |
|
Usage Fuels Reduction |
1.714219 |
kg / s |
Figure 8. Diagram design grid
Figure 9. Flow diagram after pinch analysis
Based on the analysis that has been done, it can be concluded as follows:
(1) Pinch analysis is able increase efficiency of 0.5% of the power plant that was originally 28.45% to 28.95%, and can reduce fuel use by 1.71 kg / s initially as much as 97.99 kg / s to 96.28 kg / s.
(2) Pinch analysis is able to reconstruct the arrangement of the Heat Exchanger Network of Power Plant PT. POMI Unit 3 avoid writing long formulas with subscripts in the title; short formulas that identify the elements are fine (e.g., “Nd–Fe–B”).
This research was well performed with support from PT POMI UNIT 3 Paiton, Probolinggo, East Java, Indonesia WHO Provided the data needed for analysis.
[1] Resosudarmo, B.P. (2018). Agency for the Assessment and Application of Technology (BPPT). 2018 Sustainable Energy for land transportation in Indonesia Energy Outlook 2018, Jakarta: Ministry of Energy and Mineral Resources.
[2] Muhammad Reza, N.J., Sesetyo Paul, W., Hariyanto. (2010). Simulation of Temperature Control System in the Boiler Reheater in Paiton Unit 7 & 8 Pages. Department of Electronic Engineering, Politeknik Elektronika Surabaya. Surabaya.
[3] Hetharia, M., Lewerissa, Y.J. (2018). Energy analysis on planning steam power (power plant) with cycle tempo. Voering Journal, 3(1).
[4] Kemp, I.C. (2007). Pinch Analysis and Process Integration: A User Guide on Process Integration for the Efficient Use of Energy. Second Edition. Linacre House, Jordan Hill: Elsevier Ltd.
[5] Ataei. A., ChangKyoo, Y. (2010). Combined pinch and exergy analysis for energy efficiency optimization in a steam power plant. International Journal of the Phsycal Sciences, 5(7): 1110-1123. https://doi.org/10.1142/S0218127410027064
[6] Eskandari, F., Behzad, M. (2009). Higher efficiency targeting a steam power plant by using pinch technology. UPB Scientific Bulletin, Series D: Mechanical Engineering, 71(4): 29-42.
[7] Natural Resource Canada. (2003). Pinch analysis: For the efficient use of energy, water and hydrogen. Canada: Natural Resources Canada.
[8] Martinez-Hernandez, E., Tibessart, A., Campbell, G.M. (2018). Conceptual design of integrated production of arabinoxylan products using bioethanol pinch analysis. Food and Bioproducts Processing, 112: 1-8. https://doi.org/10.1016/j.fbp.2018.08.005
[9] Linnhoff, B., Hindmarsh, E. (1983). The pinch design method for heat exchanger networks. Journal of Chemical Engineering Science, 38(5): 745-763. https://doi.org/10.1016/0009-2509(83)80185-7
[10] PT. POMI. (2018). Standard Reports PT POMI. Probolinggo.
[11] Mukesh, S. (2002). Pinch Technology: Basics for Beginners. http://www.cheresources.com.
[12] Agency for the Assessment and Application of Technology (BPPT). (2015). Procedures and Technical Standards in Industrial Energy Audit. South Tangerang: Center for Energy Technology.