OPEN ACCESS
Buildings are one of the major energy consumers. Thus, it is crucial to develop new solutions in order to retrofit existent buildings (especially for public buildings), achieving both energy saving and environmental protection. The proposed solutions are in many cases expensive and it is necessary to evaluate them case by case. The present analysis focuses on the development of a methodology useful to select and evaluate different energy retrofitting solutions and it is applied to energy simulations of the Monoblocco Pavilion at the San Martino Hospital in Genova, Italy. The model allows to evaluate the building heating and cooling loads and to predict the energy requests associated to different retrofit scenarios. The selected retrofit technologies include some innovative solutions such as façade super insulated void panel, smart rotating windows with different emissivity glass and sunlight carrying optic-fiber coupled with dimmed LED lighting system. Results have been analyzed in terms of hourly values of selected variables and the different effects related to the retrofit strategies have been compared in terms of energy saving. The comparison included also the Simple Pay Back Period (SPB) of the investment in order to identify the best technologies combination also from an economic point of view.
energy saving, buildings, retrofitting, energy plus, dynamic simulations
Energy consumption is tightly linked to buildings and their intended use, as reported by Spyroupoulos et al. [1], with 39% of the total energy consumption in Europe ascribed to commercial and residential buildings. The final energy consumption in European non-residential buildings (NR-buildings) is dominated by space heating and cooling, electric equipment and lighting. In particular, electrical energy consumption has exhibited a constant increase over the last years due to the extensive use of HVAC and office equipment (electronic devices and computers) and is expected to increase from 42% in 2005 to almost 50% of the total energy consumption by 2030.
Moreover, Griego et al. [2] have given evidences of the fact that a correct optimization approach with an integrative energy analysis, can lead to a reduction of about 50% of the energy consumption in offices.
Energy saving and new technologies able to realize it are a key research topic, with many studies developed during recent years. Boyano, Hernandez and Wolf [3] proposed a methodology suitable for identifying what is the best combination of technical solutions in order to achieve the maximum energy saving. For instance, they observed that a high insulation is a best practice in cold and medium climates while for warmer climate the situation should be investigated case by case.
Retrofitting interventions have to be carried out with economical and comfort parameters in mind. Penna et al. [4] pointed out that some conventional energy efficiency measures allow to approach the zero energy target maintaining the economical convenience but worsening the indoor thermal comfort. In this perspective, they highlighted the importance of subsidies to sustain more smart but expensive solutions.
In the determination of the building energy consumption, Aksoezen et al. [5] showed that the building age of construction can be used as an indicator to roughly estimate the annual energy request by a building. The approach proposed can be very useful to address the intervention solutions as well, since it could facilitate a systematic improvement of the existing building stock.
Considering the retrofitting problem in a more complex way, Wu et al. [6] showed that it is possible to use a multi-objective neighborhood field optimization (MONFO) algorithm to find optimal retrofit strategies. The model takes also into account the possible maintenance costs of the selected interventions. The analysis showed that the algorithm is suitable to obtain accurate optimal solutions for energy efficient retrofit, and the maintenance strategy optimization can further improve the overall intervention performances. Vollaro et al. [7] investigated the differences in the results obtained from simulations run with a semi-stationary approach versus those obtained with a dynamic one. The studied building is located in the peripheral part of an historical city in central Italy. Results were validated with in-situ measurements of the thermal transmittance of the opaque walls by means of a heat flow meter and of the temperature field by means of a thermographic camera. The dynamic approach seems to be essential to deal with the inertial properties of the structure and to calculate the annual energy demand in an accurate way.
In the present paper, different retrofit technologies have been analyzed in order to evaluate the best intervention combination suitable for the retrofit of a case study building (the Monoblocco in San Martino city hospital). First, a list of Key Performance Indicators (KPIs) has been selected to identify the areas with most benefit from the retrofitting action. For the analyzed case study, external walls, windows and lighting system have been selected and arranged into intervention packages. The building have been dynamically simulated for each case in Energy plus environment and the results compared with the base case situation in term of energy consumption and simple payback period.
Different technologies can be applied in buildings retrofit to enhance the energy performance.
In this study, three innovative technologies have been analysed:
- Façade: super insulating and ventilated Void Insulated Panels (VIP);
- Windows: smart rotating windows with sealing hydraulic gasket;
- Lighting system: Intelligent Lighting Control (ILC) LED and solar light optic fiber system;
2.1 Super Insulated VIP Façade
One of the main issues related to facade insulation is that the classical insulation materials have thermal properties which impose high insulation thicknesses. When the building has historic or aesthetic value, insulation has to be installed on the inner side of the façade; this solution can induce problems of moist formation, superficial and interstitial condensation, in addition to a reduction of the total useful volume of the building. The insulation operated with the installation of VIP panels is 5 to 8 times [8] more efficient than the usual insulation technologies; thus the thickness of the panels will be much smaller.
The insulation layer thickness in VIP is equal to 30 mm, with an outstanding value of the transmittance U1D < 0.2 W/m2K. Further increases in insulation thickness are of limited efficiency, as the overall U-value is highly influenced by edge-of-panel thermal bridges.
The final installation solution consists of a continuous VIP layer adhered to the existing wall with a free standing standard plasterboard on the interior. It also includes reduction of thermal bridging at floor and ceiling by means of horizontal VIP insulation below existing floor finish and slab.
In the present study, a VIP façade developed by Isoleika has been considered. Its multilayer composition can be described as follow (material and thickness of each layer):
- Rubber laminated (3+3mm) and VIP insulation (30mm) adhered to existing wall;
- Polythene vapour barrier;
- Mineral wool insulation (40mm) within free standing aluminium vertical profiles (46mm);
- Oriented strand board (9mm);
- Plasterboard (15mm).
2.2 Smart Rotating Windows
Windows are one of the most common issues for the energy efficiency in buildings. The glass panels usually give worse insulation properties than walls, in particular the window frame introduces thermal bridge effects due to geometrical reasons as well as to material properties. Moreover, glazed surfaces have high transmittance values to incoming solar radiation that easily lead to green-house effect inside rooms, beneficial during winter but negative during summer.
Standard energy efficient windows provide very good thermal insulation (thanks to multiple glass layers and inert gas fillings between panes) as well as optimal sunlight control thanks to specific layers applied to the glass. However, during cold months, the solar radiation barrier can severely reduce positive effect of the free heating energy delivered by the sun (passive solar heating).
Smart rotating windows, developed starting from the idea of Bjorn Karlsson (University of Lund), have low emissivity e (high reflectivity) coating on one side and can revolve around hinges to switch between summer/winter configuration. The rotation allows the users to expose to the exterior the glass panes with no reflective coating during winter, allowing the sun to heat up the building.
The frame is equipped with hydraulic seals filled with non-freezing liquid. The liquid can be discharged in order to allow the sash to be rotated. Once it is in position, the gasket can be filled again, realizing a hermetic connection.
2.3 ILC LED and Solar Light Optic Fiber system
Lighting is very important for building comfort, and it is also an important share of the total annual energy balance (about 11% of energy use in residential buildings and 18% in commercial buildings [9]). For this reason, it is very important to develop solutions able to address this issue, without forgetting to maintain the right comfort level inside the buildings.
Maximize the use of daylight is aligned with the current and coming regulations for energy efficiency in buildings and also positive for the people visual comfort.
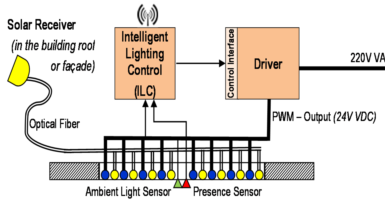
Toshiba developed an innovative lighting system, composed by different elements that are represented in Figure 1.
Basically, the system allows to capture natural sun light and to deliver it inside the building, by means of special diffusers. The natural illumination is supported with high efficiency LEDs that can be regulated depending on the zone illumination requirements as well as the natural light intensity (ILC – Intelligent Lighting Control). This system, coupled with presence sensors, allows minimizing the energy spent for interior lighting, greatly reducing the building energy needs.
Figure 1. Smart lighting system schematic
3.1 Geometry Drawing
The building 3D model has been created using the software Google Sketchup. In order to cope with the complex geometry of the whole structure of the building, the CAD plan view of each floor have been imported and then corrected in order to eliminate mismatches between outer surfaces.
Once the raw model has been ready, it has been imported in Openstudio, which acts as a graphical interface that helps the compilation of Energy Plus input file (idf file). Then, the correct boundary conditions has been assigned to every surfaces specifying if it is an external wall, an interior partition, a floor, a basement slab, in order to correctly establish which are the dispersing surfaces.
3.2 Glazed surfaces
According to Openstudio best practices, glazed surfaces have been included into the model by simplifing the windows geometry and using a built-in script (small utility programs written to help and speed up the modeling phase) to add fenestration via the definition of a wall to window ratio (WWR) (Table 1).
Table 1. Fenestration wall to window ratio
|
|
North façade |
South façade |
|
Wall Area [m2] |
17.94 |
12.47 |
|
Glazing Area [m2] |
9.59 |
9.20 |
|
Windows/Wall ratio [-] |
0.44 |
0.54 |
3.3 Shadowing surfaces
It is necessary to introduce into the model also the information regarding the shading surfaces and balconies. External shading surfaces alter the solar gains, influencing the energy balance, and are crucial in order to achieve energy savings.
Once the external shading surface are in place, it is possible to add also the windows blinds, that are controlled by means of a schedule, based on the solar radiation intensity: if the radiation is above a threshold, the blinds are unrolled down, otherwise they are kept rolled above the window.
3.4 Thermal bridge analysis
In a building, the contribution to heat losses due to thermal bridges is never negligible; in particular, in the analyzed building, due to the structure with balconies and overhangs, their contribution is very important.
Unfortunately, Energy plus does not provide the possibility to model and thus to take into account for them. Hence, for the calculations of the thermal bridges effects regarding the façades, this study refers to UNI EN ISO 6946:2008 and 14683:2008.
According to UNI 14683, the total heat flux dissipated by a wall can be calculated as:
$Q_{t o t}=U_{w a l l} \cdot A_{w a l l} \cdot \Delta T+\sum_{i=1}^{n} \phi_{i} L_{i} \Delta T$ (1)
given:
- Uwall is the wall transmittance calculated with Eq(1);
- Awall is the wall area without windows [m2];
- ΔT is the temperature difference between internal and external air, [K];
- φi is the linear thermal transmittance of the i-th thermal bridge, [W/mK];
- Li is the i-th thermal bridge length [m];
The linear thermal transmittance depends on the type of the thermal bridge as well as on the wall stratigraphy, and their reference values can be found in UNI 14683.
For the windows thermal bridge analysis, the software WINDOW 6 has been used, a free program developed by Lawrence Berkley National Laboratory (LBNL) which contains a rich library with all the most common glazing manufacturer product data. This software allows to define the window (in dimensions, number of glass panels, air or gas filled gaps, frame material and dimensions, dividers and shading devices) in order to calculate the total transmittance, the light visible transmissivity and the Solar Heat Gain Coefficient (SHGC). Table 2 summarizes the calculated quantities.
Table 2. Glazing main properties
|
Window type |
Transmittance [W/m2K] |
SHGC |
|
Low-e glazing 33/12/44 Antelio |
1.9 |
0.39 |
|
33/15/33 two layer glazing system |
3.3 |
0.34 |
|
70’ simple glazing 4 mm |
5.8 |
0.39 |
3.4.1 Example of calculation of thermal bridges for the south façade
The first step is to identify the modular element of the façade, in order to calculate the thermal bridges effect and then apply it to the whole surface (Figure 2).
Then it is possible to make a list of the wall stratigraphy, from external to internal side:
- External painting;
- Plaster (15 mm);
- Hollowed tiles (250 × 100 × 250 mm);
- Air gap (100 mm);
- Hollowed tiles (250 × 100 × 250 mm);
- Plaster (15 mm);
- Internal painting.
Figure 2. South façade modular element
Given the stratigraphy of the wall, the transmittance Uwall [W/m2K] is calculated by using the approach of the thermal resistances [m2/KW] and considering the contributions of the different layers.
$U_{\text {wall}}=\frac{1}{R_{\text {vall}}}$ (2)
$R_{\text {wall}}=R_{s, i}+\left(R_{\text {plaster}}+R_{\text {bricks}}+R_{\text {tot}, \text {air}}+\right.+R_{\text {concrete}}+R_{\text {plaster}} )+R_{s, e}$ (3)
where:
- Rs,i is effective internal thermal resistance [m2/KW];
- Rplaster is the conductive thermal resistance of the plaster [m2/KW];
- Rbricks and Rconcrete are the conductive resistances of, respectively, bricks and concrete [m2/KW];
- Rtot,air is the total thermal resistance of the air gap, which comprises the convective and radiative contributions [m2/KW];
- Rs,e is effective external thermal resistance [m2/KW];
Rs,i and Rs,e reference values can be found (for specified inner and outdoor conditions) in UNI 6946.
The total thermal air resistance Rtot,air have been calculated according to UNI 6946 [33]:
$R_{\text {tot}, \text {air}}=\frac{1}{h_{a}+h_{r}}$ (4)
Considering an air gap with width d [m], ha is the conductive/convective coefficient, calculated as:
$h_{a}=\max \left\{1.25, \frac{0.025}{d}\right\}$ (5)
hr is the radiative coefficient, calculated as:
$h_{r}=h_{r, 0} \cdot E$ (6)
where:
- hr,0 is the black body radiative coefficient, presented in Equation (3) as function of temperature
- E is a correction coefficient that takes into account the emissivities of the two surfaces constituting the air gap, e1 and e 2 respectively:
$E_{r}=\frac{1}{1 / \varepsilon_{1}+1 / \varepsilon_{2}-1}$ (7)
Table 3. Black body radiative coefficient for air gaps
|
Temperature [°C] |
hr,0[Wm-2K-1] |
|
-10 |
4.1 |
|
0 |
4.6 |
|
10 |
5.1 |
|
20 |
5.7 |
|
30 |
6.3 |
Knowing the total heat flux (with thermal bridges included), calculated according Equation (1), it is possible to define a theoretical increased thermal transmittance of the wall U*wall:
$U_{\text {wall}}^{*}=\frac{Q_{\text {tot}}}{A_{\text {wall}}}$ (8)
Table 4 compares the values of the wall transmittance without and with considering the thermal bridges effect.
In the Energy Plus model this contribution is taken into account by properly increasing the thermal conductivity of one of the conductive layers of the composite wall of the module.
Table 4. North and South façade wall transmittance without and with thermal bridge contributions
|
Transmittance [Wm-2K-1 ] |
North Façade |
South Façade |
|
W/O Thermal bridges Uwall |
1.37 |
1.09 |
|
With Thermal bridges U*wall |
1.71 |
2.15 |
3.5 Internal energy gains modeling
In order to obtain accurate results, a focal point is to correctly define the building internal gains. These are basically all the heating contributions (sensible or latent) that come from people, lighting and electrical equipment.
3.6 Thermal zones assignment
To correctly model the building, it is necessary to identify different thermal zones, according to ISO 13790. The zones are characterized mainly according to the intended use, keeping in mind differences in temperature set-points (Table 2), air changes per hour (ach) (Table 3), and internal gains.
3.7 Weather conditions
Weather conditions greatly influence the thermal behavior of the building and are contained in the so called weather file. This file includes all the information about the site where the building is located: its altitude, latitude and longitude, the climatic classification according to ASHRAE standards, data hourly series related to temperature, humidity, wind speed, solar radiation, precipitation and other important climatic parameters. This file also contains the “Design days” data, which are necessary to properly size the HVAC system.
3.8 HVAC modeling
Table 5. Temperature set points [32]
|
|
Summer |
Winter |
|
Operating Room |
22-26 °C |
22-26 °C |
|
Preparation and Post Anaesthesia |
26 ± 1 °C |
24 ± 1 °C |
|
Reanimation and Intensive Care Unit |
24 ± 1 °C |
24 ± 1 °C |
|
TAC |
26 ± 1 °C |
24 ± 1 °C |
|
Radiology |
26 ± 1 °C |
24 ± 1 °C |
|
Dialysis |
28 ± 1 °C |
24 ± 1 °C |
|
Laboratory |
26 ± 1 °C |
20 ± 1 °C |
|
Dressing Rooms |
28 ± 1 °C |
22 ± 1 °C |
|
Patience Rooms |
26 ± 1 °C |
22 ± 1 °C |
|
Offices, Clinic, Class room |
26 ± 1 °C |
20 ± 1 °C |
|
Pharmacy |
26 ± 1 °C |
20 ± 1 °C |
|
Sterilization |
24 ± 1 °C |
20 ± 1 °C |
The modeling of the HVAC system has been carried out through the "Ideal Loads" option. With this option, an ideal unit is defined in order to supply an air stream at specified conditions. This unit ideally mixes air at the zone exhaust conditions with a specified amount of outdoor air and then adds or removes heat and moisture at 100% efficiency. The HVAC system is set up in order to respect desired conditions in terms of temperature (see Table 5) as well as air changes per hours (see Table 6).
Table 6. Minimum air changes per hour [31]
|
Operating Room |
15 [ach] |
|
Preparation and Post Anaesthesia |
6 [ach] |
|
Reanimation and Intensive Care Unit |
12 [ach] |
|
TAC |
10 [ach] |
|
Radiology |
6 [ach] |
|
Dialysis |
6 [ach] |
|
Laboratory |
6 [ach] |
|
Dressing Rooms |
2 [ach] |
|
Patience Rooms |
2 [ach] |
|
Offices, Clinic, Class room |
2 [ach] |
|
Corridors |
1 [ach] |
|
Pharmacy |
6 [ach] |
|
Sterilization |
10 [ach] |
4.1 Base case scenario
The present status of the building has been analysed first.
The analysis of the whole building is carried out in terms of annual energy consumptions considering the energy demand requested by the HVAC system in order to maintain internal comfort set-points and also the energy needed by the internal lighting system and by the electrical equipment plugged inside the zones.
4.2 Key Performance Indicators (KPIs) identification and benchmark values definition
Table 7. KPIs identification
|
Element level KPIs - Building structures |
|
Thermal transmittance of opaque structures, U-value (W/m2K) |
|
Thermal transmittance of transparent elements, U-value (W/m2K) |
|
Technical systems |
|
Lighting efficiency, η (-) |
|
Energy balance |
|
Mean global heat transfer coefficient, Utot (W/m2K) |
|
Annual energy need for heating for unit volume (kWh/m3y) |
|
Annual energy need for cooling for unit volume (kWh/m3y) |
|
Building energy use |
|
Actual usage power density, Lighting Energy Numeric Indicator, LENI (kWh/m2y) |
|
Energy cost |
|
Pay Back Period (PBP) (y) |
After the building characterization, a list of KPIs has been defined in order to assess the intervention areas that allow improving the building energy performance and select a set of technologies eligible for the retrofit interventions.
Key performance indicators related to the building envelope, the lighting system, the technical equipment and the total energy demand are defined. In Table 7 the KPIs considered in the retrofit analysis are summarized.
Each KPI has been analyzed and compared to a benchmark value (provided in the Italian legislation framework), in order to establish whether the intervention has produced meaningful effects or not.
4.3 Retrofitting cases
Different simulations have been carried out combining different retrofit interventions, defining the so called Intervention Packages (IPs). The results have been compared against the base case scenario (to calculate the energy savings), also using the Simple Pay Back Period (SPB) to evaluate the best retrofit solution also from the financial point of view.
The analyzed Intervention Packages (IPs) are:
5.1 Base case scenario results
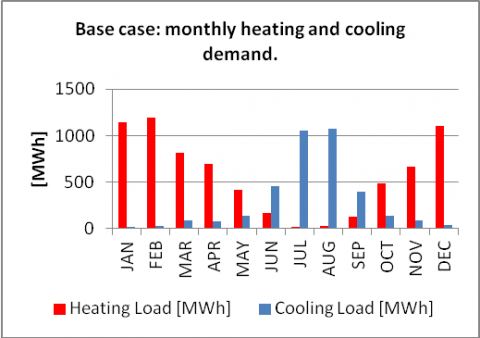
Table 8 summarizes the result aggregated on annual basis. Figure 3 reports the monthly break-down for heating and cooling loads. Cooling is necessary also during heating season because certain zones (i.e. operating rooms) with particular lights or electrical medical devices have significant internal gains.
In order to better analyze the results, the simulations provided also detailed values for every thermal zone, but for the sake of brevity, they are not included in this paper.
Table 8. Base case scenario annual total energy required
|
Cooling |
3554 [MWh/y] |
|
Heating |
6846 [MWh/y] |
|
Interior Lighting |
2723 [MWh/y] |
|
Interior Equipment |
5337 [MWh/y] |
5.2 Results for IP1: VIP facade, smart windows and LED system
Table 9. IP1 annual total required energy
|
Cooling |
2249 [MWh/y] |
|
Heating |
6761 [MWh/y] |
|
Interior Lighting |
598 [MWh/y] |
|
Interior Equipment |
5337 [MWh/y] |
Table 9 presents the annual values of energy required from the building in case of the retrofit intervention IP1.
From the results analisys it is possible to obtain the corresponding annual energy saving values with respect to the base case scenario:
- Heating [MWh/y]: 190
- Cooling [MWh/y]: 1329
- Interior Lighting [MWh/y]: 2125
It is evident that the major saving is provided by the LED system installation. Lighting high efficiency solutions (like the coupled LED+daylight system) allow to reduce the effective comsumption, and also the internal gains linked to lighting systems.
The cooling is also greatly reduced, while the heating load seems not to change. This could be related to the fact that the major interventions are adressed to the south façade, that is mainly sun exposed and thus influences more the cooling load.
Figure 3. Base case: monthly heating and cooling demand
5.3 Results for IP2: VIP facade and LED system
Table 10. IP2 annual total energy required
|
Cooling |
2247 [MWh/y] |
|
Heating |
7189 [MWh/y] |
|
Interior Lighting |
598 [MWh/y] |
|
Interior Equipment |
5337 [MWh/y] |
Table 10 presents the annual values of energy required from the building in case of the retrofit intervention IP2.
From the results analisys it is possible to obtain the corresponding annual energy saving values with respect to the base case scenario:
- Heating [MWh/y]: - 498
- Cooling [MWh/y]: 1117.5
- Interior Lighting [MWh/y] 2124
From the results, it is evident an increase in the heating demand (498 [MWh/y]); this result can be ascribed to the lack of the heat gain from the substitution of the fluorescent tubes that is not counterbalanced by the lower heat losses trough the opaque walls, that in turn constitute only some 50% of the overall facade surfaces. On the contrary, the presence of VIP material is beneficial during the summer, since it reduces the solar gain through the opaque walls.
5.4 Results for IP3: smart windows and LED system
Comparing these results with the ones relative to the base case scenario, it is possible to obtain these annual saving values:
- Heating [MWh/y]: 463
- Cooling [MWh/y]: 1111
- Interior Lighting [MWh/y]: 2405
The situation is very similar to that obtained with IP1 (all the retrofit technologies applyed), but the amount of energy saved is smaller.
Table 11. IP3 annual total energy required
|
Cooling |
2231 [MWh/y] |
|
Heating |
7369 [MWh/y] |
|
Interior Lighting |
598 [MWh/y] |
|
Interior Equipment |
5337 [MWh/y] |
5.5 Results for IP4: Smart windows and VIP façade
The energy saving with respect to the base case scenario are the following:
- Heating [MWh/y]: 930
- Cooling [MWh/y]: 1119
- Interior Lighting [MWh/y]: 0
There is no saving for the lighting since there is no intervention aimed to upgrade the existing system. The energy saving values are quite good, but the lack of LED illumination system is detrimental to the overall energy balance.
Table 12. IP4 annual total energy required
|
Cooling |
3491 [MWh/y] |
|
Heating |
5293 [MWh/y] |
|
Interior Lighting |
2723 [MWh/y] |
|
Interior Equipment |
5337 [MWh/y] |
5.6 KPIs evaluation and retrofit analysis
For all the four simulated Intervention Packages IPs, a comparison with both the base case results and the benchmark values has been carried out. In the Table 13 the KPIs values of each case are summarized.
Table 13. KPIs comparison for the base case, retrofitted models and benchmarks
|
KPIs |
Base case |
Retrofitted cases |
Benchmark values |
||||
|
IP1: F+W+L |
IP2: F+L |
IP3: W+L |
IP4: F+W |
||||
|
Building structures |
|||||||
|
Thermal transmittance of opaque structures [W/m2K] |
Façade 1 (North - East - West) |
1.71 |
0.1-0.5 |
0.1-0.5 |
1.71 |
0.1-0.5 |
0.36 |
|
Façade 2 (South) |
2.15 |
0.1-0.5 |
0.1-0.5 |
2.15 |
0.1-0.5 |
||
|
Thermal transmittance of glazed surfaces [W/m2K] |
Fenestration 3 simple glazing 4 [mm] |
5.8 |
1-2 |
5.8 |
1-2 |
1-2 |
2.1 |
|
Technical systems |
|||||||
|
Lighting efficiency |
- |
Class “A” (< 0.4) |
Class “A” (< 0.4) |
Class “A” (< 0.4) |
- |
< 0.50 |
|
|
Energy Balance |
|||||||
|
Mean global heat transfer coefficient Utot [W/m2K] |
2.74 |
1-2 |
1-2 |
2-3 |
1-2 |
0.68 |
|
|
Annual energy need for unit volume for heating [kWh/m3y] |
45.93 |
43-45 |
45-48 |
40-43 |
35-40 |
6.18 |
|
|
Annual energy need for unit volume for cooling [kWh/ m3y] |
23.84 |
13-15 |
15-17 |
22-24 |
15-17 |
- |
|
|
Building energy use |
|||||||
|
LENI [kWh/m2y] |
54.02 |
10-12 |
10-12 |
10-12 |
54.02 |
70.6 |
|
|
Energy cost |
|||||||
|
SBP [years] |
- |
14.5 |
10 |
9.3 |
27.4 |
- |
|
The present paper deals with a methodology to properly select and evaluate different energy retrofit interventions and it is applied to the case study of the Monoblocco Pavilion at the San Martino Hospital in Genova, Italy. The method employs dynamic simulations of the building in Energy Plus environment to evaluate the building heating and cooling loads and to predict the energy requests associated to different retrofit scenarios.
A brief overview on the performance of the four proposed intervention packages is provided:
- IP1: VIP facade, smart windows and LED system
The combination of the three retrofitting interventions brings the highest advantages in terms of cooling savings; the heating savings provided by the new windows and external façade are partially mitigated by the LED system installation because of the reduction in term of internal gains due to the substitution of the old fluorescent lamps.
Finally, the resulting Simple Pay Back Period (SBP) is relatively high (14.5 years).
- IP2: VIP facade and LED system.
This intervention scenario shows how the single contribution due to the retrofitted façade is not enough to compensate the effect due to the fluorescent lamp substitution, resulting in a higher heating demand during winter. Moreover, the energy needs for cooling still remains under the base case scenario value but higher than the IP1 case.
- IP3: smart windows and LED system.
This retrofit case shows the decisive contribution of the smart windows on the energy savings during heating season; despite the higher amount of heating needed due to fluorescent lamps substitution, the windows bring the heating load below the value of base case scenario. On the contrary, the windows installation does not affect in a decisive way the energy needs for cooling.
With respect to the economic aspect, the pay-back period indicates that the IP3 represents the best solution (9.3 years).
- IP4: smart windows and VIP facade.
This scenario is the best in terms of energy savings during the heating season and the second one with respect to the cooling one.
However, since the contribution in term of electricity savings provided by LED installation is missing, the SBP of the intervention is really too high (27.4 years).
Finally, with reference to the particular climate of Genova with high winter external temperatures and relevant solar energy contribution during the whole year, the substitution of the windows is the more suitable solution to apply from an energy saving point of view. Moreover, the substitution of the lighting system with an innovative one is crucial to reduce the electricity consumption and make economically reasonable the retrofit process.
|
U |
thermal transmittance, W. m-2. K-1 |
||
|
d |
wall layer material width, m |
||
|
Awall |
wall area, m2 |
||
|
$\dot{Q}$ |
heat transfer rate, W |
||
|
$\dot{Q}^{\prime}$ |
heat transfer rate per unit length, W. m-1 |
||
|
R |
thermal resistance, m2. K. W-1 |
||
|
ha |
convective/conductive air coefficient, W. m-2. K |
||
|
hr |
radiative air coefficient, W. m-2. K-1 |
||
|
T |
temperature, K or °C |
||
|
H’t |
mean global heat transfer coefficient, W. m-2. K-1 |
||
|
C |
thermal capacity, J. K-1 |
||
|
ṁ |
mass flow rate, kg. s-1 |
||
|
Greek symbols |
|||
|
λ |
thermal conductivity of the material, W. m-1 K-1 |
||
|
φ |
linear thermal transmittance of the thermal bridge, W. m-1. K-1 |
||
|
ρ |
density, kg/m3 |
||
|
τ |
time, s |
||
|
Subscripts |
|||
|
i |
i-th element |
||
|
tot |
total |
||
|
s |
surficial |
||
|
e |
external |
||
|
i |
internal |
||
|
air |
air |
||
|
z |
zone |
||
|
1D |
one-dimensional |
||
[1] Spyroupoulos G.N., Balaras C.A. (2011). Energy consumption and potential of energy savings in Hellenic office buildings used as bank branches: A case study, Energy and Buildings, Vol. 43, pp. 770-778.
[2] Griego D., Krarti M., Hernandez-Guerrero A. (2015). Energy efficiency optimization of new and existing office buildings in Guanajuato, Mexico, Sustainable Cities and Society, Vol. 17, pp. 132-140.
[3] Boyano A., Hernandez P., Wolf O. (2013). Energy demands and potential savings in European office buildings: Case studies based on EnergyPlus simulations, Energy and Buildings, Vol. 65, pp. 19-28.
[4] Penna P., Prada A., Cappelletti F., Gasparella A. (2015). multi-objectives optimization of energy efficiency measures in existing buildings, Energy and Buildings, Vol. 95, pp. 57-69.
[5] Aksoezen M., Daniel M., Hassler U., Khoeler N. (2015). Building age as an indicator for energy consumption, Energy and Buildings, Vol. 87, pp. 74-86.
[6] Wu Z., Xia X., Wang B. (2015). Improving building energy efficiency by multi-objective neighborhood field optimization, Energy and Buildings, Vol. 87, pp. 45-56.
[7] De Lieto Vollaro R., Guattari C., Evangelisti L., Battista G., Carnielo E., Gori P. (2015). Building energy performance analysis: A case study, Energy and Buildings, Vol. 87, pp. 87-94.
[8] Eneritz B., et al. (2013). Annex 1: Description of work, part B, Integration of technologies for energy-efficient solutions in the renovation of public buildings, Europe, p. 11.
[9] Buildings Energy Data Book (2010). U.S. Department of Energy - Office of Energy Efficiency and Renewable Energy, USA.