OPEN ACCESS
With the destruction of numerous coal seams around the world, coalfield fire is becoming a matter of global concern. This paper probes into the crack features of rock strata in a coalfield fire-stricken area, to answer to call for energy conservation and environmental protection. Specifically, the temperature variation was investigated through simulation experiments based on the coal seam model and rock strata model, and the crack development was qualitatively researched on the surface of coal seam and the overlying strata. The main conclusions are as follows. Comparing the temperature of measuring points on the same horizontal plane, it is concluded that the temperature of the coal seam above the heat source increased with the distance from the heat source within a certain range. The temperature diffusion was rather slow in coal and rock and the fire source movement was very time-consuming. The surface temperature variation of the overlying strata was similar to that of the fire source, indicating that the fire source could be roughly located by the surface temperature variation of the overlying strata. Meanwhile, the thermal destruction resulted from high temperature boosted the crack development in both coal seam and rock strata, and collapse occurred when the coal burned out. During the coalfield fire, the crack development was bolstered by the high temperature produced in the interaction between the crack field and the temperature field; besides, the cracks created a passage for oxygen supply, which favours the coal combustion. All in all, the coalfield fire development was enhanced by the interaction between the crack field and the temperature field.
coal seam, overlying strata, temperature variation, thermal destruction, crack development
Coal, one of the most popular fossil fuels [1], is prone to spontaneous combustion, owing to its own properties and the environmental influence. Coalfield fire is commonplace in major coal producers around the world, namely, China, the US, India, and Indonesia [2]. The disaster inflicts serious damages on resources, and induces numerous environmental problems. During coal combustion, large amounts of greenhouse gases, e.g. CO2 and CH4, are emitted, together with toxic gases like SO2 and NOx [1, 3, 4]. The combustion of coal may also result in surface subsidence [5]. As a result, scholars at home and aboard have made in-depth studies on coalfield fire, ranging from analysis of geological features, numerical simulation of fire, and positioning of the fire source.
Temperature is one of the key macro parameters during the evolution of coalfield fire. Wessling et al. [6] explained the effect of mechanical and energy transport processes on the occurrence of temperature anomalies on the surface, and employed in-situ temperature mapping and numerical simulation to investigate the situation of underground coal fire. Then, the temperature variation in a coal fire-stricken area was studied during the extinguishing process, and a quadratic polynomial mathematical model was proposed to depict the exact relationship between temperature and time [7]. In addition, temperature also has an impact on the development of cracks. The crack network, as a key determinant of gas migration, plays a crucial role in the evaluation of coalfield fire [8, 9]. It has been reported that the number, width and length of cracks increases with the temperature [10]. Elick et al. [11] examined the surface subsidence caused by coalfield fire and the development law of cracks under the high temperature of coal combustion. The thermos-physical parameters of coal and rocks, the main factors of heat transfer, are also related to temperature [12, 13]. The location of coalfield fire is another focal point in research. Several methods have been created to recognize coalfield fire, including geographic information systems (GIS), numerical simulation, and thermal infrared spectroscopy [14‒17]. All these methods have laid a solid basis for the prevention and control of coalfield fire. The geological information has also attracted much attention, thanks to its close correlation with the temperature variation and location of fire source [18].
The three-phase foam stands out of the various technologies as one of the most effective way to prevent and control coalfield fire. Cao et al. [19] developed a mobile fire prevention and extinguishing system based on the three-phase foam technique, and managed to put out a coalfield fire (burned area: 227,000m2) with the system in only 9 months. Another effective way to quell coalfield fire lies in the combination of composite fly ash gel injection, excavation, blasting and sealing. After subsurface blasting, the composite gel is injected into the coal seam to extinguish the fire and prevent reignition. The combined method can effectively put out coalfield fire at a reasonable cost [20]. To prevent coalfield fire from occurring in the first place, some scholars have delved into the features of spontaneous combustion of coal. The relevant studies have given birth to such experimental systems as temperature-programmed system [21, 22], thermal analysis system [23‒27], and large-scale coal spontaneous combustion system [28, 29].
In short, the previous studies have tackled the prevention and control techniques of coalfield fire and the spontaneous combustion of coal, but ignored the crack development of the coal in coalfield fire. In light of the gap of research and the severe hazards of coalfield fire, this paper establishes models for coal seam and rock strata, discusses the temperature variation by monitoring the temperature at different positions, and qualitatively analyses the surface crack development by collecting the image information during coal fire.
In this study, Huojitu mine area in Shenfu coalfield, Shaanxi province, China, was taken as the research object. Geographically, the mine is located in the north of the Loess Plateau and on the margin of the Ordos Desert. The ecological environment is poor, and the landform is mainly desert Aeolian. Gullies are well developed in the north of the mine area, creating loess ridges, hills and tablelands. To the east of the mine, area there is a flat desert covered by drifting and semi-fixed sand. Nevertheless, a serious disaster is lurking within the fairly simple geological structure. Due to the thick coal seam, shallow burial depth and the unique weather, the coal in the mining area often self-ignites, resulting in the wide distribution of coalfield fire. To investigate the crack development on the surface and the temperature variation in coal seam and rock strata, the author established a model for the coal seam and another for the rock strata.
2.1 Experimental devices
As shown in Figure 1, the devices mainly include heating rod (rated power: 1.5kW; working voltage: 220V; length: 30mm), temperature controller (range: 0–800oC), type k thermocouple (0–1,300oC), C-7018 module for data acquisition and AD conversion (rate: 10 times per second; precision: ±0.1%), and CCD camera (resolution: 5 million pixels). The heating rod stops working when the coal has been heated up to the self-ignition point. Then, the coal seam will combust continuously by itself.
Figure 1. Experimental devices
2.2 Simulation models
During the simulation of coalfield fire development, the two models were set up with simulation materials (Table 1) at a certain similarity ratio (Table 2). The coal seam was heated to the self-ignition point of coal by the heating rod. The thermocouples were arranged in the models to monitor the temperature, and the CCD camera was used to collect the image information of cracks on the surface. To eradicate the disturbance on surface crack development, no external force was applied in the experiments so that the load was solely from the dead weight of the model. The coal seam model and rock strata model are illustrated in Figures 2(a) and 2(b), respectively.
Table 1. Ratio of similar materials
|
Number |
Layer |
Sand/kg |
Gypsum/kg |
Calcium carbonate/kg |
Coal powder/kg |
|
1 |
Mudstone |
4.6206 |
0.1903 |
0.4464 |
|
|
2 |
Sandy mudstone |
4.5501 |
0.2137 |
0.5001 |
|
|
3 |
Fine sandstone |
4.5501 |
0.2854 |
0.4287 |
|
|
4 |
Siltstone |
4.5501 |
0.1433 |
0.5708 |
|
|
5 |
Coal seam |
/ |
0.2691 |
0.5732 |
6.056 |
Table 2. Similarity coefficient of similar materials
|
Project |
Bulk density |
Elastic modulus |
Compressive strength |
Poisson ratio |
|
Similarity coefficient |
5 |
125 |
125 |
1 |
Vertical view
Front view
Left view
(a) Coal seam model
Vertical view
Front view
Left view
(b) Coal-rockbody/volume/mass model
Figure 2. Similar models
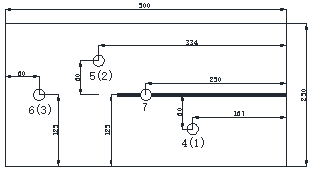
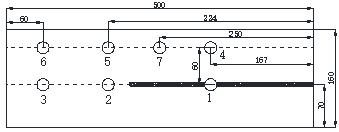
In the coal seam model, thermocouples were placed in two planes which were 70 and 130 mm from the bottom of the simulation material, respectively. The heating rod was arranged at the centre of the width, and spanned from the right end to the centre of the model. This means measuring points 1, 2 and 3 were located in the same plane. Points 1 and 2 were placed at 60mm from either side of the heating rod. The distance from the right edge of the simulation material was 167mm for point 1 and 334 for point 2. No. 3 measuring point was located in the centre of width and 60mm from the left edge. Points 4-7 were arranged on the plane 130mm from the bottom of the simulation material. Among them, points 4-6 were set up in the vertical projections of points 1-3, respectively, and point 7 was 350mm from the right edge of the simulation material in the same line with point 6.
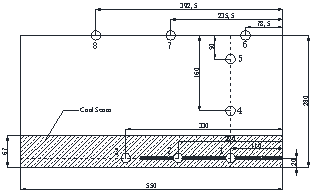
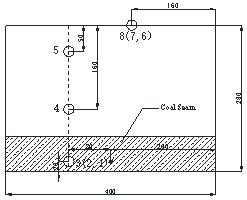
For better simulation, the rocks were also simulated by the materials. As shown in Figure 2(b), 8 points were selected to analyse the temperature variation in different directions. It should be noted that the actual number of measuring points exceeded that mentioned in the model. It is difficult to obtain valid data due to thermocouple damages in the experiment. In view of the symmetrical arrangement, 8 measuring points were selected to depict the temperature development. Specifically, points 1-3 were arranged in the coal seam, points 4-5 were arranged in the rock strata, and points 6-8 were arranged on the surface. Due to the difficulty in placing thermocouples, the temperatures of points 6-8 were collected by infrared detection. At 20mm from the bottom of the model, a heating road was arranged in the centre of the width and extended from the right end to the centre of the model. In this case, the horizontal plane of points 1-3, which were in the same line, was 80mm away from the heating rod. All the three points were 110m from the right edge of the model. The spacing between points 2 and 3 was also 100m. In the vertical direction, point 4 was 100mm above point 1, and point 5 was 110mm above point 4. Points 6-8 were in the same line. Point 6 was 78.5mm from the right end of the model and 40mm from the centre of width. The spacing between points 6 and 7 and points 7 and 8 were both 157mm.
3.1 Surface cracks
To study the development of surface cracks, a CCD camera was adopted to collect surface images of the coal seam and the rock strata. The qualitative law of surface crack development was obtained after analysing these images taken at different time (Figures 3 and 5).
3.1.1 Simulation model of rock strata
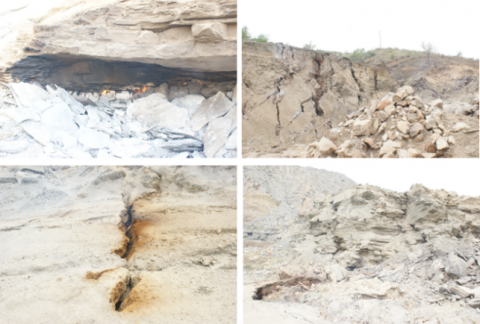
Figure 3. Variation of surface cracks on the overlying strata of coal-rock body
As the experiment progressed, the coal seam temperature increased continuously because of heating. At the moment of self-ignition, heavy smoke was produced from desorption of volatiles and incomplete combustion of coal. At 48h, the coal seam combusted and fire appeared at the outer end of the coal seam, marking the end of the operation of the heating rod. With further combustion of the coal seam, the thermal destruction resulted from high temperature intensified the crack development in the coal seam and rock strata, and the combustion of coal seam altered the stress and strain of the overlying strata. Both of the two trends contribute to the collapse of the overlying strata. As shown in Figure 3, the overlying strata began to collapse at 47h, and the coal seam gradually burned up in the collapse zone. The collapse was increasingly serious as the fire source moved forward continuously over time, and came to a halt at 120h. The second crack emerged at 144h with the third crack forming in its vicinity at 168h. The entire overlying strata almost completely collapsed at 200h. The simulation results are consistent with the actual situation, in which the surface often exhibits some cracks and even subsidence during the underground coalfield fire (Figure 4).
Figure 4. Coalfield fire in Huojitu mine area
During the combustion of coal, there should be a passage for oxygen supply because the spontaneous combustion of coal is essentially an exothermic reaction between coal and oxygen. Through the above analysis, it is learned that the cracking of coal seam and rock strata is promoted by the thermal destruction resulted from high temperature, and the oxygen supply passage is formed thanks to the collapse of the overlying strata under the change of stress and strain. These phenomena promote the combustion of coal seam and boost the development of coalfield fire.
3.1.2 Simulation model of coal seam
The surface cracking of the coal seam during combustion is illustrated in Figure 5. In total, 12 images were taken from 0.4h into the experiment to the completion of the experiment at 31h.
Figure 5. Variation of surface cracks for coal seam
The cracks developed over time as the coal seam was heated. As can be seen from Figure 5, an obvious crack emerged at the 1h mark, and gradually expanded in width and length thereafter. The emergence and expansion are the results of thermal destruction. The coal above the heat source began to combust and the heating rod was exposed to air at 7h. The improving communication with air intensified the combustion of the coal seam. At the moment of 31h, a small part of the coal seam on the surface burned up. The trend bears high resemblance to that in Figure 3. It can be inferred that the change of stress and strain is bound to occur due to coal combustion if the coal seam is located below the rock strata. When the change reaches the threshold, the overlying strata will inevitably collapse. This is verified by results shown in Figure 3. In a shallow outcropping coal seam, the combustion-induced cracks will optimize the condition of air supply, pushing the fire source deeper into the coal seam.
3.2 Temperature variation
The temperature was measured at different points by thermocouples. The time-varying patterns of the temperature are depicted in Figures 6-9. The peak temperature was selected to analyse the development of the fire source.
3.2.1 Simulation model of rock strata
(1) Horizontal temperature variation
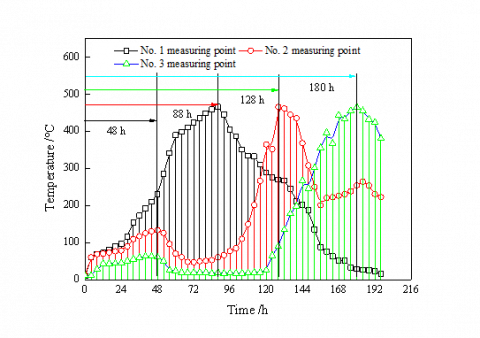
Figure 6. Temperature variation in horizontal direction for coal-rock body
The data collected at measuring points 1-3 were relied on to discuss the variation of temperature in the horizontal direction (Figure 6). The three points are ranked as 1>2>3 in descending order of temperature. The possible reasons are as follows. First, point 1 lies the closest to the heat source while point 3 lies the furthest away from the source; second, the heat transfer efficiency is negatively correlated with the distance between the source and the measuring point; third, the temperature rise of the coal slows down with the increase in the said distance, as the heat loss mainly occurs in the form of convection.
The temperature of point 1 increased first, peaked at 88h, and then decreased, while the temperature curves of points 2 and 3 both had two obvious peaks. The first peak appeared at 48h for both points 2 and 3; the second peak was observed at 128h for point 2 and 180h for point 3. During the experiment, the heating rod stopped working at 48h when the coal seam was kindled and fire appeared. As the closest point to the heat source, point 1 was continuously heated to the ignition point of coal, and eventually burned up. After the heating rod ceased to work, the temperatures at points 2 and 3 exhibited a decline trend, but increased again at 72h and 120h, respectively. The second growth occurs because a fire source moves toward the two points, heating up the coal in their surroundings. Additionally, the temperatures of points 2 and 3 maximized at 128h and 180h, respectively, before decreasing again. The temperature of point 2 slightly recovered at 160h owing to the high temperature at point 3. Judging by the temperature variation at the three points, the fire source development in the horizontal direction is rather complex. It takes about 40h for the fire source to move from point 1 to point 2, and 52h from point 2 to point 3.
(2) Surface temperature variation
Figure 7. Temperature variation on the overlying strata of coal-rock body
The temperatures measured at points 6, 7 and 8 at different time are presented in Figure 7. At the beginning of the experiment, the temperature difference of the three points was small and the temperature field was relatively uniform. With the passage of time, the temperatures all climbed up, but at different rates. The temperature difference significantly widened at 12h. After the temperatures reached the maximum at 48h, the temperature of point 6 remained constant for about 30h, while those of points 8 and 9 entered a decline. Compared to the data in Figure 6, the peak temperatures of points 6, 7 and 8 are closer to each other than those of points 1, 2 and 3.
In light of the above, it is reasonable to deduce that the surface temperature variation of the overlying strata might be attributed to the same reason as that of coal seam, that is, it is related to the termination of heating rod operation and the movement of the fire source. The deduction is evidenced by the collapse of the overlying strata at 72h because of the burnout of the coal seam. Moreover, whereas the temperature of point 6 decreased at the movement of the fire source, it is inferred that the oxidation and combustion of lower coal seam caused the temperature variation on the overlying strata, and that the variation pattern is similar to the movement law of fire source. Therefore, the location of fire source can be approximated based on the temperature variation on the overlying strata.
The temperature difference between coal seam and overlying strata was as high as over 400 °C. The huge gap is caused by the poor conductivity of both the coal seam and the rock strata [30]. Table 3 describes the thermal diffusivity and conductivity of simulation materials. If the maximum displacement is taken as the fire source movement, it takes 54h for the fire source to move from point 6 to point 7, and 52h from point 7 to point 8. As shown in Figure 7, the fire source movement from point 1 to point 2 and from point 2 to point 3 consume 40h and 52h, respectively. Despite a certain error caused by operation and the difference of the measuring points, the development law of the fire source is basically acceptable and consistent with the actual situation.
Table 3. Thermalphysical parameters of similar materials at 30 °C
|
Project |
Mudstone |
Sandy mudstone |
Fine sandstone |
Siltstone |
Coal |
|
Thermal diffusivity/mm2 s‒1 |
0.386 |
0.356 |
0.429 |
0.453 |
0.2724 |
|
Thermal conductivity/W m‒1 K‒1 |
1.1 |
1.134 |
1.242 |
1.32 |
0.198 |
|
Specific heat capacity/J g‒1 K ‒1 |
1.441 |
1.588 |
1.531 |
1.429 |
1.012 |
(3) Vertical temperature variation
Figure 8. Temperature variation on vertical direction for coal-rock body
According to the temperatures measured at the three measuring points in the vertical direction (Figure 8), the temperature decreased with the widening of the distance to the heat source, and the temperature attenuated faster from coal seam to rock strata was faster than that between rock strata. At the beginning of the simulation, the rock strata temperature increased with the coal seam temperature, and the temperatures at points 4 and 5 decreased after peaking at about 70h. A possible explanation of the phenomena goes as follows. With the high temperature produced in the combustion of the coal seam, the point closer to the heat source is easier to receive the heat transferred along the vertical direction; the heat transfer between rock strata is promoted by the higher thermal conductivity of the rock (Table 3).
The temperature decreases of points 4 and 5 at 70h may have something to do with the collapse of the rock strata, which occurred at 72h according to Figure 3. It can be observed that the collapse makes it difficult for the heat to accumulate. At 120h, the temperature curves of points 4 and 5 became gentle and flattened. Unlike Figures 6 and 7, the fire source almost moved to the next measuring point. Therefore, the temperatures of points 4 and 5 are closer to the ambient temperature and subject to little changes.
3.2.2. Simulation model of coal seam
Seven thermocouples were arranged at different locations of the simulation model. It can be seen from Figure 9 that the temperatures at these points varied in a similar manner and all tended to increase with the time. According to the distribution of measuring points and the measured results, the temperature increased more quickly and more significantly at points closer to the heat source. For example, the temperature at point 1, the closest point to the heat source in its plane, surpassed that of points 2 and 3. Similarly, points 7 and 4 had higher temperatures than points 5 and 6. The results are in good agreement with those in the preceding section. The close distance is conducive to heat transfer because of the weak conductivity of coal.
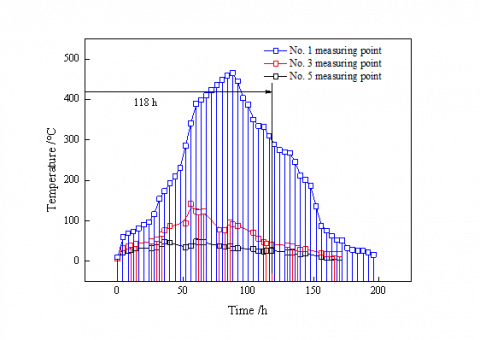
Figure 9. Variation of coal temperature corresponding to time for coal seam
In addition, the temperature was higher and increased more rapidly at the points above the heat source and on the horizontal plane of the heat source than the other points. One possible reason is that the air existed in the pores of coal and between the particles. As an uneven air density field and buoyancy were produced under the uneven distribution of temperature, the air heated by the heat source flew upward along cracks. Then, the coal above the heat source was heated by heat convection between the coal and the air, which bolstered the temperature increase. The temperature rises further exacerbated the exothermic oxidation reaction, which, in return, pushed up the temperature. Figure 5 describes that the surface cracks appear because of heating, which promotes the oxidation and combustion of coal on the surface. This might be another reason for the rapid increase of temperature in the coal above the heat source.
Figure 9 also manifests the difficulty in temperature diffusion in the coal seam [31]. The temperature at point 9 increased slowly although the spacing between points 6 and 7 was merely 190mm. The temperature difference stood at about 350 °C even when the experiment had lasted for about 34h. In actual situations, when the internal temperature of coal has reached a high level and even the self-ignition point, the external temperature might still be normal. This means the coal has a weak heat transfer ability. Therefore, it is critical to choose a rational position and a precise detector before locating the fire source by temperature measurement method.
4.1 Conclusions
In order to disclose the temperature distribution in coal seam and rock strata and the crack development on the surface, this paper establishes two simulation models for the coal seam and the rock strata, and carries out experiments by thermocouples, CCD camera and other devices. The conclusions are summarized as follows.
(1) The heat transfer is negatively correlated with the distance to the heat source, as evidenced by the higher temperature and faster heating rate at the points closer to the heat source. The two models revealed similar laws of temperature variation (Figures 6, 8 and 9). This is because the close distance is favourable to heat transfer and against the heat loss during the transfer. Meanwhile, the temperature distributions in the vertical direction revealed a similar trend (Figure 8). However, the attenuation of temperature between coal seam and the rock strata was faster than that in the rock strata, owing to the edge of rock over coal in diffusivity and thermal conductivity.
(2) Comparing the points on the same horizontal plane with the fire source, it is concluded that the temperature increased faster in the coal seam above the fire source. The trend reflects the temperature rise boosted by the thermal convection of gas, and the huge heat release from coal oxidation thanks to the communication with the air. It should be noted that, the temperature is not necessarily higher at a farther distance above the heat source. It is possible that the temperature will decline due to the poor conductivity of coal if the distance continues to expand.
(3) The temperature variation on the surface of overlying strata was similar to the movement law of the fire source (Figures 6 and 7), indicating that the fire source movement is a cause of the regular change of the surface temperature of the overlying strata. The fire source could be located roughly based on the temperature variation on the surface of the overlying strata. However, the detection devices and area must be accurate enough to offset the poor thermal conductivity of coal and rock.
(4) During the combustion of the coal seam, the thermal destruction resulted from high temperature intensified the crack development in the coal seam and rock strata; the crack development and burnout of coal seam altered the stress and strain of the overlying strata, and even caused the collapse of rock strata. In addition, the crack development offered a better passage of oxygen supply, which benefits the combustion of the coal seam. Therefore, the spread of coalfield fire is promoted by the interaction of crack field and temperature field.
4.2 Prospects
In the future research, the author will set up a more accurate and advanced experiment system, and tap into the topics of seepage field and chemical field. The purpose is to discover a more explicit multi-field coupling mechanism. What is more, the stress field corresponding to crack field will be studied in greater depth. To improve the feasibility of research findings, the experimental results will be compared with the actual situation of coalfield fire.
[1] Saini V., Gupta R.P., Arora M.K. (2016). Environmental impact studies in coalfields in India: A case study from Jharia coal-field, Renewable and Sustainable Energy Reviews, Vol. 53, pp. 1222-1239.
[2] Strachera G.B., Taylorb T.P. (2004). Coal fires burning out of control around the world: Thermodynamic recipe for environmental catastrophe, International Journal of Coal Geology, Vol. 59, pp. 7-17.
[3] Carras J.N., Day S.J., Saghafi A., Williams D.J. (2009). Greenhouse gas emissions from low-temperature oxidation and spontaneous combustion at open-cut coal mines in Australia, International Journal of Coal Geology, Vol. 78, pp. 161-168.
[4] Li W., Younger P.L., Cheng Y., Zhang B., Zhou H., Liu Q., Dai T., Kong S., Jin K., Yang Q. (2015). Addressing the CO2 emissions of the world's largest coal producer and consumer: Lessons from the Haishiwan Coalfield, China, Energy, Vol. 80, pp. 400-413.
[5] Ng A.H.M., Ge L., Yan Y., Li X., Chang H.C., Zhang K., Rizos C. (2010). Mapping accumulated mine subsidence using small stack of SAR differential interferograms in the Southern coalfield of New South Wales, Australia, Engineering Geology, Vol. 115, pp. 1-15.
[6] Wessling S., Kuenzer C., Kessels W., Wuttke M.W. (2008). Numerical modeling for analyzing thermal surface anomalies induced by underground coal fires, International Journal of Coal Geology, Vol. 74, pp. 175-184.
[7] Lu G., Zhou X., Jiang J. (2008). A mathematical model of the temperature in a coalfield fire area, Journal of China University of Mining & Technology, Vol. 18, pp. 358-361.
[8] Kuenzer C., Zhang J., Sun Y., Jia Y., Dech S. (2012). Coal fires revisited: the Wuda coal field in the aftermath of extensive coal fire research and accelerating extinguishing activities, International Journal of Coal Geology, Vol. 102, pp. 75-86.
[9] Paul S., Chatterjee R. (2011). Mapping of cleats and fractures as an indicator of in-situ stress orientation, Jharia coalfield, India, International Journal of Coal Geology, Vol. 88, pp. 113-122.
[10] Xiao Y., Lu J., Wang C., Deng J. (2016). Experimental study of high-temperature fracture propagation in anthracite and destruction of mudstone from coalfield using high-resolution microfocus X-ray computed tomography, Rock Mechanics and Rock Engineering.
[11] Elick J.M. (2013). The effect of abundant precipitation on coal fire subsidence and its implications in Centralia, PA, International Journal of Coal Geology, Vol. 105, pp. 110-119.
[12] Wen H., Lu J., Xiao Y., Deng J. (2015). Temperature dependence of thermal conductivity, diffusion and specific heat capacity for coal and rocks from coalfield, Thermochimica Acta, Vol. 619, pp. 41-47.
[13] Gosset D., Guillois O., Papoular R. (1996). Thermal diffusivity of compacted coal powders, Carbon, Vol. 34, pp. 369-373.
[14] Sutcu E.C. (2012). Use of GIS to discover potential coalfields in Yatagan–Milas area in Turkey, International Journal of Coal Geology, Vol. 98, pp. 95-109.
[15] Hu M., Pan D., Chen S., Dong S., Li J. (2013). Numerical simulation for recognition of coalfield fire areas by Rayleigh waves, International Journal of Mining Science and Technology, Vol. 23, pp. 27-31.
[16] Chatterjee R.S. (2006). Coal fire mapping from satellite thermal IR data – A case example in Jharia Coalfield, Jharkhand, India, ISPRS Journal of Photogrammetry & Remote Sensing, Vol. 60, pp. 113-128.
[17] Elick J.M. (2011). Mapping the coal fire at Centralia, Pa using thermal infrared imagery, International Journal of Coal Geology, Vol. 87, pp. 197-203.
[18] Jiang Y., Zhao L., Zhou G., Wang X., Zhao L., Wei J., Song H. (2015). Petrological, mineralogical, and geochemical compositions of early Jurassic coals in the Yining Coalfield, Xinjiang, China, International Journal of Coal Geology, Vol. 152, pp. 47-67.
[19] Cao K., Zhong X., Wang D., Shi G., Wang Y., Shao Z. (2012). Prevention and control of coalfield fire technology: A case study in the Antaibao Open Pit Mine goaf burning area, China, International Journal of Mining Science and Technology, Vol. 22, pp. 657-663.
[20] Deng J., Xiao Y., Lu J., Wen H., Jin Y. (2015). Application of composite fly ash gel to extinguish outcrop coal fires in China, Natural Hazards, Vol. 79, pp. 881-898.
[21] Kozowsk M., Pietrzak R., Wachowska H., Yperman J. (2004). Study of sulphur in oxidized coals by atmospheric pressure-temperature programmed reduction, Journal of Thermal Analysis and Calorimetry, Vol. 75, pp. 125-134.
[22] Zhong X., Wang D., Yin X. (2010). Test method of critical temperature of coal spontaneous combustion based on the temperature programmed experiment, Journal of China Coal Society, Vol. 35, pp. 128-131.
[23] Avid B., Purevsuren B., Born M., Dugarjav J., Davaajav Y., Tuvshinjargal A. (2002). Pyrolysis and TG analysis of Shivee Ovoo. Coal from Mongolia, Journal of Thermal Analysis and Calorimetry, Vol. 68, pp. 877-885.
[24] Ohrbach K.H., Klusmeier W., Kettrup A. (1984). TG-DTA-MS Investigations of coal, and characterization of the volatile products released as a function of temperature, Journal of Thermal Analysis, Vol. 29, pp. 147-152.
[25] Liu J., He D., Xu L., Yang H., Wang Q. (1999). Study of the kinetics of the combustion reaction on Shuangya Mountain coal dust by TG, Journal of Thermal Analysis and Calorimetry, Vol. 58, pp. 447-453.
[26] Slovák V., Taraba B. (2010). Effect of experimental conditions on parameters derived from TG-DSC measurements of low-temperature oxidation of coal, Journal of Thermal Analysis and Calorimetry, Vol. 101, pp. 641-646.
[27] Kaljuvee T., Keelman M., Trikkel A., Petkova V. (2013). TG-FTIR/MS analysis of thermal and kinetic characteristics of some coal samples, Therm Anal Calorim, Vol. 113, No. 1063-1071.
[28] Mao Z., Zhu H., Zhao X., Sun J., Wang Q. (2013). Experimental study on characteristic parameters of coal spontaneous combustion, Procedia Engineering, Vol. 62, pp. 1081-1086.
[29] Deng J., Xiao Y., Li Q., Lu J., Wen H. (2015). Experimental studies of spontaneous combustion and anaerobic cooling of coal, Fuel, Vol. 157, pp. 261-269.