OPEN ACCESS
The greenhouse design as well as the cover material properties in particular may strongly impact the greenhouse energy. To study the effect of these parameters, three typical unheated greenhouses equipped with rows of canopy were considered. Experiments were launched to establish the boundary conditions and validate the model. Two parametric studies were carried out: for the nocturnal period when the energy performance of each type of greenhouse was investigated, and for the diurnal period, when the sun path was simulated taking into account the type of the cover, its spectral optical and thermal properties. Results indicate that for the nocturnal period, the ambient air temperature in the tunnel and vertical wall greenhouse was relatively homogenous and warmer compared with the temperature distribution in the Venlo greenhouse. The plastic greenhouse, especially the tunnel one had better performances concerning the homogenization of the climate and the thermal energy storage. Concerning the diurnal period, and for both plastic greenhouses equipped with fully opened side vents, the air located between the rows of canopy and ground surfaces remained very slow, not exceeding 0.2 ms-1; for the Venlo glasshouse, the recirculation loop situated above the crop improved the air mixing and induced a good homogenization. Results indicate that the cover material with highest absorptivity, deteriorated the natural ventilation, increasing the air temperature by convection, and reduced the available Photosynthetically Active Radiation.
greenhouse design, thermal analysis, CFD simulation, radiation, coupled model
A greenhouse is an enclosed structure, that protects the crops from the outside environment by creating favorable conditions, which traps the short wavelength solar radiation and stores the long wavelength thermal radiation to create a favorable microclimate for higher productivity, together with certain limitations that will depend on the bioclimatic stage conditions of its location, the geometry of the structure, and the spectral optical properties of covering materials in particular.
Managing the greenhouse microclimate is essential to maintain an optimum inside environment during the different stages of plant growth. Modeling is an interesting approach to assess the microclimate in greenhouses, and test different scenarios. Among the modeling tools, CFD (Computational Fluid Dynamics) is an advanced technique for design in engineering. It has been increasingly used in different types of agricultural studies, such as livestock houses, greenhouses and broiler houses. CFD offers many advantages to the food industry as it provides a mean to test the influence of multiple variables with low economic cost (compared with experiments). Nowadays the CFD technique is recognized as a powerful tool to model the climate generated inside greenhouses and to test the performances of different structural designs.
Since the pioneering work of Nara [1], CFD simulation has been increasingly used to study assess distributed indoor climate for a wide range of greenhouse shapes, especially in the north Latitude. Several review papers present the state of the art concerning CFD developments. Reicharth [2] presented the main conclusions derived from the published material together with their latest results on greenhouse modeling. Norton [3] provided a state-of-the-art review of CFD and its applications in the design of ventilation systems for agricultural production systems. They concluded that the greenhouse CFD modeling was a higher standard than that of animal housing, owing to the incorporation of the crop biological responses as a function of the local environmental conditions. The main factors governing air movements inside the greenhouse were analyzed by [4], with a particular focus on conclusions drawn from field experiments, laboratory scale models and CFD simulations. The principles of CFD, the modeling approach and its adaptation to greenhouse climate simulation were described, paying attention to ventilation efficiency inside greenhouses with respect to the greenhouse geometry, opening arrangements, wind speed and direction, addition of insect-proof or shading screens, and interactions with the crop. More recently Bartzanas [5] presented a review on various CFD applications to improve crop farming systems such as, soil tillage, sprayers, harvesting, machinery, and greenhouses, they discussed the possibilities of incorporating the CFD models in decision support tools for precision farming.
Specific processes involved in greenhouses were also analyzed into details in the literature. These processes include ventilation, interaction with the crop and radiative effects. The effect of vent arrangements on the ventilation and energy transfer in a multi-span glasshouse was studied by [6], using a bi-band radiation model. The analysis of the humidity issues in greenhouse climate using the CFD tools at different scales: the leaf, the canopy and the greenhouse itself was also conducted by Bournet [7]. The effect of the crop is particularly important for greenhouses, as side openings may be partly obstructed by the crop rows. Hernandez [8] studied the effects of crop row orientation (perpendicular or parallel to the wall equipped with side openings) on the ventilation and microclimate of a plastic multi span greenhouse. More recently, based on a computational fluid dynamics (CFD) model and an experimental approach, Majdoubi [9] analyzed the effect of crop row orientation on internal climate in a large type greenhouse, and found the ventilation rate to be heavily dependent on the orientation of the crop rows with respect to the dominant wind direction. The relationship between ventilation and the characteristics of a tomato crop growing inside was systematically studied by [10] in a naturally ventilated tunnel greenhouse using the tracer gas method. It appears however that most early studies ignored or failed to consider the presence of the crop, and did not provide detailed information about the way solar and atmospheric radiations were taken into account.
In recent years, the use of Computational Fluid Dynamics made it possible to analyze the factors that determine greenhouse microclimate with respect to its structural specifications and used equipment [11, 12]. However, in those studies, radiation was not simulated directly through a radiative transfer equation but its effect was indirectly incorporated either through specific boundary conditions or through the addition of an extra source term in the energy transport equation. More recently, Kim [13] included the short wave length radiation in their simulations (diurnal conditions) while Bournet [6] implemented a bi-band radiation model distinguishing short and long wave length contributions to take account of the diverse optical properties of the glass within these different bands. Moreover, few studies have addressed the question of the dynamics of solar radiation and temperature distribution as [14] did it for a tunnel greenhouse at a daily time scale. More recently [15] presented numerical simulations of the climatic parameter distribution of a ventilated tunnel greenhouse on the basis of a 3D CFD approach using a bi-band discrete ordinates (DO) model, and calculating the sensible and latent heat transfers between leaves and the surrounding air by including the long wave and shortwave radiation fluxes in each crop control volume taking account of the sun position at each time step.
In the southern Mediterranean basin, the bioclimatic stage is semi-arid and the use of greenhouses for crop production is rapidly increasing. However, the characterization of the energy balance of the greenhouses for this bioclimatic zone still remains to be done and achieving favorable environment becomes essential in order to warranty the greenhouse feasibility [16,17]. Indeed, maintaining ventilation performance during the diurnal period and controlling the heat release during the nocturnal period are the major factors influencing both climate control and yield quality over much of the year. These aspects are major challenges still facing designers and growers. Nevertheless, few investigations of the performance of greenhouses in southern Mediterranean climates have been undertaken so far and the involved physical mechanisms remain poorly understood. Some progress was made in recent years since the energy balance and the behavior of the indoor microclimate has long become a matter of concern in the studies conducted by [18, 19, 20, 21].
Performance criteria based on very different approaches are difficult to compare and a common approach based clearly on the same bioclimatic stage is required so that greenhouses performance can be simulated and examined with respect to their engineering design (both greenhouse geometry and covering material). Under arid climate conditions, few CFD works that predict and analyze the microclimate of greenhouses exist [22]. In the present study we will present a numerical analysis of the thermal environment of greenhouses in Batna (6˚11' East, 35˚33' North). The region is localized at altitudes of 900-1000 m above sea level and characterized by high winter insulation, varying from 10.5 to 14 hours/day between October and March, and by cold and dry winters, with average minimal temperatures between -5 ˚C and 2 ˚C during the night periods of January to March, with low levels of moisture. The aim of the present study is to examine the influence of greenhouse configuration on the inside microclimate and energy consumption for three different unheated greenhouses (tunnel, Venlo and plastic vertical wall greenhouse) during two periods (diurnal and nocturnal) focusing in particular on the ventilation mechanism, the thermal behavior and the heat losses. In this prospect a CFD model was used, and experiments were launched to establish the boundary conditions and validate the model.
2.1 Experimental greenhouses
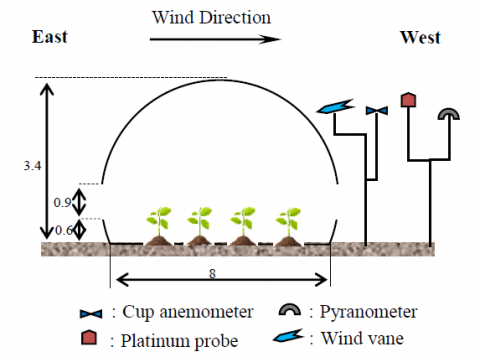
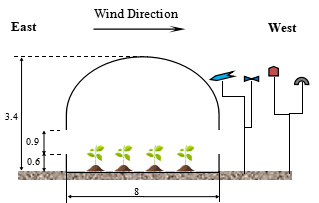
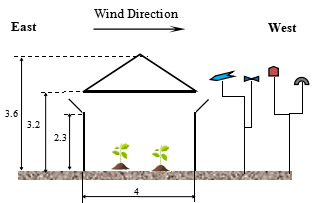
In order to estimate the ability of the model to correctly simulate the thermal characteristics of the microclimate of the tested greenhouses, production greenhouses were equipped with sensors to provide input data for the model, and for its validation. The measurements were carried out in three experimental N-S oriented greenhouses (tunnel, Venlo and plastic vertical wall greenhouse) located at the agricultural research farm of the department of agronomy of the University of Batna1 (35.330 N., 6.110 E.) in the north area of Eastern Algeria. The geometrical characteristics of the greenhouses were as follows: for the tunnel and the plastic vertical wall greenhouses eaves height of 2.4m, ridge height of 3.4m, total width of 4 m, and total length of 8m (Figure 1), for the Venlo glasshouse, the greenhouse was a standard 4 m width, 3.60 m high under the ridge and 3.27 m high under the gutter (Figure 1, Figure 2). The glasshouse was covered with a 4 mm thick horticultural glass and equipped with two opposite roof openings; the tunnel and plastic vertical wall greenhouses were covered with a polyethylene sheet and were equipped with two continuous side openings (roll-up type) located at 0.6m from the ground and with a maximum opening of 0.9m. The greenhouses were grown with a tomato crop, which reached a height of 1m during the experiments.
(a) Plastic tunnel greenhouse with roll-up type openings
(b) Plastic vertical wall greenhouse with roll-up type openings
(c) Venlo glass greenhouse with pivoting roof door type openings
Figure 1. Geometries of the greenhouses and configurations considered for the ventilation efficiency study
2.2 Measurements
Two different types of measurements were conducted: (a) outside the greenhouse to determine the characteristics of the atmospheric boundary layer in order to provide the boundary conditions to the model, (b) inside the greenhouse to validate the simulations.
(a) Measurements of the weather conditions surrounding the greenhouse were conducted with sensors installed outside on a mast, 10 m away to the East of the greenhouse (Figure 1). External wind speed and direction were monitored by two cup anemometers (Model 100075, accuracy ±0.1m.s-1, Climatronic Corporation) and a wind vane (Model 100076, accuracy±2°, Climatronic Corporation). The outside global solar radiation was measured with a pyranometer (SP lite, Kipp & Zonen, Netherlands). The outside air temperature and humidity were also measured using platinum probes in statically ventilated shelters (Model MP601A, accuracy± 0.2%, Rotronic instrument crop) located at the same height as the outside pyranometer. All the above mentioned measurements were recorded every 2s and then averaged over 30min periods, using a data logger system (Campbell Scientific Micro logger, CR3000, USA).
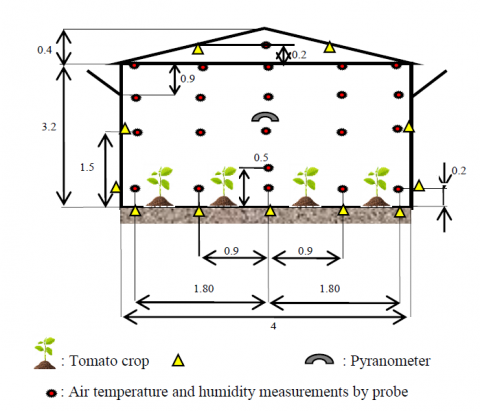
(b) Measurements of the temperature and the humidity distribution in the middle section of the greenhouse were also conducted. The measurement locations were distributed along a cross-section at the center of each greenhouse in the same vertical plane. The temperature and relative humidity of the interior air were recorded by means of a data logger (OAKTON Logger Plus) using a remote sensing system. The temperatures of the solid surfaces (ground, underground and wall surfaces of the cover) were measured every 2 second with thermocouples, and then averaged over 30 min periods. The incoming solar radiation was measured with a pyranometer (SP lite, Kipp & Zonen, Netherlands) placed inside the greenhouse at the center and 1.5m above the ground. The cover surface temperatures of the greenhouse were measured at six positions distributed along the greenhouse sides and roof using stick on thermocouples secured to the cover with transparent adhesive tape. The storage and the processing of data were carried out with the Micro Lab plus Software. Figure 2 shows the sketch of the Venlo type experimental greenhouse and the location of the sensors. The beach of Measurements and the accuracy of all the sensors used are specified in Table A in Appendix
Figure 2. Sketch of the experimental Venlo greenhouse showing the location of the sensors (All the distances are in linear meter)
2.3 Numerical model
The commercially available CFD code Fluent v.6.1 was used for this study. A 2-D grid was built for each case, and the model was run in order to compare the numerical results with the experimental data. Although 2D simulations do not represent precisely the reality inside the greenhouse, it could be a computationally beneficial assumption for the investigation of the transport phenomena especially at the middle section of a long structure with open side vents along the whole length. In addition, 2D modeling also makes it possible to save significant computing time for model simulation development, meshing and convergence process.
2.3.1 Grid definition and numerical procedure
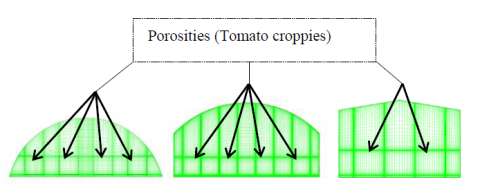
The calculation domain was restricted to the greenhouse itself, in the middle plan of the greenhouses ensuring fast calculation. The grid was selected after several attempts in order to reduce the CPU time needed for convergence and to ensure the independency of the numerical results from the grid. The grid was an unstructured, quadrilateral mesh with a higher density in critical portions of the flow subject to strong gradients. After several trials with different densities, the calculations were based on a 70 by 90 cell grid (Figure 3). The area of calculation includes the canopy, the soil, and the inner walls of the greenhouses. Different regions with adapted meshes were considered and no mesh was applied to the outer space surrounding the greenhouse. The inner space was meshed using an unstructured grid with sizes varying from 0.2m in the center of the greenhouse to 0.06 m near the greenhouse cover. The crop rows, considered as a porous medium, were meshed using a structured, cubic, 0.18 m grid and the soil mesh under the greenhouse consisted of three layers (0.01 m, 0.15 m and 1.44 m) with 0.005 m, 0.03 m and 0.2 m structured meshes.
Figure 3. Geometry of the whole calculation domain and greenhouse mesh details
2.3.2 Governing equations
The CFD method allows the explicit calculation of the average velocity vector field of a flow by numerically solving the corresponding transport equations. The two-dimensional conservation equations describing the transport phenomena for steady flows are of the general form:
$\frac{\partial(U \phi)}{\partial x}+\frac{\partial(V \phi)}{\partial y}=\Gamma_{\phi} \nabla^{2} \phi+S_{\phi}$ (1)
In equation (1), ϕ represents the concentration of the transported quantity in a dimensionless form, namely the momentum (velocity components) and the mass and energy. U, and V and are the components of velocity vector; $\Gamma_{\phi}$ is the diffusion coefficient; and Sϕ is the source term. The governing equations were discretized following the procedure described by Patankar [23] using the finite volume technique which consists in integrating the governing equations over a control volume. The Boussinesq model was activated to take account of the buoyancy effects in the computational domain. The standard k-ε model assuming isotropic turbulence was adopted to describe turbulent transport as it proved to be a good compromise for a realistic description of turbulence and computational efficiency as reported by several studies of greenhouse microclimate. This model is a semi-empirical model based on additional transport equations for the turbulent kinetic energy (k) and its dissipation rate (ε). The complete set of the equations of the k-ε model can be found in [24] and their commonly used set of parameters (empirically determined) are: Cμ= 0.09, Cε1 = 1.44, Cε2 = 1.96, σκ=1, and σε = 1.3 (Fluent, 1998).
Radiative sub model (RTE Radiative Transfer Equation). The discrete ordinates method has received significant attention due to its good compromise between accuracy, computational economy and flexibility [25, 26]. Up until now however, most CFD studies did not include both the interchange of short and long wavelength radiation between the sky and the greenhouse cladding and only indirectly introduce the effect of radiative transfers in the model. In order to simulate the effect of solar incident radiation on the greenhouse cover, the discrete ordinate DO model was used. In this model it was assumed that radiation energy was ‘convected’ simultaneously in all directions through the medium at its own speed. The DO model available in Fluent makes it possible to solve the Radiative Transfer Equation (RTE) in semi-transparent media. It can be used to assess non-gray radiation using a gray-band model. So it is adequate for participating media with a spectral absorption coefficient αλ that varies in a stepwise fashion across the spectral bands. The discrete ordinates radiation model solves the RTE for a finite number of discrete solid angles, each associated with a vector direction $\vec{s}$ in the global Cartesian system (x, y, z). It transforms the RTE equation into a transport equation for the luminance in the spatial coordinates (x, y, z). The DO model solves as many transport equations as there are $\vec{s}$ directions. The RTE for spectral intensity $I_{\lambda}(\vec{r}, \vec{s})$ is written as:
$\frac{d I_{\lambda}(\vec{r}, \vec{s})}{d s}+\left(\alpha_{\lambda}+\sigma_{s}\right) I_{\lambda}(\vec{r}, \vec{s})=\alpha_{\lambda} \frac{\sigma T^{4}}{\pi}+$ $\frac{\sigma_{s}}{4 \pi} \int_{0}^{4 \pi} I_{\lambda}(\vec{r}, \vec{s}) . \Phi\left(\vec{s}, \vec{s}^{\prime}\right) d \Omega$ (2)
where in Eq. (2) Iλ is the radiation intensity for wavelength λ (W.m-2.sr-1), $\vec{r}$ the position vector, $\vec{s}$ the radiation direction vector, αλ the spectral absorption coefficient (m-1), λ the wavelength (m-1), σ the Stefan-Boltzmann constant (σ=5.672x10⁻⁸ W.m-2.K-4), σs the scattering coefficient (m-1), Φ the phase function, and Ω the solid angle. We assumed the refraction index, the scattering coefficient and phase function to be independent of the wavelength. The angular space 4π at any spatial location was discretized into Nθ x Nφ solid angles of extent ωi, called control angles. The angles θ and φ are the polar and azimuthal angles, and are measured with respect to the global Cartesian system (x, y, z). In our case a 3x3 pixilation was used. Although in this equation the refraction index is considered to be constant, in the calculation of black body emission as well as in the calculation of boundary conditions imposed by semi-transparent walls the band length depended values of refractive index were used (provided in Table 1 and Table 2). The RTE equation was integrated over each wavelength. Then the total intensity $I(\vec{r}, \vec{s})$ in each direction and position $\vec{r}$ , $\vec{s}$ was computed using equation (3):
$I(\vec{r}, \vec{s})=\sum_{x} I_{\lambda_{x}}(\vec{r}, \vec{s}) \Delta \lambda_{x}$ (3)
Where, the summation is undertaken over the wavelength bands. The RTE equation is coupled with the energy equation through a volumetric source term given by the following equation (4) [27]:
$S_{r}=-\frac{\partial q_{r}}{\partial x_{i}}=\alpha_{\lambda}\left[4 \pi I_{\lambda}^{0}(\vec{r})-\int_{0}^{4 \pi} I_{\lambda}^{0}(\vec{r}, \vec{s}) d \Omega\right]$ (4)
With Sr is the radiation source term (J), qr the radiative flux (W), xi the component in i- direction (m), and $I_{\lambda}^{0}$ is the black body intensity given by the Planck function (W.m-2).
Table 1. Optical properties of the cover for the three greenhouse geometries
|
Cover type & Thickness (mm) |
Glass (hortical glass) |
Polyethylene film (low density) |
|
|
4 |
0.1 |
||
|
Absorptivity (α) |
UV |
0.05 |
0.37 |
|
PAR |
0.1 |
0.09 |
|
|
NIR |
0.2 |
0.05 |
|
|
Refractive index (n) |
UV |
1.65 |
1.72 |
|
PAR |
1.65 |
1.79 |
|
|
NIR |
1.72 |
1.79 |
|
Table 2. Mean values of the thermal and optical properties of the greenhouse components
|
Material |
Polyethylene film |
Glass |
Ground |
Canopy |
|
Density (kg.m-3) |
923 |
840 |
1300 |
700 |
|
Heat transfer conductivity (W.m-1.K-1) |
0.38 |
0.76 |
1.00 |
0.17 |
|
Specific heat capacity (J.kg-1.K-1) |
2300 |
2700 |
800 |
2310 |
|
Absorptivity α |
table 1 |
table 1 |
0.95 |
0.46 |
|
Refractive index n |
table 1 |
table 1 |
1.92 |
2.77 |
Crop sub model. The crop was simulated using the equivalent porous medium approach through the addition of a momentum source term, due to the drag effect of the crop, to the standard fluid flow equations [28]. The plants were simulated as porous materials with a viscous resistance a-1 = 27380m-2 and inertial resistance C2=1.534m-1. These parameters used in the pressure drop expression for a tomato crop were derived from [29] for a low velocity range. For the purpose of the study, sensible and latent heat transfers were omitted and attention was rather paid on the mechanical interaction of the crop with its environment.
2.3.3 Boundary conditions
Boundary conditions for each variable ϕ (transport variable) must be specified for each boundary surface of the domain. In particular, ϕ values for the upper boundary and the leeward lateral boundaries were determined with the assumption of a null gradient of ϕ. For the other boundaries, ϕ was determined either directly from experimental data bases or deduced from specific models. The left opening was supposed to face the East and the wind direction: the wind was normal to the ridge and a parabolic wind profile was imposed at the opening of the greenhouse with a given velocity profile and temperature 300 K, which is considered to be the temperature of the ambient air around the greenhouse. This profile was determined from the measurements of the wind speed at each ventilation opening of the greenhouse. Figure 4 illustrates the corresponding imposed profile fitted by a parabolic law. At the inlet section, a fully developed turbulent profile was also considered. At the outlet section (leeward right opening), a constant pressure (P=Patm) was imposed. Finally, the boundary conditions prescribed a wall type boundary condition along the floor and wall and the cover was considered as a finite thickness wall consisting of semi-transparent materials.
Figure 4. Wind profile imposed at the opening of the plastic greenhouses
The optical and thermal properties of the components of greenhouses are provided in Table 1 [30] and Table 2 [16]. A heat flux boundary condition was applied at the external boundary of the cover region. It is a mixed heat flux boundary condition (combination of radiation and convection with convective heat transfer coefficient). The corresponding convective coefficient depends on the wind speed, according to the law established by [16] on the same type of greenhouse and under similar climatic conditions h=2.56+2.3U0.69, where U is the mean wind speed along the roof of the greenhouse. Also, the same boundary condition was imposed along the internal wall surface where the solid and the fluid zones are coupled, restoring a conjugated heat transfer treatment at the specific area. The convective coefficient between the interior air and the interior wall depends on the temperature gradient (interior air - interior wall) according to the following law [16] h=3.59ΔT0.33. Fixed air temperatures were imposed along the ground. The side walls were considered as adiabatic and opaque while the ground was considered as a diffusively radiating opaque material.
2.3.4 Numerical procedure
A second-order upwind discretization scheme was used for momentum and turbulence transport equation. The convergence criterion for all variables was 10-6.
2.4 Parametric studies
Two parametric studies were carried out: diurnal and nocturnal conditions, in order to investigate the effect of greenhouse geometry, as well as the effect of two different cover materials with different optical characteristics, on the thermal behavior, heat losses, and temperature patterns of the tested greenhouses. For the first parametric study, i.e. the diurnal period, a typical day of the spring season in the region of Batna was chosen for simulation sand calculations were launched at a time corresponding to midday. The incident irradiance (the earth solar radiation) was distributed in three wavelength bands: the ultra-violet (λ=0.01 - 0.4 μm), the visible or PAR (λ=0.4 - 0.76μm) and the near infrared (λ=0.76 - 1.1 μm). In Table 1, the normal irradiances per wavelength band are presented. In all cases a fraction of 24% diffuse radiation was considered. For the second parametric study, i.e. the nocturnal period, the same day was considered, but at midnight, and two cover materials with different optical properties were studied. The corresponding spectral optical properties are provided in Table 1 and Table 2.
The measurements were carried out on a, sunny springs days (march 10th to April 1st 2015) at solar noon for the first parametric study, and at midnight for the second parametric study. The required parameters were measured, every 1min, at the locations shown in Figure 1, averaged at every 15 min and recorded in a data logger (CR3000 Micro logger, Campbell Scientific, Inc.). These Measurements were conducted over two periods, from March to April 2015inside the tunnel, Venlo and plastic vertical wall greenhouses. During the same period, climatic data was also recorded outside the greenhouses. Sets of data were used not only to define the boundary conditions of the model, but also to validate the simulations. For the purpose of the study, two contrasted cases were analyzed: (a) diurnal period, (b) nocturnal period. The transport phenomena inside the experimental naturally ventilated greenhouses were investigated using the mean values of the outside climate conditions for specifying the boundary conditions Table 3.
Table 3. Mean values of the outside climate conditions during the measurements
|
Min & Max Outside air Temperature (K) |
279-297.3 |
|
Min & Max Outside air Temperature (K) |
277-313 |
|
Outside air Humidity (%) |
52.08 |
|
Outside air velocity (m.s-1) |
1.3 |
|
Global solar radiation (W.m-2) |
610.8 |
|
UV (W.m-2) |
33 |
|
PAR (W.m-2) |
310 |
|
NIR (W.m-2) |
267.8 |
|
Hour angle degree (˚) |
0 |
3.1 Validation of the model
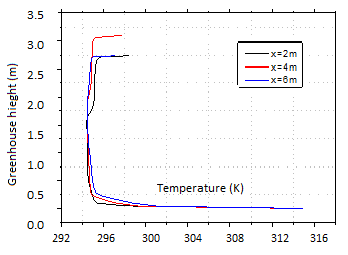
In order to check on the validity of the performance of the CFD model, the validation of the present work was undertaken on the basis on experimental field surveys conducted in the Venlo geometry greenhouse covered with horticultural glass. Figure 5 shows the air temperature profiles for this glasshouse along the middle axis of the greenhouse at 2m from the inlet flow vent opening both for the diurnal period Figure 5a, and for the nocturnal period Figure 5b.
(a) Diurnal period
(b) Nocturnal period
Figure 5. Computed and experimental vertical profiles of the temperature (K) at the middle of the Venlo Glasshouse,
(a) Diurnal period, (b) Nocturnal period
For the diurnal case, a good agreement between the measured and simulated profiles was reached, a correlation coefficient of R2 = 0.9669 and a mean square error of χ = 2.2481K are denoted and the standard deviation of the temperature (±1°C) may be ascribed to the experimental errors and to the models used for the determination of the temperature. Figure 5a shows that temperature distribution along the vertical axis disclosed two distinct areas, one at the bottom of the domain, where the temperature remained relatively high due to the energy exchange with plants, and a second on eat the top half domain where the temperature was clearly affected by the fresher temperature of the entering stream. A difference of about 5K was observed and simulated between these two areas. Concerning the nocturnal period, Figure 5b shows the vertical distribution of the measured temperatures and the numerical air temperatures again at 2m from the sides of the greenhouse. In this case also a good agreement was reached between the numerical and the experimental values. While a correlation coefficient of R2 = 0.9440 and a mean square error of χ = 0.1036 are denoted. When observing Figure 5b, we denote globally a good correlation between predicted and measured air temperature. Contrary to the diurnal case, the air temperature profile was relatively homogeneous except in areas close to the ground and roof where high temperature gradients were reported. These gradients were mainly induced by heat exchanges along the ground and roof.
3.1.1 Diurnal period
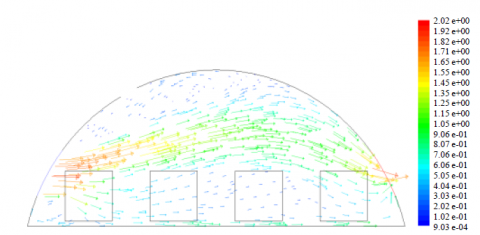
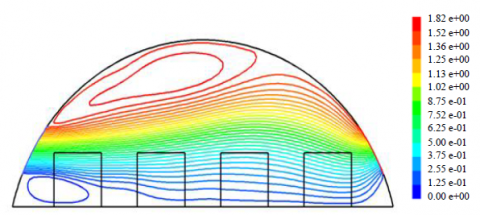
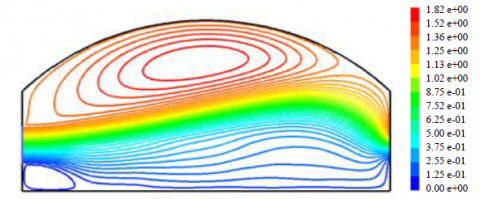
Flow field. CFD results concerning the first parametric study: i.e. the diurnal period for a clear day of the spring season are shown in Figures 6-10 for all considered geometries. The computed contours of the air velocities, stream function, air temperature, and PAR radiation profiles at specific sections are provided. From the results, it comes out that the main mechanism governing heat transfers is convection associated with the entering air stream except in areas close to the cover and in the corners of the greenhouse where incident solar radiation and heat storage mainly impact the temperature. As shown in Fig 6a, Fig.6b and Fig. 6c the computed contours of the air velocities for all cases showed that the flow was dominated by a strong convective airflow through the windward opening. The internal flow had the same direction as the wind direction and was damped by plants (porosity). Due to the obstacle created by the crop, the flow separated into two unequal streams. Results thus indicate that the wind direction clearly influenced the air velocity inside the greenhouse and hence its ventilation rates.
(a) Tunnel plastic greenhouse
(b) Straight wall plastic greenhouse
(c) Venlo glasshouse
Figure 6. Computed contours of the air velocity (ms-1) at the middle of the greenhouses
Modifying the optical properties of the covering material impacted the amount of solar energy entering the greenhouse, causing variability in the flow pattern for each type of greenhouse and for each studied cover material described in Table 2. Two recirculation loops appeared above and below the inlet, trapping small amounts of fluid. The optical properties of the cover determined not only the size but even the existence of the upper corner recirculation for the plastic greenhouses (tunnel and straight wall greenhouse) as can be seen in Fig. 8a and Fig. 8b. In these greenhouses, the main stream flew above the plants and the smallest one inside the crop with lower speed. The differences of the streamlines contours between both plastic greenhouses are restricted to the upper domain close to the inlet. Thus the dependence of the upper corner recirculation on the cover material and on the greenhouse geometry is clear and its size was probably determined by the combination of both effects (the tunnel one was smaller than the vertical wall greenhouse one). This recirculation plays a significant role in the total flow pattern and temperature distribution inside the greenhouse since it divides the domain into two distinguished areas. The recirculation formed at the bottom corner near the entrance seemed however to be independent of radiation. The air situated between the rows of canopy was hardly affected by the main entering stream, with velocities in this region not exceeding 0.2 ms-1. The flow decelerated as a consequence of the viscous and inertial resistances. Above the height of the ventilator (i.e. at 1.6 m), the air velocities progressively reduced. The computed contours of the air velocities obtained for these cases were characterized by a weak air current near the ground, and a recirculation loop with slower speed near the roof and flowing counter current with respect to the outside wind. This recirculation loop improved the air mixing but most of the air left the greenhouse volume without a good homogenization.
Contrary to the plastic greenhouses, for the Venlo greenhouse, no air recirculation close to the roof was predicted but a large loop was simulated at the bottom, trapping large amounts of fluid. The existence of this recirculation was mainly governed by the geometry and the vent location effects. In addition, the air flow near the roof was mainly driven by the convective flow through the vent, reaching maximum values within the range [1.4; 1.7 ms-1].
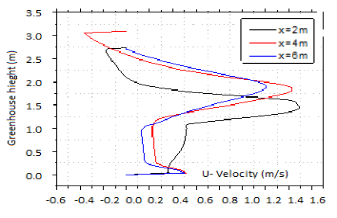
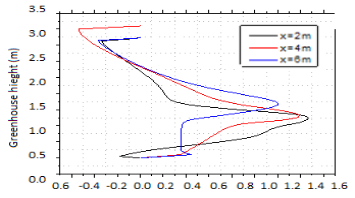
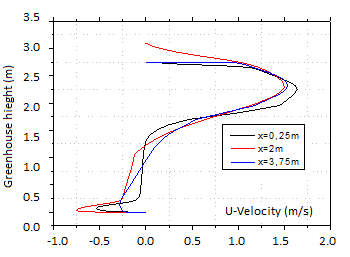
Fig.7a, Fig.7b and Fig.7c provide the horizontal u-velocity profiles at different locations inside the greenhouses at a distance of 2m, 4m and 6m respectively from the inlet for the plastic greenhouses and at 0.25m, 2m, and 3m for the Venlo glasshouse (the Venlo greenhouse is relatively small compared with the plastic ones). Close to the ground the velocity profiles were similar for all cases and characterized by low velocities caused by the resistance of tomato plants combined with shear along the floor. Large peak appeared over the plants where the flow accelerated. The peak position moved up according to the distance from the inlet, while its magnitude decreased, following the spreading of the jet as it mixed with the ambient air. For the plastic greenhouses (Fig. 7a and Fig.7b), close to the roof, negative values of u-velocity were predicted, corresponding to area backflow. A difference in the profiles was observed for the straight wall greenhouse in the upper part of the domain close to the vent height: the mean negative air velocity in this region had values within the range [-0.6; -0.1] ms-1 for the straight wall greenhouse, and within the range [-0.4; -0.01] ms-1 for the tunnel greenhouse), showing the dependence of the flow (especially in terms of velocity magnitude) on the greenhouse design.
(a) Tunnel plastic greenhouse
(b) Straight wall plastic greenhouse
(c) Venlo glasshouse
Figure 7. Computed profiles of air velocity (ms-1) at the middle of the greenhouses for three positions x=2m, 4m, 6m from the inlet for cases (a) and (b) and x=0.25m, 2m, 3.75m for case (c)
(a) Tunnel plastic greenhouse
(b) Straight wall plastic greenhouse
(c) Venlo glasshouse
Figure 8. Computed contours of stream function (m2s-1) at the middle of the greenhouses
Temperature distribution. Fig. 9a, Fig. 9b and Fig. 9c show the air temperature distributions for the three types of greenhouse design (for the two studied covering materials) under diurnal conditions. Not surprisingly, the temperature distribution followed the air velocity distribution. In the area just above the crop, the air temperature was similar to that of the outside air (295-298K) due to the strong air movement in this region. The temperatures in the center of the greenhouse were relatively homogeneous above the crop rows, while they strongly vary in the vicinity of the walls. Lower temperatures were predicted close to the main stream of air (coming from the outside), while higher temperatures were simulated near the ground and roof.
(a) Tunnel plastic greenhouse
(b) Straight wall plastic greenhouse
(c) Venlo glasshouse
Figure 9. Computed contours of air temperature (K) at the middle of the greenhouses
For the plastic greenhouses, the main temperature gradients were predicted in the upper corner near the inlet, since in this region the total heat transfer was stronger. The rest of the domain presented similar patterns for the examined case. For the vertical wall greenhouse covered with a material characterized by a high absorptivity (plastic cover), the roof temperature reached a relatively high equilibrium temperature, causing heating by convection of the nearby air. The temperature of the back flow air trapped in this recirculation zone increased as this dead zone favored the accumulation of heat provided by the incoming transmitted radiation. The same behavior was also depicted in Fig.10a and Fig.10b showing the temperature profiles at predefined positions.
(a) Tunnel plastic greenhouse
(b) Straight wall plastic greenhouse
(c) Venlo glasshouse
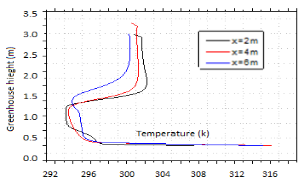
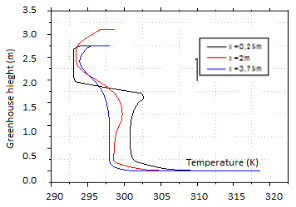
Figure 10. The computed profiles of air temperature (K) at the middle of the greenhouses for three positions x=2m, 4m, 6m from the inlet for cases (a) and (b) and x=0.25m, 2m, 3.75m for case (c)
Fig.9c and Fig.10c present the air temperature contours and temperature profiles for the Venlo glasshouse. Two distinct areas can be observed: one at the bottom of domain, where the temperature distribution was mainly governed by the energy exchange with plants and soil. In this region, the temperature was mostly affected by the reduced air velocity and the recirculation. The second area is located at the top of the greenhouse where the temperature was mainly affected by the flow ventilation. In this area the temperature was close to the temperature of the entering stream. A core flow appeared at the center where the temperature of the air remains droughty homogenous. The recirculation region in the canopy zone was fully developed on contrary to the two other designs, resulting in a temperature rise.
(a) Tunnel plastic greenhouse
(b) Straight wall plastic greenhouse
(c) Venlo glasshouse
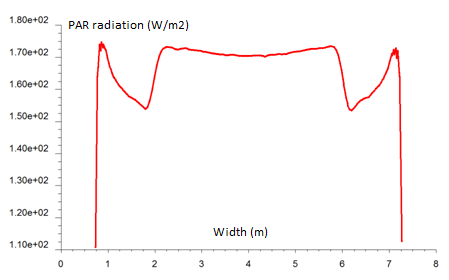
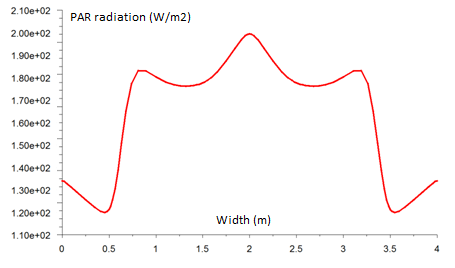
Figure 11. Computed PAR (Wm-2) profiles along the greenhouse width at a level of 1.5m from greenhouse ground
Radiation distribution. In Fig.11a and Fig.11b and Fig.11c the PAR radiation profiles at 1.5 m from the ground are presented for the three studied greenhouses, with the two different covering materials (thin plastic film and horticultural glass). The impact of covering materials in terms of PAR penetrating into the interior greenhouse was of course directly linked to the material transmittance. From the figures, two groups of greenhouses which present roughly similar behaviors may be distinguished: the tunnel and straight wall greenhouses with thin plastic film (Fig.11a and Fig.11b) on the one hand, and the Venlo glass greenhouse with Fig. 8c on the other hand. For the plastic greenhouses the low value of the transmittance only allowed a small amount of PAR to enter the greenhouse and the PAR distribution inside the greenhouse almost disclosed a uniform distribution over the plants. Both plastic greenhouses had analogous performance as they absorbed significant amount of incident solar PAR. In both cases, the maximum PAR intensity reached roughly the same value, proving the good functional performance of the tunnel design of the greenhouse roof, compared with the straight wall greenhouse design for which a lower percentage of the incoming PAR radiation reached the crop. Conversely, the Venlo greenhouse was covered with glass with a higher transmittance and therefore made it possible higher amounts of PAR to penetrate inside the shelter (meaning a higher PAR reached the crop).
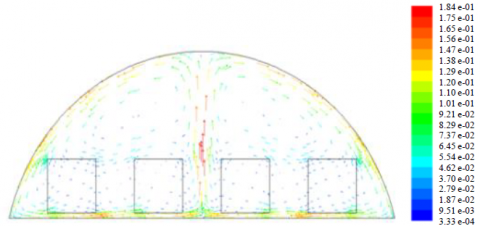
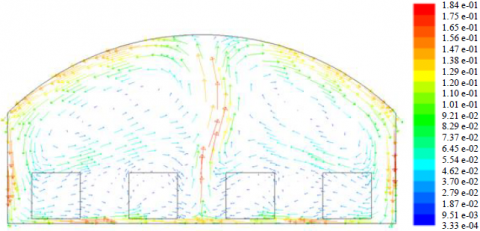
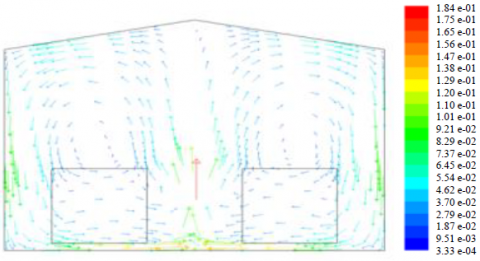
3.1.2 Nocturnal period
(a) Tunnel plastic greenhouse
(b) Straight wall plastic greenhouse
(c) Venlo glasshouse
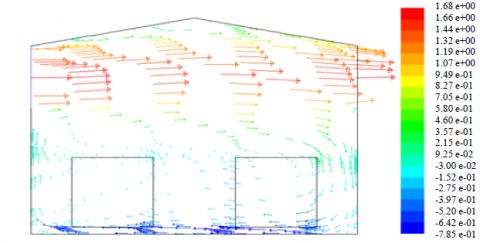
Figure 12. Computed contours of air velocity (ms-1) at the middle of the greenhouses
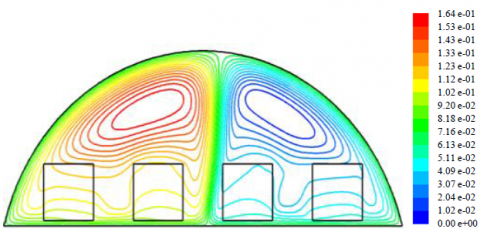
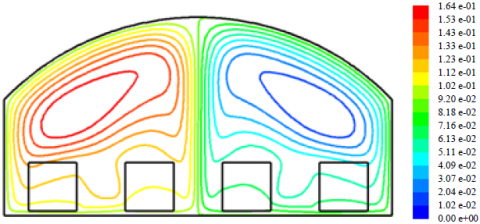
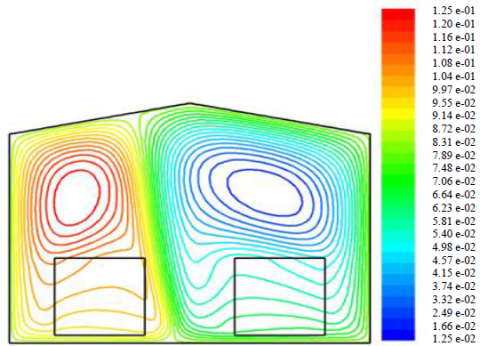
Flow field. During the night, the greenhouses were closed, unheated and deprived of any heating system. Under such conditions, the movement of the interior air was characterized by two counter-rotative convective loops guided by the greenhouse walls and following a circular trajectory along the internal surface of the walls and the roof. The ascendance of the air in the center of the greenhouse in that case was mainly driven by the convection induced by the heat stored inside the ground during daytime (Fig.12a, Fig.12b and Fig.12c) and released at night. Low values of air velocities were predicted in the vicinity of the canopy rows (0.03 - 0.01 ms-1). Velocity collapsed inside the crop as a consequence of the viscous and inertial resistances. It reached maximum values (0.19 - 0.15 ms-1) near the soil under the canopy where the temperature gradients enhanced buoyancy forces and air movements. The highest velocities were also predicted along the vertical medium axis (ascendant stream movement) and near the walls (descendant stream movement) for each of tested geometry.
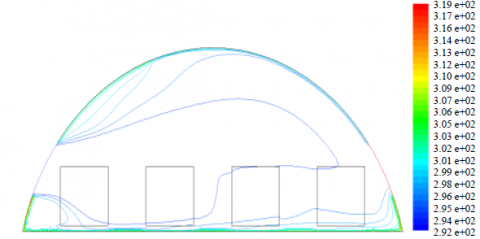
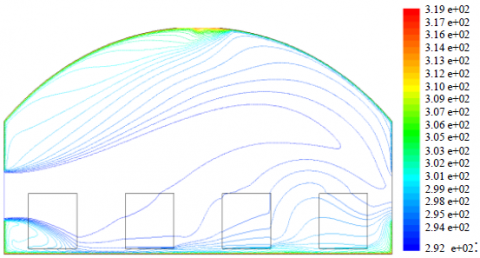
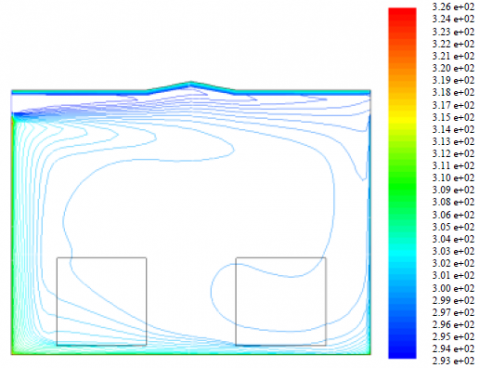
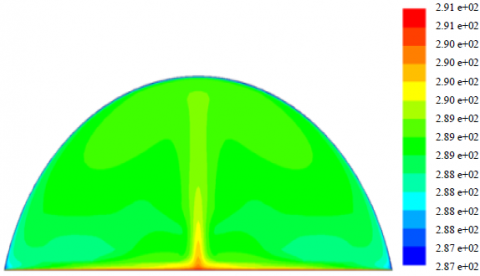
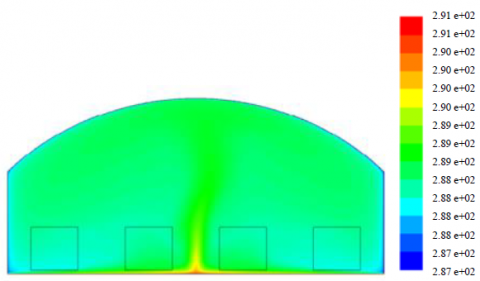
Temperature variation. Fig.13a, Fig.13b and Fig.13c show the air temperature distributions for the three greenhouse designs. For all cases, the predicted air temperature inside the greenhouse reached the max values near the ground and in the ascending streams at the center of greenhouses (290-288 K). The lowest values were obtained near the walls (287-285 K). Simulations also reveal that for the plastic greenhouses (and especially for the tunnel greenhouse), the ambient air temperature distribution was relatively homogenous and higher compared with the temperature distribution inside the Venlo greenhouse. The average air temperature inside the tunnel greenhouse was 290 K (standard deviation ±0.45), it was 288 K (±0.5) in the vertical wall greenhouse and 287 K (±1.32) in the Venlo glasshouse. The tunnel greenhouse geometry disclosed the best air mixing during this period (at night), probably caused and facilitated by the curvature of the roof of the greenhouse. Air temperature was almost uniformly distributed in the Venlo and vertical wall greenhouses but it was 2 K less than the interior tunnel air temperature.
(a) Tunnel plastic greenhouse
(b) Straight wall plastic greenhouse
(c) Venlo glasshouse
Figure 13. Computed contours of air temperature (K) at the middle of the greenhouses
(a) Tunnel plastic greenhouse
(b) Straight wall plastic greenhouse
(c) Venlo glasshouse
Figure 14. Computed contours of stream function (m2s-1) at the middle of the greenhouses
Assessing the micro climate in greenhouses is of prime interest as climate is one of the main factors impacting plant growth and development. Indeed the climate governs two important physiological mechanisms of the plants, namely transpiration and photosynthesis. It is highly dependent on greenhouse geometry, thermo-physical and optical properties of the covering material, and on the outside weather conditions. In the present study, the influence of greenhouse design and configuration on greenhouse microclimate and energy consumption for unheated greenhouses under semi-arid climate was numerically investigated using a commercially available CFD code. A field survey was undertaken in order to establish the boundary conditions and validate the model. Three different greenhouse designs with two different covering materials (plastic and glass) were investigated during two periods (night and daytime) resulting in different airflow and temperature patterns.
Results indicate that for the first parametric study, namely during daytime, in greenhouses with the cover material with the highest absorptivity (i.e. the plastic film). High absorptivity reduced the available Photosynthetically Active Radiation (PAR) but it distributed it equally inside the greenhouse. It was also concluded that for the same greenhouses equipped with fully opened side vents, the air located between the rows of canopy, and near the roof, remained very slow, not exceeding 0.2 m s-1. For the Venlo greenhouse, the recirculation loop situated above the crop improved the air mixing and appeared to induce a good homogenization compared with the plastic greenhouse geometry. The flow recirculation, showed the importance of internal temperature gradients, although forced convection which resulted from natural ventilation was dominant. Consequently the Venlo greenhouse had the best performance in terms of ventilation, particularly in the area covered by the crop (0.4-0.6 ms-1) compared with the plastic greenhouse for which air velocities less than 0.3 ms-1 were predicted. The Venlo greenhouse also maintained a relatively low difference of temperature with the outside air (6-7 K) compared with the plastic greenhouse (8-10 K). In the Venlo glasshouse, the canopy located in the middle of the greenhouse also received higher amounts of PAR compared with plants located in the vicinity of the walls. Such heterogeneity in the PAR distribution may lead to an important variability in the crop activity, thus impacting the crop growth and development.
Concerning the nocturnal case, the ambient air temperature in the tunnel and vertical wall greenhouse was relatively homogenous and higher compared with the temperature distribution in the Venlo glasshouse. The air temperature at the center of the tunnel greenhouse was 290 K, while it was 288 K and 287 K in the vertical wall and Venlo glasshouse respectively. It can be concluded that for the nocturnal period, the plastic greenhouse, especially the tunnel one had better performances concerning the climate homogenization and the thermal energy storage.
This study paves the way for future investigations on the impact of greenhouse design and choice of the covering material on greenhouse climate in semi-arid areas It also stresses the need to properly include thermal transfers as well as radiative transfers in the modeling approach in order to accurately predict canopy radiation absorption, photosynthesis and transpiration in the next developments of the numerical tool.
|
Iλ |
Spectral radiation intensity, Wm-2.sr-1 |
|
$I_{\lambda}^{0}$ |
Black body intensity given by the Planck function, W.m-2 |
|
P |
pressure, Pa |
|
Pr |
Prandtl number [Dimensionless] |
|
qr Re |
Radiative flux, W Reynolds number [Dimensionless] |
|
S |
Surface, m2 |
|
R2 |
Correlation coefficient [Dimensionless] |
|
Sr |
Radiation source term, J |
|
Sϕ |
Dimensionless source term |
|
T |
Temperature, K |
|
U |
Axial component of velocity vector, ms-1 |
|
V |
Radial component of velocity vector, ms-1 |
|
xi |
Space component in i- direction, m |
|
H |
Convectif heat transfer coeficient, Wm-2k-1 |
|
Greek Symbols |
|
|
aλ |
Spectral absorption coefficient, m-1 |
|
$\Gamma_{\phi}$ |
Dimensionless diffusion coefficient |
|
Θ |
Polar angle, rd |
|
Λ |
Wavelength, m |
|
Ρ |
Density, kg.m-3 |
|
Σ |
Stefan-Boltzmann constant, σ =5.672 10-8 W.m-2K-4 |
|
σs |
Scattering coefficient, m-1 |
|
Φ |
Azimuthal angle, rd |
|
ϕ
|
Dimensionless concentration of the transported quantity |
|
Φ |
Phase function [Dimensionless] |
|
Ω |
Solid angle, sr |
|
Χ |
Mean square error |
|
Subscripts |
|
|
λ |
depends on wavelength |
|
φ |
transported quantity like: U, V, T, C, k, ϵ |
[1] Nara M. (1979). Studies on air distribution in farm buildings, two dimensional numerical analysis and experiment, Journal of the Society of Agricultural Structures of Japan, Vol. 9, No. 2, pp. 18-25. Available: https://www.jstage.jst.go.jp/article/sasj1971/9/2/9_2_1/pdf
[2] Reichrath S., Davies T.W. (2002). Using CFD to model the internal climate of greenhouses: past, present and future, Agronomie, Vol. 22, No. 1, pp. 3-19. DOI: 10.1051/agro:2001006
[3] Norton T., Sun D.W., Grant J., Fallon R., Dodd V. (2007). Applications of computational fluid dynamics (CFD) in the modeling and design of ventilation systems in the agricultural industry: a review, Bioresource Technology, Vol. 98, No. 12, pp. 2386-2414. DOI: 10.1016/j.biortech.2006.11.025
[4] Bournet P.E., Boulard T. (2010). Effect of ventilator configuration on the distributed climate of greenhouses: a review of experimental and CFD studies, Comput Electron Agr, Vol. 74, No. 2, pp. 195-217. DOI: 10.1016/j.compag.2010.08.007
[5] Bartzanas T., Kacira M., Zhu H., Karmakar S., Tamimi E., Katsoulas N., Lee T.B., Kittas C. (2013). Computational fluid dynamics applications to improve crop production systems, Computers and Electronics in Agriculture, Vol. 93, pp. 151-167. DOI: 10.1016/j.compag.2012.05.012
[6] Bournet P.E., Khaoua S.A.O., Boulard T. (2007). Numerical prediction of theeffect of vent arrangements on the ventilation and energy transfer in multi-spanglasshouse using a bi-band radiation model, Biosystems Engineering, Vol. 98, No. 2, pp. 224-234. DOI: 10.1016/j.biosystemseng.2007.06.007
[7] Bournet P.E. (2014). Assessing greenhouse climate using CFD: a focus on air humidity issues, Acta Hort, Vol. 1037, pp. 971-985. DOI: 10.17660/ActaHortic.2014.1037.129
[8] Hernandez J., Fernandez-Tapia J.M., Hita O., Soriano T., Morales M.I., Castilla N., Escobar I. (2006). Effect of crop row orientation on the passive ventilation of a plastic greenhouse, Acta Hortic, Vol. 719, pp. 205-210. DOI: 10.17660/ActaHortic.2006.719.21
[9] Majdoubi H. (2007). Contribution à la modélisation d’une serre: couplage des transferts aérauliques et radiatifs dans une serre de tomate de grande surface dotée de filet anti-insectes, thesis, Univ. IBN ZOHR, Agadir, Morocco.
[10] Fatnassi H., Leyronasb C., Boulard T., Bardinb M., Nicotb P. (2009). Dependence of greenhouse tunnel ventilation on wind direction and crop height, Biosys Engineering, Vol. 103, No. 3, pp. 338-343. DOI: 10.1016/j.biosystemseng.2009.03.005
[11] Fatnassi H., Boulard T., Poncet C., Chave M. (2006). Optimisation of greenhouse insect screening with computational fluid dynamics, Biosys Engineering, Vol. 93, No. 3, pp. 301-312. DOI: 10.1016/j.biosystemseng.2005.11.014
[12] Khaoua S.A.O., Bournet P.E., Migeon C., Chassériaux G., Boulard T. (2006). Analysis of greenhouse ventilation efficiency with CFD, Biosys Engineering, Vol. 95, No. 1, pp. 83-98. DOI: 10.1016/j.biosystemseng.2006.05.004
[13] Kim K., Yoon J.Y., Kwon H.J., Han J.H., Son J.E., Nam S.W., Giacomelli G.A., Lee I.B. (2008). 3-D CFD analysis of relative humidity distribution in greenhouse with a fog cooling system and refrigerative dehumidifiers, Biosys Engineering, Vol. 100, No. 2, pp. 245-255. DOI: 10.1016/j.biosystemseng.2008.03.006
[14] Fidaros D.K., Baxevanou C.A., Bartzanas T., Kittas C. (2010). Numerical simulation ofthermal behavior of a ventilated arc greenhouse during a solar day, Renewable Energy, Vol. 35, No. 7, pp. 1380-1386. DOI: 10.1016/j.renene.2009.11.013
[15] Nebbali R., Roy J.C., Boulard T. (2012). Dynamic simulation of the distributed radiative and convective climate within a cropped greenhouse, Renewable Energy, Vol. 43, pp. 111-129. DOI: 10.1016/j.renene.2011.12.003
[16] Mesmoudi K., Soudani A., Zitouni B., Bournet P.E., Serir L. (2010). Experimental study of the energy balance of an unheated greenhouse under hot and arid climates:Study for the night period of winter season, Journal of the Association of ArabUniversities for Basic and Applied Sciences, Vol. 9, No. 1, pp. 27-37. DOI: 10.1016/j.jaubas.2010.12.007
[17] Mesmoudi K., Soudani A., Bournet P.E. (2010). The determination of the inside air temperature of a greenhouse with tomato crop, under hot and arid climates, J. App. Sc.in Env. Sanit., Vol. 5, No. 2, pp. 114-127. HAL Id: hal-00729706
[18] Mesmoudi K., Bougoul S., Bournet P.E. (2012). Thermal performance of an unheated greenhouse under semi-arid conditions during the night, Acta Hort, Vol. 952, pp. 417-424. DOI: 10.17660/ActaHortic.2012.952.52
[19] Serir L., Bournet P.E., Benmoussa H., Mesmoudi K. (2012). Thermal simulation of a greenhouse under a semi-arid climate, Acta Hort, Vol. 927, pp. 635-642. DOI: 10.17660/ActaHortic.2012.927.78
[20] Mesmoudi K., Bournet P.E., Zitouni B., Outtas T. (2013). Numerical simulation of the airflow and temperature distribution in a closed venlo greenhouse under hot and arid climate, Acta Hort, Vol. 1008, pp. 235-240. DOI: 10.17660/ActaHortic.2013.1008.31
[21] Mesmoudi K., Soudani A., Bougoul S., Bournet P.E. (2012). On the determination of the convective heat transfer coefficient at the greenhouse cover under semi arid climatic conditions, Acta Hort, Vol. 927, pp. 619-626. DOI: 10.17660/ActaHortic.2012.927.76
[22] Mesmoudi K., Bournet P.E. (2014). Assessing the daily evolution of the climate inside a greenhouse under semi-arid conditions using field surveys and CFD modeling, Acta Hort, Vol. 1037, pp. 1049-1054. DOI: 10.17660/ActaHortic.2014.1037.138
[23] Patankar S.V. (1980). Calculation of the flow field, in Numerical Heat Transfer and Fluid Flow, 1st ed. New York, McGaw Hill, USA, ch. 6, sec. 7, pp. 126-129.
[24] Mohammadi B., Pironneau O. (1994). Analysis of the k-epsilon turbulence model, Research in Applied Mathematics, 1st ed., Paris, Wiley-Masson, France.
[25] Coelho J.P., de Moura Oliveira P.B., Boaventura C.J. (2005). Greenhouse air temperature predictive control using the particle swarm optimization algorithm, Computers and Electronics in Agriculture, Vol. 49, No. 3, pp. 330-344. DOI: 10.1016/j.compag.2005.08.003
[26] Raithby G.D., Chui E.H. (1990). A finite-volume method for predicting a radiant heat transfer in enclosures with participating media, Transactions of ASME Journal of Heat Transfer, Vol. 112, No. 2, pp. 415-423. DOI: 10.1115/1.2910394
[27] Kim S.H., Huh K.Y. (2000). A new angular discretization scheme of the finite volume method for 3-D radiative heat transfer in absorbing, emitting and anisotropically scattering media. International Journal of Heat and Mass Transfer, Vol. 43, No. 07, pp. 1233-1242. DOI: 10.1016/S0017-9310(99)00211-2
[28] Boulard T., Wang S. (2002). Experimental and numerical studies on the heterogeneity of crop transpiration in a plastic tunnel, Computers and Electronics in Agriculture, Vol. 34, No. 1-3, pp. 173-190. DOI: 10.1016/S0168-1699(01)00186-7
[29] Molina-Aiz F.D., Valera D.L., Pena A.A., Alvarez A.J., Gil J.A. (2006). Analysis of the effect of rollup vent arrangement and wind speed on Almeria-type greenhouse ventilation performance with computational fluid dynamics, Acta Hort, Vol. 719, pp. 173-180. DOI: 10.17660/ActaHortic.2006.719.17
[30] Pieters J.G., Deltour J.M. (2006). Performances of greenhouses with the presence of condensation on cladding materials, Journal of Agricultural Engineering Research, Vol. 68, No. 2, pp. 125-137. DOI: 10.1006/jaer.1997.0187