OPEN ACCESS
In school buildings, the relationship between energy requirements and occupant thermal-hygrometric comfort plays an important role because these buildings are great energy consumers also as the current rules impose large rates of ventilation outside air for classrooms.
The goal of this paper is the thermal and energetic comparison of various air-conditioning systems that are appropriate for school buildings. Among the different suitable HVAC systems for schools, the following types are considered: all-air system (with constant air volume and heat recovery) and zone heating coils; radiant heating floor panels and primary air; fan-coils and primary air.
The analyses are performed on a designed new school building, by means of a dynamic building energy simulation software (Design Builder), based on Energy Plus engine.
The simulations are conducted to obtain the trends of various internal environmental parameters for both winter and summer, i.e. temperature, relative humidity and PMV (Predicted Mean Value) index in one classroom. In cooling and heating conditions, the HVAC systems are active, while in the intermediate seasons only mechanical ventilation is working. This study evaluates the performances of different HVAC systems from an energy, thermal comfort and economic point of view. The analyses are conducted for Rome, characterized by Mediterranean climate.
HVAC systems, Schools, Thermal comfort, Energy performance, Dynamic simulation.
The choose of an appropriate HVAC System for educational buildings is very influenced by different rules on energy efficiency; at same time, indoor air quality and thermal comfort must be guaranteed.
In Italy, children spend in school buildings from 4 to 8 hours a day, for at least 10 years. It is estimated that 15% of the population, about 10 million people, including students and teachers, study or work every day in approximately 45,000 educational public buildings throughout the national territory [1]. Energy consumption of HVAC systems for educational buildings has a great impact both economically and environmentally.
Some researchers focused on the building envelope and systems in order to propose adequate strategies for energy efficiency and indoor air quality for schools in Cyprus [2]. In school buildings, these two aspects must be taken into account, because legislation imposes high air changes for classrooms (e.g., up to 5 ACH in Italy [3]), in order to have healthy zones and ensure good performances of students. Some researches illustrated that student performance and class attendance depend on the comfort conditions of the environment and air quality. Wargocki and Wyon through the experiments showed that the increase in the amount of outside air and the reduction of design temperatures during the summer season improves the performance, especially in terms of rapidity with which each pupil works but also in terms of quality of work [4].
The relationship between IAQ - thermal comfort and energy consumption was analyzed by Becker et al. [5]: the trend of comfort and air quality parameters were monitored and the energy saving related to particular characteristics of school building envelope in Mediterranean areas were calculated.
Several studies highlighted the possible operations to be performed on the envelope in order to reduce energy needs. De Santoli et al. proposed different kinds of energy efficiency retrofit measures on building components for schools located in Rome, by classifying them according to quality and economic and financial aspects [6].
Several authors analyzed the possibility of using renewable energy sources such as the solar energy, cogeneration systems and geothermal heat pumps for school buildings [7].
In order to reduce the energy demand and at the same time to have high thermal comfort conditions, a comparison among different types of HVAC systems typically utilized for school buildings can be useful: at moment, it is not possible to say unequivocally what is the optimal system for a school, but several studies have to be conducted for each case.
The purpose of this paper is to compare, for a given building envelope relative to a designed educational building, different HVAC systems for the city of Rome (Southern Europe, Mediterranean climate).
The analysis is carried out through a commercial energy simulation software in dynamic mode, Design builder, based on Energy Plus simulation engine.
The trend of temperature, relative humidity and PMV in one classroom is monitored and the energy requirements and the related costs referred to the entire building during one operating year are calculated.
The simulation is carried out for three types of HVAC systems that are suitable for a school building.
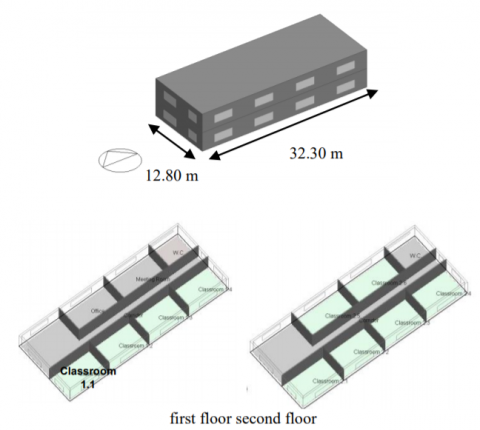
The investigated school building (Figure 1) is a designed construction of two floors and developed in the west-east direction. The building is characterized as follows: total floor area of 832 m2 (2,912 m3) and air conditioned floor area of 748 m2 (2,393 m3). It is divided in different thermal zones: 10 classrooms, 2 administration offices and 4 service spaces, as corridors and toilet. The inner height of the rooms is 3.3 m and the classrooms have an average area of 40 m2. The analyzed school is a secondary school, where extra-curricular activities are performed, and it operates during the entire year, except for August and typical annual holidays.
Figure 1. The simulated school building
Geometric and thermo-physical data of the building are reported in Table 1.
The other parameters used to build up the energetic model are shown below.
Table 1. Building dimensions and envelope characteristics
|
Main building dimensions and geometric characteristics: |
|||
|
Length (E-W direction): 32.30 m |
Width (N-S direction): 12.80 m |
Global height: 7.00 m |
|
|
Building envelope characteristics: |
|||
|
Uexterior_walls: 0.316 W/m2K |
Uupper_ roof: 0.250 W/m2K |
Uground_ floor: 0.250 W/m2K |
|
|
Uwindows: 1.97 W/m2K |
Window solar heat gain coefficient: 69 % |
|
|
|
Gross wall area: 631.40 m2 |
Window opening area: 109.24 m2 |
Window-to-wall ratio: 17.30 % |
|
The HVAC systems analyzed are some of the most suitable ones for school needs: the high outside airflow rate for classrooms (e.g., 5 ACH in Italy for secondary schools) is one of the most important priorities which the HVAC system has to guarantee. So, the analyzed systems are based on an air handling unit (AHU) characterized by heating and cooling coils supplied with water from an air-to-water heat pump. The vapor humidifier is fed by electric power. These components have been chosen considering different datasheets of manufacturers for the types and sizes of interest. The three HVAC systems examined are described below, and their main characteristics are reported in Table 2:
1) Constant Air Volume (CAV), an all-air system, combined with heat recovery system (RE) and Zone Heating Coils (ZHC), that can control indoor parameters room by room (CAV+RE+ZHC);
2) Fan-coils combined with primary air (FC+AHU), an air-water system, where the fluid that handles the sensible load of the room (control of the indoor temperature) is the water, while the air balances the latent load (control of the indoor relative humidity). Fan-coils are fed by a heat pump, the same that serves the AHU;
3) Radiant heating floor panels with primary air (HF+AHU), an air-water system; heated floors are fed by water from the heat pump. In cooling mode, the heated floors are off (for a limitation of the software).
Table 2. Main characteristics of the HVAC systems
|
CAV+RE+ZHC |
FC+AHU |
HF+AHU |
|
|
Generation type: air-to-water heat pump |
|||
|
Nominal coefficient of performance (COP, EER) |
|||
|
Winter COP: 2.7 |
Summer EER: 2.8 |
||
|
Fans efficiency: 0.7 |
|||
|
Heat recovery |
|||
|
Type: plate hsensible = 0.7 (at 100 % airflow) |
Absent |
absent |
|
For thermal comfort analysis, the classroom number 1.1 at first floor is examined (see Figure 1). In classroom 1.1 there is a thermostat for each analyzed HVAC system. The thermal comfort analysis is carried out only for this room, not for other classrooms and offices. Some analyses have been also performed considering 50 % occupancy level in the classroom 1.1, to test the HVAC system ability in adapting to thermal load variation.
3.1 Thermal-hygrometric analysis
A thermal comfort analysis has been conducted for Rome, in order to show the quality of the thermal comfort achieved by the different analyzed HVAC systems. Although the set point values of indoor temperature and relative humidity, the operation profiles and thermal generators are equal for the three HVAC systems, the thermal comfort parameters obtained for the three systems are different, due to the different thermal inertia of terminals and the heat transfer fluid that arrives to classrooms: so, different indoor air temperatures and different energy demands (reported in the following section), have been obtained.
Typical days for heating and cooling modes in Roma are chosen to evaluate indoor air temperature, R.H. and PMV values, i.e. 2nd February for winter, 2nd July for summer.
3.1.1. Winter conditions
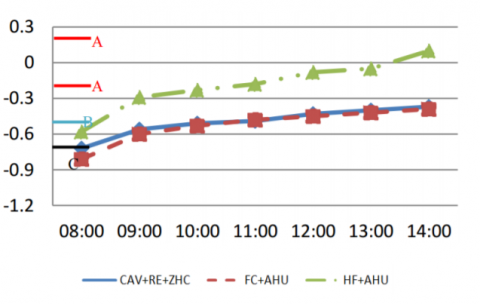
The above mentioned parameters are reported in the following figures during school hours (8:00-14:00); in PMV diagrams, thermal comfort class limits (A, B, C) according to CEN [11] are highlighted. The systems operate from 7:30 to 14:00.
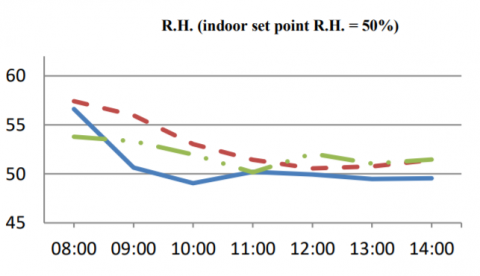
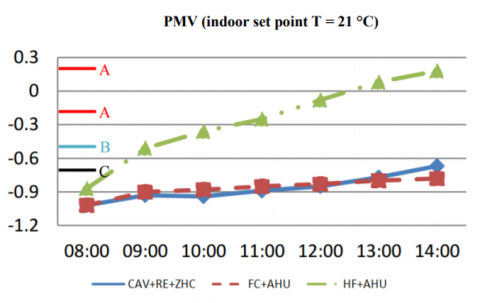
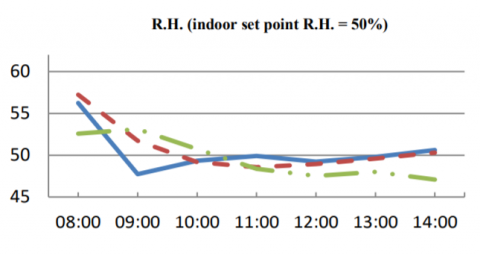
Figure 2. Indoor air T, R.H. and PMV in classroom 1.1 with 100% level occupancy - winter
From Figure 2, the following observations can be obtained.
For all the analyzed HVAC systems, indoor dry bulb T is always equal or greater than the set point (21 °C), with a slight increase in the final part of the day, due to the raising of the external temperature.
In addition, the R.H. set point is reached by the three HVAC systems thanks to the presence of humidifier in the AHU. The CAV+RE+ZHC system shows slightly better results in terms of obtained indoor relative humidity (the set point value is reached early, due to the re-heating coils that provide additional air treatment). Regarding the obtained PMV values, from Figure 2, two aspects emerge:
1) for the CAV+RE+ZHC and FC+AP systems, the PMV values are out of the thermal comfort classes; it depends on the chosen indoor T set (21°C), which is too low for the purpose of thermal comfort;
2) on the contrary, the HF+AP system achieves comfort classes B and A: in fact, the PMV takes into account also the radiant mean temperature, and heated floor system allows to achieve radiant temperatures higher than the other systems.
In any case, PMV increases during the morning due to the thermal inertia of the walls and the decreasing thermal loads.
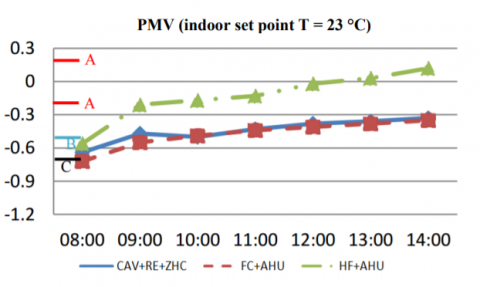
Therefore, a simulation with design indoor air temperature of 23 °C has been performed, to avoid uncomfortable conditions, and PMV diagram is reported in Figure 3.
Figure 3. PMV values in classroom 1.1 with 100 % level occupancy and design indoor air T of 23 °C - winter
It can be observed that comfort classes B-C are obtained for CAV+RE+ZHC and FC+AP systems, whereas HF+AP system allows almost always the best class (A).
It is useful to remember that in Italy the indoor air design temperature in winter is fixed at 20°C by law for the purpose of energy savings; anyway, in these cases different temperatures are used for research purposes.
In the case of the same classroom but with 50 % occupancy level (Figure 4), the CAV+RE+ZHC and FC+AHU systems guarantee a constant temperature of 21°C; also the HF+AHU system, after an initial difficulty, is able to reach the T set point value. Regarding the relative humidity, in this case the behavior of the three systems is better compared to the case of 100% occupancy level, because the latent loads are lower; each system guarantees the design value of relative humidity (50 %); slightly better R.H. results are obtained by the CAV+RE+ZHC system. Concerning the PMV, similar results of Figure 2 are obtained, but colder conditions derive, due to minor presence of persons (50 % occupancy level).
Finally, above all when occupation is 50 %, the indoor air temperature of 21 °C is too low and there are levels of discomfort. Therefore, it would be useful to consider a higher indoor temperature; the Figure 5 shows the trend of the PMV with an indoor design temperature of 23 °C.
The PMV values related to an indoor air design temperature of 23 °C are almost always at least in class C, except for the first hours in the case of CAV and FC systems (values slightly below to the class C). The trend of PMV in the case of HF system leads to class C in the first morning, then class B and, since about 11 a.m., class A.
As a conclusion, the system with radiant heating floor panels show the best results in winter compared to the other analyzed systems.
Figure 4. Indoor air T, R.H. and PMV in classroom 1.1 with 50 % level occupancy – winter
Figure 5. PMV values in classroom 1.1 with 50% level occupancy and design indoor air T of 23 °C – winter.
3.1.2. Summer conditions
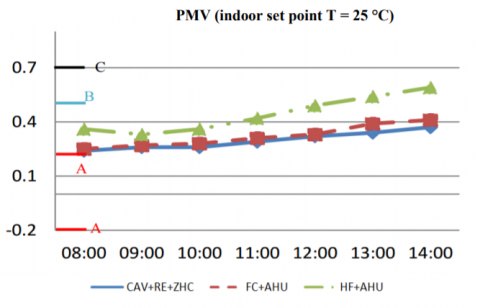
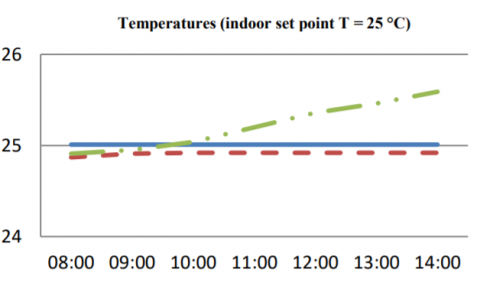
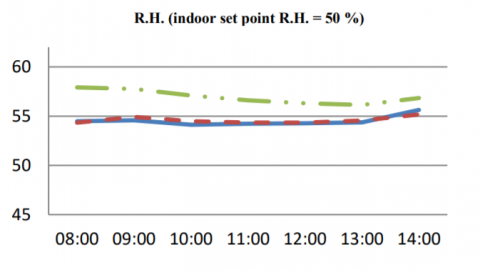
For summer, the same parameters have been monitored in classroom 1.1 for a typical day (2 July) between 8:00 and 14:00, with HVAC systems operating since 7:30. The Figure 6 shows the following results.
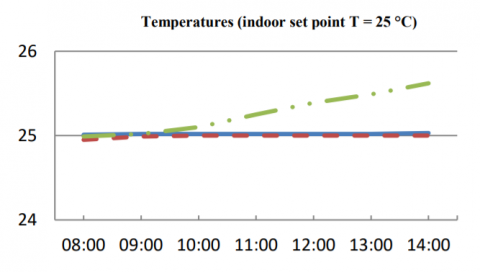
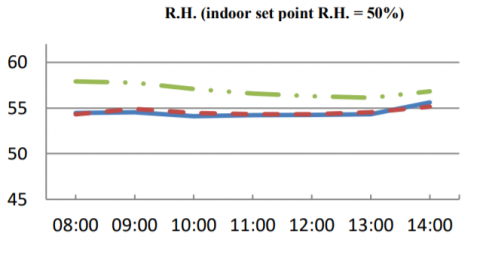
Figure 6. Indoor air T, R.H. and PMV in classroom 1.1 with 100% level occupancy – summer.
The results obtained by the CAF+RE+ZHC and FC+AHU systems in the room with 100 % occupancy are almost the same, whereas the results are worse for HF+AP. In fact, in the last case, the radiant panels are turned off in cooling mode and only primary air is used: so, indoor air temperature is higher compared to other systems, because zone terminals don’t contribute to handle the thermal loads. Also regarding indoor air R.H. (set point of 50 %) and PMV values, the worst control is obtained by the HF+AHU system. In all the cases, for indoor T set point of 25 °C, the PMV values are always positive and the feeling of hot is more relevant for HF+AHU system, whereby values are in class B at early morning and in class C since 12:00. The other two systems provide PMV values in class B for all classroom hours. Compared to winter conditions, all systems make room comfortable given that PMV values vary between B and C Class, which stay in comfort zone. In Italy, design summer indoor air dry bulb temperature is usually of 26 °C for energy saving purpose. For research purpose, a simulation has been carried out with indoor T set of 24 °C, to see how the comfort parameters change. PMV diagram with temperature of 24 °C is reported in Figure 7.
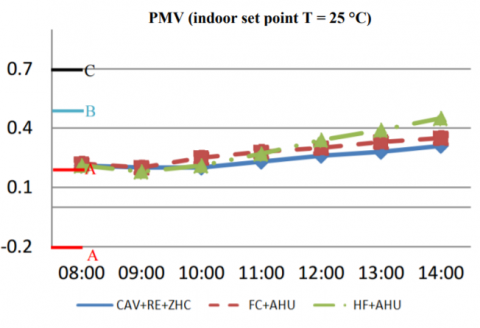
Figure 7. PMV values in classroom 1.1 with 100% level occupancy and design indoor air T of 24 °C – summer
Figure 8. Indoor air T, R.H. and PMV in classroom 1.1 with 50 % level occupancy – summer
In this case, A class is reached for the entire school day with CAV+RE+ZHC and FC+AHU systems, while with HF+AHU A class is obtained until about 11:00 (B class from 11:00 to 14:00). In terms of comfort, parameters get better, but energy cost get higher to provide low indoor air dry bulb temperature.
It is useful to see what happens decreasing occupancy level also in summer season: in Figure 8, the same parameters are monitored with level of occupancy equal to 50 %.
As is the winter case with occupancy of 50 %, also in summer the temperature set point is reached and stays constant for CAV+RE+ZHC and FC+AHU systems, while the HF+AHU systems provides slightly higher T and PMV values at the end of the day with increasing thermal loads, given that in summer the radiant panels are turned off. The same applies to the relative humidity for the three systems: the decrease of the latent load (compared to the case of 100% level occupancy) allows to reach values closer to the set point. Regarding PMV values, they are positive and between classes A and B, with worse results at the end of day because of external temperature increase. The PMV values for the three systems are almost equal, with a better control in the case of the CAV+RE+ZHC system, thanks to zone heating coils.
A simulation with indoor air design temperature of 24 °C and an occupancy level of 50% has been conducted, but the results have not been reported.
3.2 Energetic simulations
The comparison among the different HVAC systems is based on energy requirements (only electric energy) and operation costs for the entire building in one year. In this section, primary energy demands and energy cost are analyzed.
It can be noted that, as reported in section 2, the analyzed HVAC systems are supplied by an air-to-water heat pump, fed by electrical source, with nominal COP of 2.7 in winter and EER of 2.8 in summer; thermal to electrical conversion efficiency is 0.46.
The simulations for obtaining the energy requirements have been performed considering the indoor air temperature values of 21 °C in winter and 25 °C in summer.
Figure 9. Specific primary energy demands for the considered HVAC systems
In Figure 9, the specific primary energy (kWh/m2y), subdivided per equipment (fans, humidifier, heating generation and cooling generation), is shown. The energy for pumps is negligible (about 0.10 kWh/m2y). The following observations can be deduced.
The minor annual primary energy demand (32.9 kWh/m2) is related to the CAV+RE+ZHC system, followed by the HF+AHU (41.8 kWh/m2) and FC+AHU (44.6 kWh/m2). The best energetic result is obtained by the first system because only in this case there is an air-to-air heat recovery in the AHU.
Another noticeable aspect is that cooling demand is bigger than heating demand for the considered school building, despite winter period is longer than summer one. This is due to the low U-values of the building envelope components and
to the various high internal loads (high occupancy level), which in winter are internal gains so advantageous for heating generation, while they increase the thermal loads in cooling mode.
The primary energy for heat generation of CAV+RE+ZHC system is significantly lower compared to the other two systems, because in the AHU there is the above mentioned heat recovery.
When it comes to the primary energy used for auxiliary equipment (such as fans, pumps and humidifier), the bars relate to the various HVAC systems are almost the same, except in the case of fans for FC+AHU system, because energy demand is little bigger due to the presence of fans in fan-coil terminals.
The annual energy costs (Figure 6) are proportional to global primary energy requirements.
Also with reference to the annual energy costs, the CAV+RE+ZHC system is the cheapest, despite the presence of zone heating controls, which usually lead to additional energy costs: in this case, a heat recovery is set up inside the air handling unit, and this allows savings of 25 - 28 % compared to the other systems.
The PMV trends reported in the previous section showed better thermal comfort levels reached by fixing a design indoor air temperature of 23 °C instead of 21 °C in winter and 24 °C instead of 25 °C in summer: therefore, Figure 11 reports the annual energy costs for heating and cooling production when considering the different indoor air temperatures used for thermal-hygrometric analysis.
The energy costs for 23 °C (winter) and 24 °C (summer) are obviously higher compared to the costs related to 21 °C and 25 °C, respectively. The greatest differences are in winter, where the temperature gap is equal to two Celsius degrees. In the case of CAV+RE+ZHC system, there is an increase in energy costs of 87 % in winter, while for FC+AHU and HF+AHU systems these increases are of 50 % and 33 %, respectively.
The difference of energy costs is lower in summer (where the temperature changes by only one Celsius degree): for FC+AHU and CAV+RE+ZHC systems, the additional costs are 3 % and 5 %, respectively, while the increase is 10% for the HF+AHU system.
Figure 10. Annual energy cost.
Figure 11. Energy cost for heating (a) and cooling (b) generation, for different values of indoor air T
This paper wants to help the designers of HVAC systems for educational buildings in Mediterranean climates in achieving a satisfactory indoor air quality and thermal comfort with the minimum energy cost.
Three kinds of HVAC system for a designed new school building in Rome (Mediterranean climate) have been analyzed by means of a commercial dynamic building energy performance simulation software. The compared suitable systems are: constant air volume system with zone heating coils and heat recovery inside AHU (CAV+RE+ZHC); fan-coils system with primary air (FC+AHU); radiant heating floor panels with primary air (HF+AHU). All these systems are fed by hot or cold water from the same air-to-water heat pump.
In terms of thermal-hygrometric comfort for a classroom, the heating mode and cooling mode show different results.
In winter, the heated floor system with primary air guarantees better comfort levels, with PMV values in class A starting from the second half of morning (considering indoor design temperature of 21 °C). This is due to the higher radiant mean temperatures obtained, compared to the other systems. On the contrary, when considering indoor design temperature of 21 °C, the FC+AHU and CAV+RE+ZHC systems don’t allow to get neither the class C in the first half of the morning, where the PMV is < -0.7 and there is a feeling of cold in the classroom. To avoid this problem, by using an indoor air design temperature of 23 °C, PMV values grow up and are in comfort zone for all school hours, while for the system with the heated floor the comfort levels get better and the class A is obtained for the entire day.
In summer, the best control of the indoor environmental conditions is obtained by the CAV+RE+ZHC system, followed by the FC+AHU system (slightly worse comfort conditions), and at the end by the HF+AHU system. The design indoor air temperature of 25 °C allows to obtain comfort levels (0.2<PMV<0.6) even if there is a slight feeling of hot. Considering 24 °C, PMV values get better and stay around neutral thermal zone (PMV = 0) or anyway in Class A.
Regarding trends of indoor relative humidity, the best control is obtained by the CAV+RE+ZHC system, thanks to zone coils which can provide further treatments to supply air. It must be mentioned that, due to the presence of a high latent load related to high occupancy level, indoor relative humidity values are just over 50 % (set point), in both winter and summer.
When considering the occupancy level of 50 % in the analyzed classroom, the three systems are able to maintain the values of the set point for indoor air temperature and relative humidity for both winter and summer. However, the comfort conditions are not reached in the case of a design indoor air temperature equal to 21 ° C in winter (PMV values less than -0.7), and therefore it is necessary to increase the indoor air design temperature. On the contrary, in summer a minor occupancy level (50 %) results advantageous regarding thermal comfort, due to the reduced thermal load.
Concerning the annual primary energy demand and energy costs the highest values are obtained by the FC+AHU system, followed by the HF+AHU and CAV+RE+ZHC. The highest energy demand for the three systems is due to cooling generation because inner loads are huge. Obviously, some energy extra-costs derive if design indoor air temperature of 23 °C in winter and 24 °C in summer are fixed.
From the paper, it is possible to deduce some advices:
- design indoor air temperature of 20 °C in winter, as fixed by the Italian rules, is too low to reach thermal comfort conditions, also in place where internal gains are high. It is preferable using an indoor air temperature higher than 20 °C, e.g. 22-23 °C;
- in summer, a design indoor air of 25 °C is optimal in terms of thermal comfort and energy savings, although if it is decreased by one Celsius degree (24 °C instead of 25 °C), the energy cost increase is slight (3-10%);
- the presence of a heat recovery inside the AHU is recommended for whatever HVAC systems, because it can afford to significantly reduce energy consumption (by 25-30 % in heating mode);
- in school buildings with low U-values of the envelope components and characterized by high internal thermal loads, the cooling energy demands in summer are relevant in Mediterranean climates.
Finally, it is not simple to establish which HVAC system is the best one for educational buildings in Mediterranean climates: it mainly depends on the boundary conditions and on which aspects (thermal comfort or energy costs, winter or summer conditions) are preferred.
This work was developed in the framework of the European project “Italian Training qualificatiOn Workforce in buildiNg” (Acronym: BUILD UP Skills I-TOWN), Intelligent Energy - Europe (IEE), Call for proposals CIP-IEE-2013 - BUILD UP Skills Initiative. Contract N°: IEE/13/BWI/721/SI2.680178.
|
A, B, C AHU CAV COP EER FC HF HVAC IAQ |
Thermal comfort classes A, B and C, according to CEN 2005 Air Handling Unit Constant Air Volume (system) Coefficient of Performance Energy Efficiency Ratio Fan-Coil Heated Floors (radiant heating floor panels) Heating, Ventilation and Air Conditioning Indoor Air Quality |
|
PMV RE |
Predicted Mean Vote Heat recovery |
|
ZHC R.H. |
Zone Heating Coil Relative Humidity (%) |
|
T |
Temperature (°C) |
|
U |
Unitary thermal transmittance (W/m2K) |
|
ACH |
Air Change per Hour (h-1) |
|
Greek Symbol |
|
|
$\eta$ |
Efficiency |
|
Subscripts |
|
|
Sensible |
Referred to sensible thermal load |
[1] Ministero della Salute (2010), “Programma di prevenzione per le scuole dei rischi indoor per malattie respiratorie e allergiche” [Online], Italy. Available: http://www.salute.gov.it/imgs/c_17_pubblicazioni_1892_allegato.pdf.
[2] Katafygiotoua M. C. and Serghidesa D. K., “Indoor comfort and energy performance of buildings in relation to occupants’ satisfaction: investigation in secondary schools of Cyprus”, Advances in Building Energy Research, vol. 8, no. 2, pp. 216-240, 2014. DOI: https://doi.org/10.1080/17512549.2013.865554.
[3] Decreto Ministeriale 18 dicembre 1975, Norme tecniche aggiornate relative all’edilizia scolastica, ivi compresi gli indici di funzionalità didattica, edilizia ed urbanistica, da osservarsi nella esecuzione di opere di edilizia scolastica, (in Italian).
[4] P. Wargocki and P. Wyon, “Effects of HVAC On Student Performance”, ASHRAE Journal [Online] 48, pp. 23-28, 2006 Available: http://awilkinson.us/sustain/2D_4_Effects_HVAC_onStudentPerformance.pdf
[5] Becker R., Goldberger I. and Paciuk M., “Improving energy performance of school buildings while ensuring indoor air quality ventilation”, Building and Environment, vol. 42, no. 9, pp. 3261-3271, 2007. DOI: https://doi.org/10.1016/j.buildenv.2006.08.016.
[6] De Santoli L., Fraticelli F., Fornari F. and Calice C., “Energy performance assessment and a retrofit strategies in public school buildings in Rome”, Energy and Buildings, vol. 68, part A, pp. 196-202, 2014. DOI: https://doi.org/10.1016/j.enbuild.2013.08.028.
[7] Calise F., “Thermoeconomic analysis and optimization of high efficiency solar heating and cooling systems for different Italian school buildings and climates”, Energy and Buildings, vol. 42, no. 7, pp. 992-1003, 2010. DOI: https://doi.org/10.1016/j.enbuild.2010.01.011.
[8] International weather Data for Energy Calculations (IWEC Weather Files) Users’ Manual and CD-ROM, ASHRAE, Atlanta, GA, 2001
[9] Eurostat (2015), “Energy price statistics” [Online]. Available: http://ec.europa.eu/eurostat/statistics-explained/index.php/Energy_price_statistics#Electricity_prices_for_household_consumers.
[10]AEEGSI (2015), “Testo unico ricognitivo della produzione elettrica” [Online], Italy. Available: http://www.autorita.energia.it/it/elettricita/ele_produzione.htm.
[11] Ergonomics of the thermal environment – analytical determination and interpretation of thermal comfort using calculation of the PMV and PPD indices and local thermal comfort criteria. CEN EN ISO 7730 Standard, 2005