OPEN ACCESS
At present, the office buildings built in Italy before the first energy regulations of the '70s show a growing energy consumption for heating and cooling. The electrical energy demand for summer cooling is increasing, too. Among the possible strategies, thermal insulation of the building envelope is a common solution to reduce energy needs. However, in buildings with high internal thermal loads and/or located in climates characterized by warm summers and mild winters, an excessive insulation thickness, although in compliance with legal requirements, may be counterproductive.
In this paper, by using a dynamic energy simulation software (Design Builder), a case study is analyzed concerning the energetic and economic impacts of thermal insulation applied on the external side of an existing office building. The chosen Mediterranean localities are Palermo, Rome, Milan and Cairo. Increasing internal thermal loads (10, 20, 30 W/m2) are considered. The results show that hyper-insulation of buildings is not convenient in the considered climates. In two localities (Palermo and Rome), the optimal insulation thickness is lower than that needed to meet the regulations on energy saving in buildings. Finally, PMV (Predicted Mean Vote) index for some disadvantaged rooms is shown to consider also the thermal comfort requirements.
Dynamic simulation, Energy efficiency, Office building, Optimal insulation thickness, Payback.
In Italy, office buildings have had a critical evolution of energy demand in recent years: the increase in electric energy use is also a consequence of augmented demand for summer cooling. The electrical energy demand in office buildings is about 50 % of the total energy demand [1].
Italian offices are almost 570,000, the 30.5 % of which has internal spaces in 64,911 buildings completely or predominantly assigned to offices, and they are responsible for a significant rate of the Italian energy demand. Considering only public offices, the electrical energy and thermal one used for air conditioning are approximately 1.88 TWh/year and 1.01 TWh/year, respectively [2].
In EU-27, there is an estimated air-conditioned area of 12.5 billion square meters and an average energy use of 159 TWh/year for heating and 7 TWh/year for cooling [3]: the reduction of energy demand in office buildings, which represent a considerable rate of the building heritage, is an important target to reach.
The use of one or more layers of insulating material on the opaque elements of the building envelope is a very common solution among the possible strategies to reduce energy requirements [4-7]. However, in some types of buildings, like office buildings, the uncritical application of large thermal insulation thicknesses could be counterproductive from the energetic, environmental and economic point of view: it is the case of buildings with high internal thermal loads and/or buildings placed in climates with hot summers and mild winters. An increase of cooling energy demand in summer higher than the reduction of heating energy one in winter may be obtained. The only reduction of the stationary thermal transmittance (U-value) of the building envelope opaque components could be hazardous. In fact, in a too insulated building envelope, there are difficulties to expel exceeding heat during summer and this might cancel the benefits due to the reduction of thermal losses in winter.
The optimal insulation thickness is a function of many variables, such as the building type, intended use, orientation, climate, cost and type of energy source, efficiency of the systems, building envelope. Kaynakli [8] has observed these influences. Usually, the optimal thermal insulation thickness is not too high, because when increasing the insulation thickness, the thermal loads of the building and energy costs decrease but material costs grow [8]. In many studies carried out considering the steady state, the results of economic analysis are based on heating and cooling demands and the concepts of degree-days and degree-hours have been frequently used [9-11]. On this topic, the experiences that consider a transient behaviour are quite limited [12-14].
However, other researchers as Dombayci [15], Comakli et al. [16], Iqbal et al. [17] support the need to correlate also other parameters in addition to the traditional ones, such as CO2 and SO2 index, in order to obtain the optimum insulation thickness. Yildiz et al. [18] investigated the influence of different energy sources.
The optimization of the building thermal insulation thickness very often refers to winter season but not summer. Unfortunately, this happens also in Mediterranean climates (as underlined in the recent Italian laws on building energy efficiency). Therefore, the current approach is inadequate, especially when it considers the cost-optimal methodology [19]. The limited researches about the energetic effect induced by the thermal insulation in summer are the main reason [20, 21].
The calculation of the thermo-physical parameters of the opaque building envelope components [22, 23], in order to evaluate and optimize also the energy impacts in summer of insulating material, is appropriate.
In this paper, the evaluation on a case study of the energetic and economic impacts of external thermal insulation is carried out, by using energy simulations under dynamic conditions. The analysis is performed for the cities of Palermo, Milan, Rome and Cairo, increasing the values of the internal thermal loads (10, 20, 30 W/m2). The optimal insulation thicknesses is obtained by calculating primary energy requirements and discounted payback periods, in order to demonstrate the need to avoid excessive thermal insulation thickness for buildings in Mediterranean climates. The current Italian tax deduction (65 %) is considered in the evaluation of the discounted payback period [24]. Moreover, the PMV index is evaluated for some disadvantaged rooms to consider also the thermal comfort requirements.
2.1 Reference building
Basing on a recent statistical research [25] on the stock of Italian office buildings, the technological characteristics of the reference existing building are defined (Figure 1). The structural characteristics of this building are typical of Italian buildings from 1946 to 1970 (reinforced concrete frame structure with brick walls). The reference building has three levels, a basement and two floors. There is a parking area and a storage room in the basement. On the ground floor, there are the foyer, the dining room, a corridor, two bathrooms and four offices; at the first floor, there are six offices, a corridor and two bathrooms.
The characteristics of the opaque and transparent building envelope components are shown in the Tables 1 and 2. The air conditioning system consists of fan-coils powered by an air-to-water electrical heat pump for heating and cooling (Tables 3 and 4). The total heated and cooled building area is 394 m2.
Figure 1. Reference building and first floor isometric views
Table 1. Characteristics of the opaque components
Table 2. Characteristics of the windows
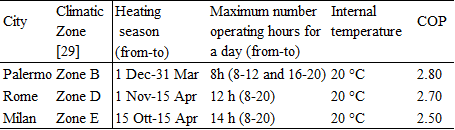
Table 3. Heating periods and COP of the heat pump for the three Italian climatic zones
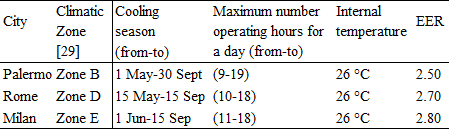
Table 4. Cooling periods and EER of the heat pump for the three Italian climatic zones
2.2 Research methodology
The evaluation of the influence of the external thermal insulation on the building energy demand is performed. Three cases are considered: insulation only on the walls -Proposal A; on the walls and roof slab - Proposal B; on the walls, roof slab and the floor of the ground storey (i.e., the slab between the ground storey and the basement) - Proposal C. The Table 5 shows the values of U, Y and k for opaque components of the building envelope before and after the application of the insulating material with variable thicknesses (from 2 to 12 cm, with an interval of 2 cm). The analysis is carried out considering two kinds of insulating materials, a little massive EPS (Expanded Polystyrene) and a massive wood fibre. In brief, since the similarity of the obtained results, only the analysis related to the wood fibre is reported (λ = 0.038 W/mK, ρ = 150 kg/m3, c = 2.1 kJ/kgK).
Table 5. Values of U, Y and k before and after the application of the insulation on the building envelope
The optimal insulation thickness depends a lot on the climatic characteristics of the context where the building stands. Four different cities (Palermo, Rome, Milan and Cairo) are chosen to perform the analysis. Their design outdoor temperatures are reported in Table 6 [26].
Table 6. Design outdoor temperatures for the considered localities
In the cases of Palermo, Rome and Milan (Italian cities), the thermal transmittance limit values to respect the current national laws on energy saving in buildings [27] and the previous ones [28], in the case of refurbishment, are reported in the Table 7. The usage profiles of the systems defined by Italian laws [29] are shown in Tables 3 and 4. For Cairo and Palermo, the same usage profiles are considered.
The contribution of internal thermal loads is also varied. In offices buildings there are many electronic devices (PCs, printers, copiers, monitors, etc.). The values of the internal thermal loads may be very high: 10, 20 and 30 W/m2 are considered (the thermal load due to artificial lighting is not included).
Design Builder [30] is the software used for the calculation of building energy demands for heating and cooling and the evaluation of the indoor thermal comfort index (PMV). It is a software for energetic dynamic simulation and represents a graphical user interface of Energy Plus software. Energy Plus calculation engine has been experimentally validated through analysis on the building envelope and HVAC systems.
Table 7. Maximum U-values for the Italian cities according to national laws on energy saving in buildings
3.1 Results for Palermo
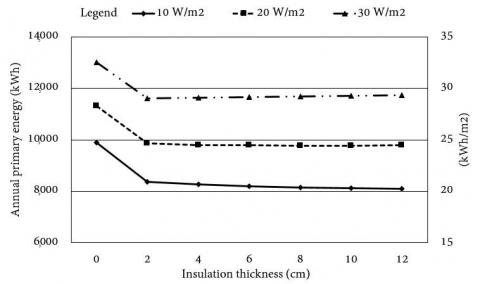
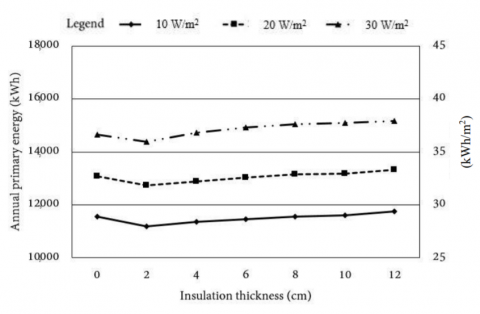
The energetic analysis carried out in the climatic context of Palermo (Southern Italy - warm summers and mild winters) shows an initial reduction of annual primary energy requirement, up to 2 cm of insulating thickness, for all the proposals A, B, C (Figure 2). When considering higher thickness, a quite constant trend is obtained for the proposal A (Figure 2a) and a slight reduction of the annual energy demand in the case B (Figure 2b). The application of insulating material with a thickness higher than 2-4 cm is not convenient in the case C (Figure 2c). Moreover, the annual energy requirement grows with the internal thermal loads and it is due to the increased cooling demand. In terms of seasonal energetic requirements (Figure 3, referred to proposal B and internal thermal load of 20 W/m2), the cooling demand grows over 2 cm of insulation, while the heating one is always decreasing.
Comparing the three proposals from annual primary energy point of view, the most convenient solution is the proposal B (insulation on walls and roof slab), followed by the C (insulation on all opaque building envelope) and then the A (insulation on walls). The proposal B is better than C because the basement storey represents a suitable cold source in summer, so a not insulated floor of the ground storey is preferable. Moreover, the optimal insulation thickness calculated in the case of Palermo (2-4 cm) is significantly lower than the one obtained by applying the thermal transmittance limits imposed by current Italian laws on energy efficiency in buildings (6-8 cm).
Figure 2a. Annual primary energy requirement as a function of the insulation thickness - Proposal A for Palermo
Figure 2b. Annual primary energy requirement as a function of the insulation thickness - Proposal B for Palermo
Figure 2c. Annual primary energy requirement as a function of the insulation thickness - Proposal C for Palermo
Figure 3. Seasonal primary energy requirement as a function of the insulation thickness- Proposal B for Palermo, 20 W/m2
Figure 4. Discounted payback as a function of the insulation thickness - Proposal B for Palermo
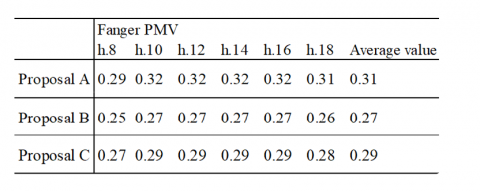
Table 8. PMV for office 6 on 20 August – Palermo, insulation thickness of 4 cm, internal loads of 20 W/m2
Considering a DPB analysis, the best solution is still the second one (B), with optimal thicknesses of thermal insulation in the range 2-4 cm (Figure 4). Also in terms of indoor thermal comfort in summer, by applying an insulation thickness of 2-4 cm, the Fanger PMV index in the office 6 (one of the most disadvantaged rooms in summer) is acceptable (Table 8).
3.2 Results for Milan
In the case of Milan (Northern Italy – warm summers and very cold winters), there is always a reduction of the annual primary energy requirement for heating and cooling with the increase of the insulation thickness, as shown for the cases A (Figure 5a), B (Figure 5b) and C (Figure 5c). Moreover, for all the proposals, the curves related to the various considered internal thermal load values tend to overlap. Considering Figure 6 (seasonal energy analysis), it is clear that this is due to the fact that heating energy needs are significantly higher than cooling ones, because of the cold winters. In this climatic context, the proposals C (thermal insulation on all opaque building envelope) and B (thermal insulation on all opaque building envelope except the ground slab) are characterized by the lowest energy requirements.
Figure 5a. Annual primary energy requirement as a function of the insulation thickness - Proposal A for Milan
Figure 5b. Annual primary energy requirement as a function of the insulation thickness - Proposal B for Milan
Figure 5c. Annual primary energy requirement as a function of the insulation thickness - Proposal C for Milan
Figure 6. Seasonal primary energy requirement as a function of the insulation thickness- Proposal B for Milan, 20 W/m2
3.3 Results for Rome
Figure 7. Discounted payback as a function of the insulation thickness - Proposal C for Milan
Table 9. PMV for office 1 on 21 January - Milan, insulation thickness of 8 cm, internal loads of 20 W/m2
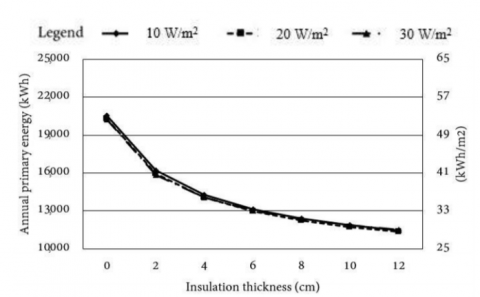
In the climatic context of Rome (Central Italy, warm summers and cold winters), there is a reduction of annual primary energy for heating and cooling with the increasing of thermal insulation thickness, for all the proposals A (Figure 8a), B (Figure 8b) and C (Figure 8c). The reduction is gradually decreasing. From the energy point of view, the best proposal is B. The proposal B is better than C because the basement storey represents a suitable cold source in summer, so a not insulated floor of the ground storey is preferable. As shown in the seasonal primary energy analysis (Figure 9), for a thickness higher than 4-6 cm, the energy demand for cooling is higher than energy demand for heating. Moreover, the energy requirement for cooling increases with the insulation thickness for values higher than 2 cm.
Figure 8a. Annual primary energy requirement as a function of the insulation thickness - Proposal A for Rome
In the Figure 10, there is the DPB analysis in the case of Rome. It shows that the most convenient thickness is about 6-8 cm. A higher insulation thickness reduces the economic convenience of the investment. Using the legislative limits of thermal transmittance, the thicknesses are in the range 8-10 cm: so, the obtained optimal thermal insulation thickness is slightly lower.
Figure 8b. Annual primary energy requirement as a function of the insulation thickness - Proposal B for Rome
Figure 8c. Annual primary energy requirement as a function of the insulation thickness - Proposal C for Rome
Figure 9. Seasonal primary energy requirement as a function of the insulation thickness- Proposal B for Rome, 20 W/m2
In terms of thermal comfort, when applying an insulation thickness of 6 cm, the PMV index in the office 6 (one of the most disadvantaged rooms in summer) evaluated in summer conditions is acceptable (Table 10).
3.4 Results for Cairo
Figure 10. Discounted payback as a function of the insulation thickness - Proposal B for Rome
Table 10. PMV for office 6 on 20 August - Rome, insulation thickness of 6 cm, internal loads of 20 W/m2
In the climatic context of Cairo (Egypt, very warm climate), the energetic analysis (Figures 11a, 11b, and 11c) shows that annual primary energy requirement grows with the insulation thickness, for each proposal, because summer is very warm and winter is mild: thus, the application of insulating material is not convenient. This is due to seasonal energy trends (Figure 12), which confirms that summer energy demand is larger than winter one. Really, the application of an insulating layer up to a thickness of 2 cm leads to a very slight decrease in energy requirements, but it is not enough to obtain the minimum DPB, as demonstrated by a DPB analysis not reported in this paper.
Figure 11a. Annual primary energy requirement as a function of the insulation thickness- Proposal A for Cairo
In this paper, an existing office building is analysed under dynamic thermal conditions to find the optimal insulation thickness. Three cases (A - thermal insulation on the walls; B - thermal insulation on the walls and the roof slab; C - thermal insulation on the walls, the roof slab and the floor of the ground storey) are compared by evaluating the primary energy requirements for heating and cooling and discounted payback periods, considering four Mediterranean climates.
In all these climatic zones, when applying thermal insulation thickness over 2 cm, there is an increasing of the summer energy requirements, while the winter energy demand always decreases with the insulation thickness increasing. Considering the annual primary energy demands and a discounted payback analysis, the following optimal insulation thickness values are obtained, depending on the climate:
Moreover, a comparison between the optimal insulation thicknesses obtained in this study and those necessary to respect the Italian legislative rules shows that the first ones are greater than the second ones in the cases of Rome and mainly Palermo, while they are similar in the case of Milan.
The proposal that provides the greatest energy savings and simultaneously leads to the lowest payback period is the proposal B, except for Milan. In fact, in the cold winters of Milan the proposal B is not adequate in terms of thermal comfort (in this case, the most suitable proposal is C).
Anyway, when using the obtained optimal insulation thicknesses, acceptable comfort levels are obtained also in the most disadvantaged rooms.
Figure 11b. Annual primary energy requirement as a function of the insulation thickness - Proposal B for Cairo
Figure 11c. Annual primary energy requirement as a function of the insulation thickness - Proposal C for Cairo
Figure 12. Seasonal primary energy demand as a function of the insulation thickness- Proposal B for Cairo, 20 W/m2
This work was developed in the framework of the European project “Italian Training qualificatiOn Workforce in buildiNg” (Acronym: BUILD UP Skills I-TOWN), Intelligent Energy - Europe (IEE), Call for proposals CIP-IEE-2013 - BUILD UP Skills Initiative. Contract N°: IEE/13/BWI/721/SI2.680178.
|
c |
specific heat capacity, J. kg-1. K-1 |
|
COP |
Coefficient Of Performance |
|
DPB |
Discounted Payback, years |
|
EER |
Energy Efficiency Ratio |
|
k |
internal areal heat capacity, J. m-2. K-1 |
|
PMV |
Predicted Mean Vote |
|
s |
thickness, m |
|
R |
unitary thermal resistance, m2. K. W-1 |
|
U |
unitary thermal transmittance, W.m-2. K-1 |
|
Y Greek symbols |
dynamic transmittance, W.m-2.K-1
|
|
λ |
thermal conductivity, W. m-1. K-1 |
|
ρ |
density, kg. m-3 |
[1] Citterio M. (2009), Analisi statistica sul parco edilizio non residenziale e sviluppo di modelli di calcolo semplificati [Online], ENEA, Italy, (in Italian) Available: http://old.enea.it/attivita_ricerca/energia/sistema_elettrico/condizionamento/RSE161.pdf.
[2] Citterio M. (2009), Determinazione dei fabbisogni e dei consumi energetici dei sistemi edificio-impianto. Caratterizzazione del parco immobiliare ad uso ufficio [Online], ENEA, Italy (in Italian). Available: http://www.enea.it/it/Ricerca_sviluppo/documenti/ricerca-di-sistema-elettrico/condizionamento/rse163.pdf
[3] EURAC, D2.1a Survey on the energy needs and architectural features of the EU building stock, in: iNSPiRE Project - Development of Systemic Packages for Deep Energy Renovation of Residential and Tertiary Buildings including Envelope and Systems [Online], pp. 33-46, 2014. Available: http://www.inspirefp7.eu/wpcontent/uploads/2014/08/WP2_D2.1a_20140523_P18_Survey-on-the-energy-needs-and-architectural-features.pdf
[4] Bellia L., De Falco F. and Minichiello F., “Effects of solar shading devices on energy requirements of standalone office buildings for Italian climates,” Applied Thermal Engineering, vol. 45, no. 21, pp. 190-201, 2013. DOI: 10.1016/j.applthermaleng.2013.01.039.
[5] Bellia L., Marino C., Minichiello F. and Pedace A., “An Overview on Solar Shading Systems for Buildings,” Energy Procedia, vol. 62, pp. 309-317, 2014. DOI: 10.1016/j.egypro.2014.12.392.
[6] Marino C., Minichiello F. and Bahnfleth W., “The influence of surface finishes on the energy demand of HVAC systems for existing buildings,” Energy and Buildings, vol. 95, pp. 70-79, 2015. DOI: 10.1016/j.enbuild.2015.02.036.
[7] Marino C. and Minichiello F., “Existing Buildings and HVAC Systems: Incidence of Innovative Surface Finishes on the Energy Requirements,” Energy Procedia, vol. 82, pp. 499-505, 2015. DOI: 10.1016/j.egypro.2015.11.860.
[8] Kaynakli O., “A review of the economical and optimum thermal insulation thickness for building applications,” Renewable and Sustainable Energy Reviews, vol. 16, pp. 415-425, 2012. DOI: 10.1016/j.rser.2011.08.006.
[9] Bolatturk A., “Determination of optimum insulation thickness for building walls with respect to various fuels and climate zones in Turkey,” Applied Thermal Engineering, vol.26, no. 11, pp. 1301–1309, 2006. DOI: 10.1016/j.applthermaleng.2005.10.019.
[10] Yu J., Yang C., Tian L. and Liao D., “A study on optimum insulation thicknesses of external walls in hot summer and cold winter zone of China,” Applied Energy, vol. 86, no. 11, pp. 2520-2529, 2009. DOI: 10.1016/j.apenergy.2009.03.010.
[11] Ucar A. and Balo F., “Determination of the energy savings and the optimum insulation thickness in the four different insulated exterior walls,” Renewable Energy, vol. 35, no. 1, 88-94, 2010. DOI: 10.1016/j.renene.2009.07.009.
[12] Zedan M. F. and Mujahid A. M., “An efficient solution for heat transfers in composite walls with periodic ambient temperature and solar radiation,” International Journal of Ambient Energy, vol. 14, no. 2, pp. 83-98, 1993. DOI: 10.1080/01430750.1993.9675599.
[13] Granja A. D. and Labaki L. C., “Influence of external surface color on the periodic heat flow through a flat solid roof with variable thermal resistance,” International Journal of Energy Research, vol. 27, no. 3, pp. 771-779, 2003. DOI: 10.1002/er.915.
[14] Daouas N., Hassen Z. and Aissia H. B., “Analytical periodic solution for the study of thermal performance and optimum insulation thickness of building walls in Tunisia,” Applied Thermal Engineering, vol. 30, no. 4, pp. 319-326, 2010. DOI: 10.1016/j.applthermaleng.2009.09.009.
[15] Dombayci O. A., “The environmental impact of optimum insulation thickness for external walls of buildings,” Building and Environment, vol. 42, no. 11, pp. 3855-3859, 2007. DOI: 10.1016/j.buildenv.2006.10.054.
[16] Comakli K. and Yuksel B., “Environmental impact of thermal insulation thickness in buildings,” Applied Thermal Engineering, vol. 24, no. 5-6, 933-940, 2004. DOI: 10.1016/j.applthermaleng.2003.10.020.
[17] Mahlia TMI. and Iqbal A., “Cost benefits analysis and emission reductions of optimum thickness and air gaps for selected insulation materials for building walls in Maldives,” Energy, vol. 35, no. 5, pp. 2242-2250, 2010. DOI: 10.1016/j.energy.2010.02.011.
[18] Yildiz A., Gurlek G., Erkek M. and Ozbalta N., “Economical, environmental analyses of thermal insulation thickness in buildings” [Online], Journal of Thermal Science and Technology, vol. 28, no. 2, pp. 25-34, 2008. Available: http://www.tibtd.org.tr/2008-2/25-34.pdf
[19] Ascione F., Cheche N., De Masi R. F., Minichiello F. and Vanoli G. P., “Design the refurbishment of historic buildings with the cost-optimal methodology: The case study of a XV century Italian building,” Energy and Buildings, vol. 99, pp. 162-176, 2015. DOI: 10.1016/j.enbuild.2015.04.027.
[20] Ozel M., “Cost analysis for optimum thicknesses and environmental impacts of different insulation materials,” Energy and Buildings, vol. 49, pp. 552–559, 2012. DOI: 10.1016/j.enbuild.2012.03.002.
[21] Yu J., Tian L., Yang C., Xu X. and Wanga J., “Optimum insulation thickness of residential roof with respect to solar-air degree-hours in hot summer and cold winter zone of China,” Energy and Buildings, vol. 43, no. 9, pp. 2304–2313, 2011. DOI: 10.1016/j.enbuild.2011.05.012.
[22] Oliveti G., Arcuri N., Mazzeo D. and De Simone M., “A new parameter for the dynamic analysis of building walls using the harmonic method,” International Journal of Thermal Sciences, vol. 88, pp. 96–109, 2015. DOI: 10.1016/j.ijthermalsci.2014.09.006.
[23] Mazzeo D., Oliveti G. and Arcuri N., “Influence of internal and external boundary conditions on the decrement factor and time lag heat flux of building walls in steady periodic regime,” Applied Energy, vol. 164, pp. 509–531, 2016. DOI: 10.1016/j.apenergy.2015.11.076.
[24]Legge 28 dicembre 2015, n. 208 Disposizioni per la formazione del bilancio annuale e pluriennale dello Stato (legge di stabilità 2016) (in Italian).
[25] Margiotta F., Puglisi G. (2009), Caratterizzazione del parco edilizio nazionale. Determinazione dell’edificio tipo per uso ufficio, ENEA, Italy, (in Italian).
[26] ASHRAE. International Weather files for Energy Calculations (IWEC weather files). User’s manual and CD-ROM, American Society of Heating, Refrigerating and Air-Conditioning Engineers, Atlanta, GA, USA, 2001.
[27] Ministero dello Sviluppo Economico, Decreto Interministeriale del 26 giugno 2015 - Applicazione delle metodologie di calcolo delle prestazioni energetiche e definizione delle prescrizioni e dei requisiti minimi degli edifici (in Italian).
[28] Decreto del Presidente della Repubblica 2 aprile 2009, n.59, Regolamento di attuazione dell'articolo 4, comma 1, lettere a) e b), del decreto legislativo 19agosto 2005, n. 192, concernente attuazione della direttiva 2002/91/CE sul rendimento energetico in edilizia (in Italian).
[29] Decreto del Presidente della Repubblica 26 agosto 1993, n.412, Regolamento recante norme per la progettazione, l'installazione, l'esercizio e la manutenzione degli impianti termici degli edifici ai fini del contenimento dei consumi di energia, in attuazione dell'art. 4, comma 4,
[30] U.S. Department of energy. DesignBuilder 3.2.0.67