OPEN ACCESS
The kinetic constant rate of the slow pyrolysis process has been estimated, at non-isothermal states, through TGA analysis (Thermogravimetry) for two typologies of biomass: peach and apricot pits. Thermal degradation was implemented using two heating rates (HR), 10 °C/min and 20 °C/min, with the aim of estimating the influence of such parameter on the process kinetics. Results, obtained through the Derivative Thermogravimetric Analysis (DTGA), illustrate that volatilization of both peaches and apricots starts at 200 °C and degradation mainly takes place in the temperature range 200-400 °C. At the end of the thermal degradation process (T = 600 °C), the amount of weight loss was 63÷73% and 58÷60% respectively for peach and apricot pits.
It was found that the heating rate considerably influences the weight loss and kinetic constants. Higher heating rates provoke the shift of thermograms towards more elevated temperatures. The energy of activation of the pyrolysis process was calculated by the Friedman model and, for the HR of 10 C/min, it was discovered that this one is fairly independent by the range of conversion. Instead, for the HR of 20 °C/min, the energy of activation decreases, in average by 35%, while the conversion range rises.
Biomass, Friedman method, HR, Slow pyrolysis, TGA.
Gasification and pyrolysis are thermo-chemical processes of biomass degradation very intricate, since they are influenced by several operative conditions [1, 2]. Among these ones, there are the temperature at which the process is implemented; the reactor heating rate (HR); the duration of the treatment. Both the yields of the process products and their qualitative characteristics result very influenced by the above-listed parameters.
In comparison with fast pyrolysis, the slow pyrolysis process is carried out using very low HRs and long-lasting treatments, with the aim to maximize the char yield. A correct planning of the biomass treatment requires an accurate evaluation of the process constant rate. Moreover, the entropy production during such process allow determining the environmental impact index [3].
The TGA analysis allows estimating the volatilization kinetic parameters of the slow pyrolysis: the frequency factor and the energy of activation that characterize the mathematical expression of Arrhenius. This experimental and analytical procedure is very frequently utilized in the studies concerning wood carbonization and thermal decomposition of solid components, among these the biomass [4-17].
During the TGA, the weight loss, due to the volatilization process, is recorded in function of the increase of time/ temperature.
From the first derivative (in function of the time) of the TGA, named Derivative Thermogravimetric Analysis (DTGA), it is possible to identify the biomass conversion values, which allow the determination of the Arrhenius parameters and the definition of the highest constant rate.
Mathematical models, built on the thermogravimetric data, especially non isothermal models, allow a trustworthy prediction of the biomass pyrolysis kinetics. However, the kinetic parameters, calculated by isothermal models, even if less reliable, are characterized by the advantage to be not influenced by the specific mathematical model used [18].
Isoconversional models or free models are denominated in this way since they hypothesize constant the conversion degree of biomass and, hence, the constant rate only function by the process temperature. Thanks to these hypotheses it is possible to avoid of arbitrarily supposing the mathematical expression of the constant rate, without knowing the real chemical mechanism of thermal volatilization of biomass [19].
The analytical elaboration of the TGA experimental data through the isoconversional methods can be: integral; differential.
The spread of the differential methods was aided by the recent advancements in the branch of the mathematical functions able to fit conspicuous series of experimental data [19, 20].
The differential free model of Friedman [21] is quite widespread in literature studies for calculating the kinetic terms of the mathematical expression of Arrhenius [22-24].
In the research activity discussed in this paper, the Arrhenius kinetic terms of peach and apricot pits (hemicellulose and cellulose) were evaluated, through the thermogravimetric analysis, for the process of slow pyrolysis. It was applied the Friedman model, to fit the experimental data of the thermogravimetric analysis conducted at two HRs, that were 10.0 and 20.0 °C/min.
Friedman differential model was applied, among the ones available in scientific literature, since it does not overrate the kinetic parameters in comparison with the integral models. Moreover, the model was selected for its trustworthiness in the examined conversion range (sufficiently distant from the initial and the final instants of the biomass degradation). Finally, the Friedman differential model is a very trustworthy method among the isoconversional ones.
This study provides useful information for the implementation of kinetic mathematical models with the aim to optimize the pyrolysis process efficiency. Indeed, this kind of models require the knowledge of the values of the kinetic parameters as input data. These values, which are specific for each biomass and linked to the operative conditions (especially the HR), can be derived by a TGA experimental study coupled with a fitting mathematical model as, for example, the Friedman method.
Moreover, the investigated biomasses are very spread in Italy. Indeed, in accordance with the Italian government (recent data, 2006-2010), the farming production of peaches and apricots was respectively of 1.040.000 and 222.000 tons. Part of this production, was addressed to the factories, which produced 19.000 and 3.000 tons of residuals of peach and apricot pits respectively.
2.1 Samples of peach and apricot pits
Samples of peach pits (PP) and apricot pits (AP) were grinded with the aim to achieve a size smaller than 140 mesh.
Then, proximate analysis, according to ASTM Standard D5142-04, and ultimate/chemical analysis, according to ASTM Standard D5373-2, were carried out.
Tables 1 and 2 summarize the proximate analysis (Prox_A) and ultimate/chemical analysis (Ultm_A).
Both PP and AP are characterized by a high percentage on weight of volatile substances and O (oxygen).
Table 1. Results of Prox _A
|
Parameter |
PP weight (wt.) |
AP weight (wt.) |
|
Moisture |
4.0% |
4.0% |
|
Volatiles |
85.4% |
80.6% |
|
Fixed carbon |
10.3% |
15.2% |
|
Ashes |
0.3% |
0.2% |
Table 2. Results of Ultm _A
|
Parameter |
PP weight (wt.) |
AP weight (wt.) |
|
C |
47.1% |
51.5% |
|
H |
6.4% |
6.3% |
|
O |
46.1% |
41.9% |
|
N+S |
0.4% |
0.3% |
2.2 TGA instrument and experimental activity
A Linseis STA PT 1600 instrument was used for developing the thermogravimetric analysis. The slow pyrolysis process, from 20.0 °C to the final temperature of 600.0 °C, was conducted in a metal vessel, able to contain 20 mg of sample, where 50 cm3/min of nitrogen were fluxed. The degradation process was tested at two HRs 10.0 and 20.0 °C/min.
The DTGA plots have been built from the experimental TGA values. However, the DTGA curve, obtained through the mathematical differentiation of the TGA curve, showed a bad quality [20, 25], which made worse with the decrease of the HR.
Consequently, it was necessary to apply an analytical procedure, before of carrying on the mathematical differentiation of the TGA data. With the aim to reduce the noise in the TGA, the “moving average” was applied to smooth out irregularities (peaks and valleys) in the experimental data and to easily recognize their trends.
Such procedure allowed the considerable improvement of the TGA data and, consequently, allowed of obtaining trustworthy and accurate results through the successive mathematical fitting.
2.3 Friedman isoconversional differential model
The kinetic models are built on a mathematical expression which links the constant rate, k(T), even named “reaction rate”, to the process temperature.
The Arrhenius mathematical expression describes this link and it is the following:
$k(T)=F_{f} \exp \left(-\frac{A_{E}}{R T}\right)$(1)
In Eq.(1): T is the temperature expressed in Kelvin; R is the universal constant (ideal gases); AE is the energy of activation of the degradation process (that is the minimal amount of energy that must be exceeded so that the chemical reactions can occur); Ff is pre-exponential factor, even known as “frequency factor”.
This last one takes into account the “frequency” of the molecular impacts which take place independently of their energy content.
The exponential part, in Eq.(1), indicates the molecular impacts which have a level of kinetic energy capable to provoke the chemical reaction.
Even if the pre-exponential factor is lightly influenced by T, the part mainly influenced by T, in Eq.(1), is the exponential one [26].
Eq.(2) describes the biomass thermal volatilization [27]:
$\frac{d \beta}{d t}=k(T) g(\beta)=F_{f} \exp \left(\frac{-A_{E}}{R T}\right) g(\beta)$(2)
In Eq.(2), g(β) is a mathematical function which expresses the degradation of biomass.
This function is strongly linked to the particular mechanism of devolatilization, which was supposed. The term t represents the time, whereas b represents the degree of conversion of biomass ( $\beta=0 \div 1$ ).
This last one, even named “reaction extend”, is expressed by Eq.(3):
$\beta=\frac{w_{\text {init.}}-w_{t}}{w_{\text {init}}-w_{\text {fin.}}}$(3)
with: winit. biomass initial weight; wfin. biomass final weight; wt biomass weight at the time t.
The HR, is defined as the variation of the reactor temperature, T, as a function of the time (dT/dt).
In the case of a thermogravimetric analysis, characterized by linear HR of the reactor, it is possible to write Eq.(4):
$\frac{d \beta}{d T}=\frac{d \beta}{d t} \cdot \frac{d t}{d T}=\frac{1}{H R} F_{f} \exp \left(\frac{-A_{E}}{R T}\right) g(\beta)$(4)
The models known as “based on the order” hypothesize the variation of the biomass conversion degree, “dβ ”, with respect to the temperature, T, proportional to the part of biomass that didn’t convert in volatiles substances, raised to an exponent “m” which represents the order of the thermal degradation mechanism [28].
Hence, for these typology of models, $g(\beta)=(1-\beta)^{m}$ , and the Eq.(4) becomes:
$\frac{d \beta}{d T}=\frac{F_{f}}{H R} \exp \left(\frac{-A_{E}}{R T}\right)(1-\beta)^{m}$(5)
The volumetric model “VM” is a model “based on the order”, which hypothesizes m = 1.
The Friedman model, which allows the calculation of the energy of activation and frequency factor of the Eq.(1), is a VM model.
Therefore, the Friedman model is represented by Eq. (6) [19, 21]:
$\frac{d \beta}{d T}=\frac{F_{f}}{H R} \exp \left(\frac{-A_{E}}{R T}\right)(1-\beta)$(6)
Plotting the quantity ln (k (T)), in function of the inverse of the absolute temperature, it is possible to obtain a straight line. The slope of this one represents -AE/R and its intercept represents ln (Ff(1-β)). Consequently, through the mathematical equation of the straight line, it is feasible to calculate the terms Ff and AE.
3.1 TGA and DTGA Analysis
The TGA and DTGA plots are reported in figures 1 and 2, in function of process temperature T, respectively for peach pits (PP) and apricot pits (AP), at the HR of 10.0 °C/min.
Instead, figures 3 and 4 exhibit TGA and the DTGA curves, as a function of pyrolysis T, respectively for PP and AP, at the HR of 20.0 °C/min.
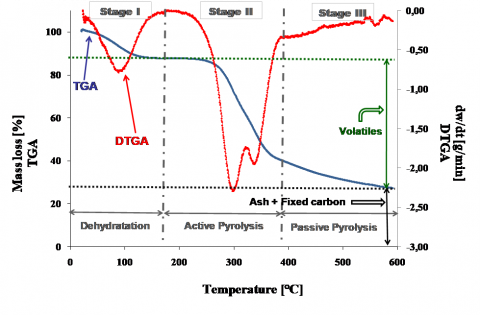
Figure 1. TGA and DTGA plots: PP (HR = 10 °C/min)
Figure 2. TGA and DTGA plots: AP (HR = 10 °C/min)
Figure 3. TGA and DTGA plots: PP (HR = 20 °C/min)
Figure 4. TGA and DTGA plots: AP (HR = 20 °C/min)
The peach pits weight loss, for the two HRs, is quite similar. However, the total weight loss is significantly higher in the case of the highest HR. It increases from 63% to 73%.
For apricot pits, the weight loss behavior is very similar for the two HRs. Indeed, the total volatilization, at the end of TGA analysis (600.0 °C), is in average 60% (58% at the lower HR and 62% at the higher HR).
The above-mentioned results indicate that the peach pits show a higher weight loss than the apricot pits, even if the process is conducted with the same operative conditions. This behavior is more evident at the higher HR, for which the total weight loss of peach pits is significantly higher (11%) than the one of the apricot pits.
The different weight loss for the two biomasses is due to their different chemical composition and structure. Peach pits have a higher content of volatile matter and oxygen (see tables 1 and 2), that facilitate the thermal degradation.
Moreover, the biomass volatilization, until the end temperature, is due to the thermal degradation of the hemicellulose “Hem”, cellulose “Cell” and lignin, whose weight percentage, contained in the biomass, strongly affects the volatilization behavior [29].
Even if the thermal degradation continues until the end temperature of 600.0 °C, for both biomasses, larger part of volatilization happens in the range 200-400 °C (in average from 11% to 58% for PP and from 7% to 50% for AP). Indeed, at temperatures higher than 400 °C, the lignin aromatization occurs. This last one implies a moderate loss of the sample mass, which corresponds to about 10% for both PP and AP.
The DTGA plots, at the two examined HRs, exhibit three main peaks. Each peak is associated at conditions of maximum constant rate.
The first peak, at the temperature of 100 °C, indicates the maximum constant rate for the process of dehydratation/ evaporation of humidity (first stage of the thermal degradation process).
The process of dehydration (6% for PP and 5% for AP pits) provokes a negligible loss of mass of the sample.
The second peak is produced at the same temperature by both biomasses (285 °C for the HR of 10.0 °C/min and 302 °C for the HR of 20.0 °C/min).
This peak is mostly due to the thermal degradation of Hem, since this biomass component usually volatilizes between 150 °C and 310 °C [17,30].
The third peak is produced at different temperatures by the two biomasses. Indeed, it occurs at higher temperatures for the apricot pits, with respect to peach pits. This phenomenon happens for both the HRs, but especially for the higher HR. In detail, at the lower HR, the DTGA third peak is produced at 336 °C in the case of PP and at 348 °C in the case of AP, whereas it occurs at 340 °and 356 °C, respectively for PP and AP, for the higher HR.
This last peak is mostly due to thermal volatilization of Cell, since this biomass component usually volatilizes between 310 °C and 410 °C [30, 31].
The higher volatilization reached by peach pits, during the slow pyrolysis process, can be even attributed to the component cellulose, that begins to decompose earlier for this kind of biomass.
It is necessary to highlight that a portion, even if negligible, of the second and the third peak of the DTGA plot, for both the biomasses, is due also to the lignin volatilization. Indeed, the lignin volatilizes already at low temperatures, anyway the constant rate of its degradation is very low and, for this reason, it carries on even at 850-900 °C [32].
The second stage of the thermal degradation, associated with hemicellulose and cellulose volatilization, known as “active pyrolysis” [33]. In this phase, the larger part of volatiles, contained inside the biomass, is released allowing the formation of char.
The third stage of the thermal degradation, associated with the final degradation of lignin, known as “passive pyrolysis” [33]. It occurs without characteristic peaks at temperatures higher than 400 °C.
Among the numerous operative conditions that significantly affect the thermal decomposition process of biomass, there is the HR.
Increasing the HR from 10.0 °C/min to 20.0 °C/min, the volatilization process, for both biomasses, shows a different behavior, as inferable by DTGA profiles. Particularly, at the HR of 20.0 °C/min, a peak of Hem more accentuated with respect to the one of Cell characterizes the DTGA plot. On the contrary, at the HR of 10.0 °C/min, the peak of Cell more accentuated with respect to the one of Hem characterizes the DTGA plot.
Furthermore, it is possible to highlight that the increase of the HR produces more accentuated peaks of the DTGA curves and that these last ones occur at higher temperatures. Other researchers that carried out the TGA analysis at different HRs [16, 17] found similar behavior.
As regards the temperatures corresponding to the DTGA peaks, they increase in average by 17 °C and 6 °C (respectively for Hem and Cell), with the increasing of the HR from 10.0 °C/min to 20.0 °C/min.
The increase of the maximum constant rate, with the HR, is related to the very complex structure of the biomass, which is composed by a great number of components, each one with a specific peak of decomposition.
When the HR is very low, the individual peaks of decomposition produce some “vibrations” in the DTGA curve. Instead, if the HR is quite high, since different biomass components volatilize at the same time, the individual peaks of volatilization overlap themselves and cause higher DTGA peaks [34].
3.2 Kinetic parameters determination
For the process of slow pyrolysis of peach and apricot pits, the use of the Friedman model allowed the calculation of the Arrhenius parameters: AE and Ff.
The calculation was carried out for both the HR taken into account in the study.
The energy of activation and the frequency factor are not the same for the entire duration of the pyrolysis process, since the biomass pyrolysis is a very complex and multistage process, which happens through many parallel and serial chemical reactions.
Consequently, these kinetic terms must be calculated for defined ranges of temperature, which correspond to the decomposition of different biomass components.
The DTGA plots are necessary for a clear individuation of these ranges.
In the current study, the Arrhenius parameters were calculated for the first and the second phase of the active pyrolysis, which is for the degradation of Hem and Cell.
The temperature ranges, used for the calculation of the kinetic parameters, are listed in tables 3 and 4, respectively corresponding to peach pits (PP) and apricot pits (AP).
In the tables, the conversion degrees β, associated to these temperatures are also listed.
Table 3. Selected temperatures and conversion degrees (PP)
|
Biomass component |
HR (°C/min) |
Temp. Range (°C) |
Conversion degree β |
|
Hem |
10 |
231 °C ¸ 285 |
9% ¸ 22% |
|
Cell |
10 |
317 °C ¸ 336 |
34% ¸42% |
|
Hem |
20 |
247 °C ¸ 302 |
13% ¸ 29% |
|
Cell |
20 |
328 °C ¸ 340 |
41% ¸ 47% |
Table 4. Selected temperatures and conversion degrees (AP)
|
Biomass component |
HR (°C/min) |
Temp. Range (°C) |
Conversion degree β |
|
Hem |
10 |
235 °C ¸ 285 |
13% ¸ 22% |
|
Cell |
10 |
329 °C ¸ 348 |
37% ¸ 44% |
|
Hem |
20 |
247 °C ¸ 302 |
9% ¸ 22% |
|
Cell |
20 |
337 °C ¸ 356 |
35% ¸ 42% |
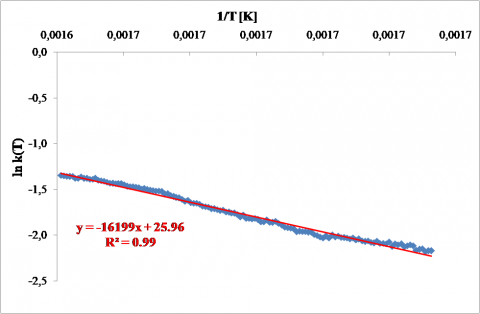
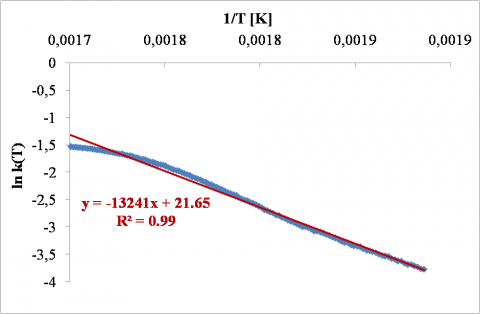
In figures 5 and 6, related to the HR of 10.0 °C/min (HR10), the plots of lnk(T) are depicted, in function of the inverse of the absolute temperature, for the Hem and Cell (peach pits PP). Instead, the plots of lnk(T), for the HR of 20.0 °C/min (HR20), are showed in the figures 7 and 8.
In figures 9 and 10, related to the HR of 10.0 °C/min (HR10), the plots of lnk(T) are depicted, in function of the inverse of the absolute temperature, for the Hem and Cell (apricot pits AP). The plots of lnk(T), at the HR of 20.0 °C/min (HR20), are showed in the figures 11 and 12.
For the eight above-mentioned plots, the equations of the best-fit straight lines were calculated as follows:
$\ln k(T)=\left(-^{A} E / R\right) \cdot \frac{1}{T}+\ln F_{f}$(7)
From the coefficients of these equations, it was possible to evaluate the energy of activation and the frequency factor. The first parameter was obtained by the value of the slope, the second one by the value of the intercept with y-axis.
The obtained kinetic parameters are listed in the tables 5 and 6.
All the best-fit straight lines have an R2 (correlation coefficient) equal to 0.99.
Consequently, the calculation of the energy of activation and of the frequency factor, obtained by the application of the Friedman model, is trustworthy, since the linear regression has showed a high performance.
Figure 5. Friedman plot: Hem, HR10 (PP)
Figure 6. Friedman plot: Cell, HR10 (PP)
Figure 7. Friedman plot: Hem, HR20 (PP)
Figure 8. Friedman plot: Cell, HR20 (PP)
Figure 9. Friedman plot: Hem, HR10 (AP)
Figure 10. Friedman plot: Cell, HR10 (AP)
Figure 11. Friedman plot: Hem, HR20 (AP)
Figure 12. Friedman plot: Cell, HR20 (AP)
From the analysis of the tables 5 and 6 (rows 1 and 3), it is possible to notice that the energy of activation of Hem is almost similar for the two HR (with a variation of about 4%), while the pre-exponential factor decreases of two orders of magnitude in the case of peaches.
Instead, the kinetic rate of Cell shows a significant reduction with the increase of the HR. The parameter AE decreases by 43% and 34% for peach and apricot pits, the frequency factor decreases by 4÷5 orders of magnitude (rows 2 and 4 in tables 5 and 6).
Therefore, it is possible to affirm that the variation of HR highly influences the pyrolysis kinetics of the Cell in comparison with the ones of Hem. This phenomenon can be attributed to the less time necessary to reach the higher temperatures (at which the cellulose degradation begins), that allows the reduction of the energy of activation required for breaking the chemical bounds.
Generally, the decrease of the energy of activation of hemicellulose and cellulose is correlated with the higher total weight loss reached at the higher HR.
Moreover, the higher total weight loss, obtained with the higher HR, can be mainly associated to the cellulose component, as consequence of the lower energy of activation required.
Further, it can be observed that, at the HR of 10.0 °C/min (rows 1 and 2 in tables 5 and 6), the kinetic parameters of Hem and Cell (whose corresponding range of conversion is 9÷44%) are almost the same, as in another literature study [17]. Such study highlights that both the kinetic parameters do not significantly vary in the range of biomass conversion 5%÷65%, if the HR value is not higher than 10.0 °C/min.
The kinetic parameters, at the HR of 20.0 °C/min (rows 3 and 4 of the tables 5 and 6), decrease significantly between the decomposition of hemicellulose and cellulose. Particularly, the energy of activation decreases by 38% and 31% for peach and apricot pits.
At the higher examined HR, the considerable variation of the constant rate, associated with the biomass conversion degree, underlines that the pyrolysis of peach and apricot pits is a “multi stages” volatilization process.
Table 5. Kinetic parameters (PP)
|
Biomass component |
HR (°C/min) |
AE (kJ/mol) |
Ff (s-1) |
|
Hem |
10 |
135 |
1.32 x 10¹² |
|
Cell |
10 |
135 |
1.88 x 10¹¹ |
|
Hem |
20 |
125 |
7.5 x 10¹⁰ |
|
Cell |
20 |
77 |
1.54 x 10⁶ |
Table 6. Kinetic parameters (AP)
|
Biomass component |
HR (°C/min) |
AE (kJ/mol) |
Ff (s-1) |
|
Hem |
10 |
111 |
5.24 x 10⁹ |
|
Cell |
10 |
116 |
2.88 x 10⁹ |
|
Hem |
20 |
110 |
2.52 x 10⁹ |
|
Cell |
20 |
76 |
8.06 x 10⁵ |
In the present study, the volatilization of peach and apricot pits has been evaluated, under two different HRs (10.0 °C/min and 20.0 °C/min), through TGA and DTGA plots.
The Friedman method was applied for calculating the kinetic parameters: energy of activation and frequency factor of both hemicellulose and cellulose.
One of the consequences of the higher HR (20.0 °C/min) is the increase of the total weight loss (at 600 °C), of about 10%.
The HR also affects the DTGA profiles, showing the shift to higher temperatures and the exhibition of higher peaks.
Further, the variation of HR influences the biomasses degradation process and the values of energy activation and frequency factor.
In the following, the main effects of the HR are discussed:
Ff Frequency Factor s-1
β Biomass Conversion Degree -
AE Energy of activation kj/mol
g(β) Conversion Function of Biomass -
HR Heating Rate °C/min
K(T) Constant rate of the Reaction s-1
m Exponent of the Reaction -
R Universal Constant of Ideal Gases j/(mol K)
T Absolute Temperature K
t Time min
wt Biomass Weight at the time t g
winit. Biomass Weight at the initial time g
wfin. Biomass Weight at the final time g
[1] A. Gagliano, F. Nocera, F. Patania, M. Bruno and D. Castaldo, “A robust numerical model for characterizing the syngas composition in a downdraft gasification process,” Comptes Rendus Chemie, in press, pp. 1-9, 2016. DOI: http://dx.doi.org/10.1016/j.crci.2015.09.019.
[2] A. Gagliano, F. Nocera, F. Patania, M. Detommaso and M. Bruno, “Evaluation of the performance of a small biomass gasifier and micro-CHP plant for agro-industrial firms,” International Journal of Heat and Technology, vol. 33, no. 4, 2015. DOI: http://dx.doi.org/10.18280/ijht.330418.
[3] G.Nicoletti, N. Arcuri, R. Bruno and G. Nicoletti “On the generalized concept of entropy for physical, extraphysical and chemical processes,” International Journal of Heat and Technology, vol. 34, Special issue 1, 2016. DOI http://dx.doi.org/10.18280/ijht.34S103.
[4] K. G. Mansaray and A. E. Ghaly, “Kinetic analyses of biomass pyrolysis using the distributed energy of activation model,” Biomass and Bioenergy, vol. 17, no. 1, pp. 19-31, 1999. DOI: http://dx.doi.org/10.1016/S0961-9534(99)00022-7.
[5] M. Lapuerta, J. J. Hernández and J. Rodrı́guez, “Kinetics of devolatilization of forestry wastes from thermogravimetric analysis,” Biomass and Bioenergy, vol. 27, no. 4, pp. 385-391, 2004. DOI: http://dx.doi.org/10.1016/j.biombioe.2003.11.010.
[6] H. B. Vuthaluru, “Investigations into the pyrolytic behavior of coal/biomass blends using thermogravimetric analysis,” Bioresourse Technology, vol. 92, no. 2, pp. 187-195, 2004. DOI: http://dx.doi.org/10.1016/j.biortech.2003.08.008.
[7] T. Sonobe and N. Worasuwannarak, “Kinetic analyses of biomass pyrolysis using the distributed energy of activation model,” Fuel, vol. 87, no. 3 pp. 414-421, 2008. DOI: http://dx.doi.org/10.1016/j.fuel.2007.05.004.
[8] D. K. Seo, S. S. Park, J. Hwang and T. Yu, “Study of the pyrolysis of biomass using thermo-gravimetric analysis (TGA) and concentration measurements of the evolved species,” Journal of Analytical and Applied Pyrolysis, vol. 89, no. 1, pp. 66-73, 2010. DOI: http://dx.doi.org/10.1016/j.jaap.2010.05.008.
[9] A. Saddawi, J. M. Jones, A. Williams and M. A. Wójtowicz, “Kinetics of the thermal decomposition of biomass,” Energy Fuels, vol. 24, no. 2, pp. 1274-1282, 2010. DOI: http://dx.doi.org/10.1021/ef900933k.
[10] L. Gašparovič, Z. Koreňová and L. Jelemenský, “Kinetic study of wood chips decomposition by TGA,” Chemical Papers, vol. 64, no. 2, pp. 174-181, 2010. DOI: http://dx.doi.org/10.2478/s11696-009-0109-4.
[11] Y. Park, J. Kim, S. Kim and Y. Park, “Pyrolysis characteristics and kinetics of oak trees using thermogravimetric analyzer and micro-tubing reactor,” Bioresourse Technology, vol. 100, no. 1, pp. 400-405, 2009. DOI: http://dx.doi.org/10.1016/j.biortech.2008.06.040.
[12] D. K. Shen, S. Gu, K. H. Luo, A. V. Bridgwater, and M. X. Fang, “Kinetic study on thermal decomposition of woods in oxidative environment,” Fuel, vol. 88, no. 6, pp. 1024-1030, 2009. DOI: http://dx.doi.org/10.1016/j.fuel.2008.10.034.
[13] A. Mahmoudi and I. Mejri, “Isothermal carbonization of wood particle: application of the lattice Boltzmann method,” International Journal of Heat and Technology, vol. 33, no. 2, 2015. DOI: http://dx.doi.org/10.18280/ijht.330221.
[14] K. Slopieck, P. Bartocci and F. Fantozzi, “Thermogravimetric analysis and kinetic study of poplar wood pyrolysis,” Applied Energy, vol. 97, pp. 491-497, 2012. DOI: http://dx.doi.org/10.1016/j.apenergy.2011.12.056.
[15] S. Ceylan and Y. Topcu, “Pyrolysis kinetics of hazelnut husk using thermogravimetric analysis,” Bioresourse Technology, vol. 156, pp. 182-188, 2014. DOI: http://dx.doi.org/10.1016/j.biortech.2014.01.040.
[16] A. Ounas, A. Aboulkas, K. El harfi, A. Bacaoui and A. Yaacoubi, “Pyrolysis of olive residue and sugar cane bagasse: Non-isothermal thermogravimetric kinetic analysis,” Bioresource Technology, vol. 102, pp. 11234-11238, 2011. DOI: http://dx.doi.org/10.1016/j.biortech.2011.09.010.
[17] U. Ozveren and Z. S. Ozdogan, “Investigation of the slow pyrolysis kinetics of olive oil pomace using thermo-gravimetric analysis coupled with mass spectrometry,” Biomass and Bioenergy, vol. 58, pp. 168-179, 2013. DOI: 10.1016/j.biombioe.2013.08.011.
[18] S. Vyazovkin and C. A. Wight, “Isothermal and non-isothermal kinetics of thermally stimulated reactions of solids,” International Reviews in Physical Chemistry, vol. 17, pp. 407-433, 1998. DOI: http://dx.doi.org/10.1080/014423598230108.
[19] J. E. White, W. J. Catallo and B. L. Legendre, “Biomass pyrolysis kinetics: A comparative critical review with relevant agricultural residue case studies,” Journal of Analytical and Applied Pyrolysis, vol. 91, pp. 1-33, 2011. DOI: http://dx.doi.org/10.1016/j.jaap.2011.01.004.
[20] J. Cai, R. Liu and C. Sun, “Logistic regression model for isoconversional kinetic analysis of cellulose pyrolysis,” Energy & Fuels, vol. 22, pp. 867-870, 2008. DOI: http://dx.doi.org/10.1021/ef7006672.
[21] H. L. Friedman, “Kinetics of thermal degradation of char-forming plastics from thermogravimetry. Application to a phenolic plastic,” Journal of Polymer Science Part C: Polymer Symposia, vol. 6, pp. 183-195, 1964. DOI: http://dx.doi.org/10.1002/polc.5070060121.
[22] P. R. Bonelli, E. G. Cerrella and A. L. Cukierman, “Slow pyrolysis of nutshells: characterization of derived chars and of process kinetics,” Energy Sources, Part A: Recovery, Utilization, and Environmental Effects, vol. 25, pp. 767-778, 2003. DOI: http://dx.doi.org/10.1080/00908310390207819.
[23] B. Jankovic, “The kinetic modeling of the non-isothermal pyrolysis of Brazilian oil shale: Application of the Weibull probability mixture model,” Journal of Petroleum Science and Engineering, vol. 111, pp. 25-36, 2013. DOI: http://dx.doi.org/10.1016/j.petrol.2013.10.001.
[24] F. Yao, Q. Wu, Y. Lei, W. Guo and Y. Xu, “Thermal decomposition kinetics of natural fibers: energy of activation with dynamic thermogravimetric analysis,” Polymer Degradation and Stability, vol. 93, pp. 90-98, 2008. DOI: http://dx.doi.org/10.1016/j.polymdegradstab.2007.10.012.
[25] S. Vyazovkin, “Computational aspects of kinetic analysis. Part C. The ICTAC kinetics project—the light at the end of the tunnel?” Thermochimica Acta, vol. 355, pp. 155-163, 2000. DOI: http://dx.doi.org/10.1016/S0040-6031(00)00445-7.
[26] J. H. Flynn, “Temperature dependence of the rate of reaction in thermal analysis: the Arrhenius equation in condensed phase kinetics,” Journal of Thermal Analysis, vol. 36, pp. 1579-1593, 1990. DOI: http://dx.doi.org/10.1007/BF01914077.
[27] R. Capart, L. Khezami and A. K. Burnham, “Assessment of various kinetic models for the pyrolysis of a microgranular cellulose,” Thermochimica Acta, vol. 417, pp. 79-89, 2004. DOI: http://dx.doi.org/10.1016/j.tca.2004.01.029.
[28] L. F. Calvo, M. Otero, B. M. Jenkins, A. Moran and A. I. Garcıa, “Heating process characteristics and kinetics of rice straw in different atmospheres,” Fuel Process Technology, vol. 85, pp. 279-291, 2004. DOI: http://dx.doi.org/10.1016/S0378-3820(03)00202-9.
[29] S. Hu, A. Jess and M. H. Xu, “Kinetic study of Chinese biomass slow pyrolysis: Comparison of different kinetic models,” Fuel, vol. 86, pp. 2778-2788, 2007. DOI: http://dx.doi.org/10.1016/j.fuel.2007.02.031.
[30] D. Vamvuka, E. Karkaras, E. Kastanaki and P. Grammelis, “Pyrolysis characteristics and kinetics of biomass residuals mixtures with lignite,” Fuel, vol. 82, pp. 1949-1960, 2003. DOI: http://dx.doi.org/10.1016/S0016-2361(03)00153-4.
[31] H. P. Yang, R. Yan, H. P. Chen, D. H. Lee and C. G. Zheng, “Characteristics of hemicellulose, cellulose and lignin pyrolysis,” Fuel, vol. 86, pp. 1781-1788, 2007. DOI: http://dx.doi.org/10.1016/j.fuel.2006.12.013.
[32] R. Font, J. Molto, A. Galvez and M.D. Rey, “Kinetic study of the pyrolysis and combustion of tomato plant,” J. Anal. Appl. Pyrol., vol. 85, pp. 268-275, 2009. DOI: http://dx.doi.org/10.1016/j.jaap.2008.11.026.
[33] M. A. Saffe, M. E. Echegaray, G. D. Mazza and R. A. Rodriguez, “Thermogravimetric analysis of peach pits under inert and air atmosphere,” Int. J. of Eng. Science and Innovative Tecnol., vol. 3, no. 6, pp. 21-30, 2014.
[34] C. Di Blasi, “Modeling chemical and physical processes of wood and biomass pyrolysis,” Prog. Energy Combust. Sci., vol. 34, pp. 47-90, 2008. DOI: http://dx.doi.org/10.1016/j.pecs.2006.12.001.